January is the time to look back at what has or hasn’t happened during the previous year. I will try, in this short review, to analyze the gold and silver market in 2014. In my next article, I will look at what could happen in 2015 for gold and silver. People often criticize me for showing long-term charts. Most often it is traders who consider anything older than a year useless and those who look back to 1970 as relics of Antiquity. However, it is a big mistake to ignore History. It does repeat itself, but not necessarily the most recent. We are going today through events that are not new but haven’t happened for more than a hundred years, some even more than 300 years. One of these events could be the collapse, not just of the dollar standard, but of the whole monetary system based on fiat money.
1970 brought the collapse of Bretton Woods, since the 2008 financial crisis we are in currency wars and, in 2014, a new Cold War started. Since the end of 2014, we have also got into commodities wars. A more discrete but ferocious gold war is also going on between the developed world and the developing world but, at center stage are the U.S. against gold and China pro gold.
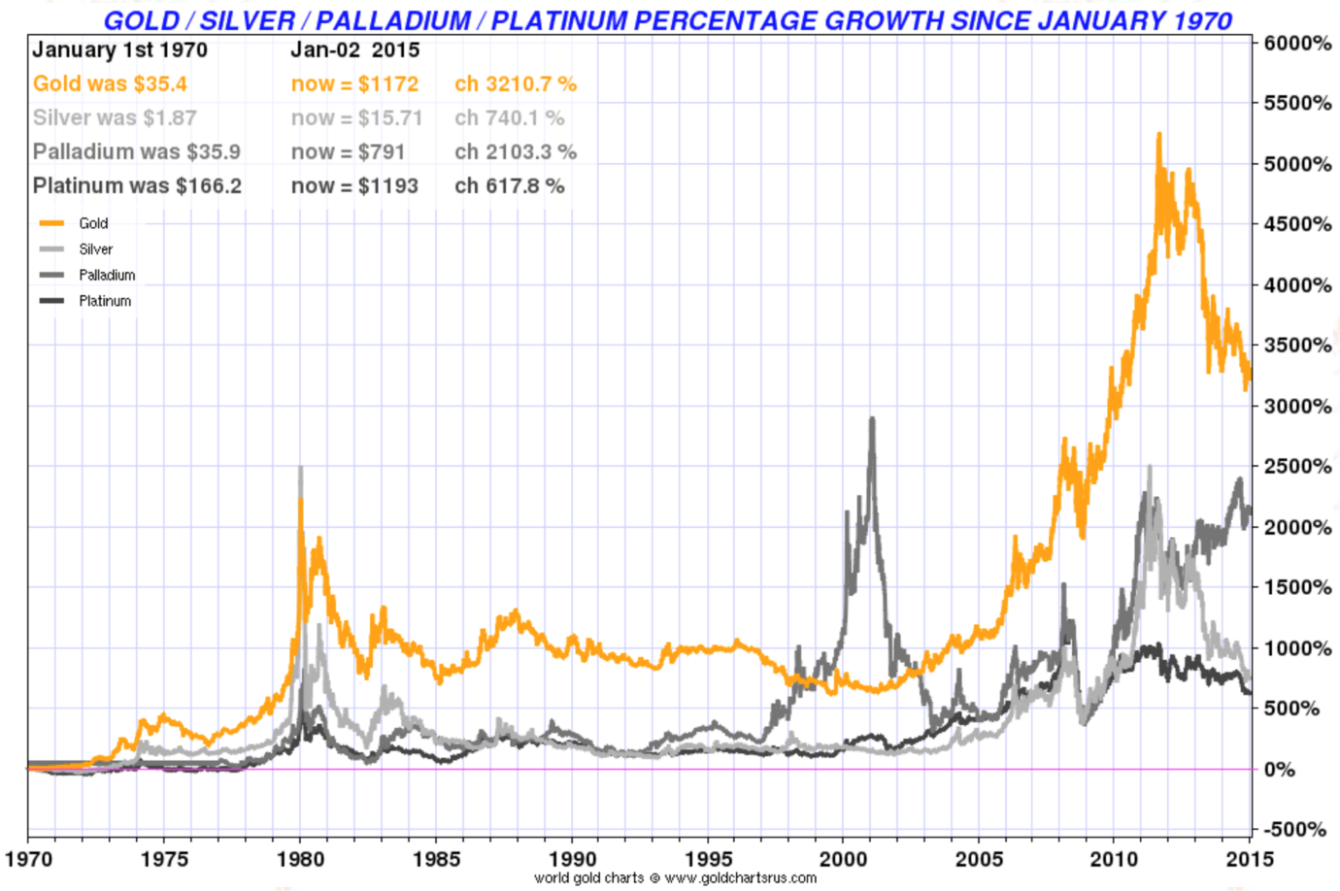
The war on gold has started at the beginning of the century with the creation of central banks but it has taken incredible proportions since the collapse of the gold exchange Bretton Woods’ system in 1971. What has happened to precious metals (gold, silver, platinum and palladium) since then? You can see in the chart below that, since 1970, even after major spikes and retracements, the total performance of precious metals is positive, with gold having the best performance of 3,210.7%, palladium 2,103.3%, silver 740.1% and platinum 617.8%.
Of the four precious metals, only gold and silver can be considered monetary metals. They have been for thousands of years, sometimes officially, but all the time de facto hard currencies. Today only gold is still a monetary metal held by central banks, but silver deserves very well the nickname of “poor man’s gold” since even if today it is mostly an industrial metal, it follows, though with more volatility, gold. When gold’s price approached a high level of $2,000, we saw a substantial increase of silver demand as an investment/monetary asset. When India imposed import restrictions on gold we observed a large increase in silver purchases and, to a much lesser extent, of platinum. This proved again that, even if today silver is mostly an industrial metal like platinum and palladium, in a monetary crisis it behaves fast as a monetary metal even if not officially. In this article, I will concentrate only on the monetary metals: gold and silver.
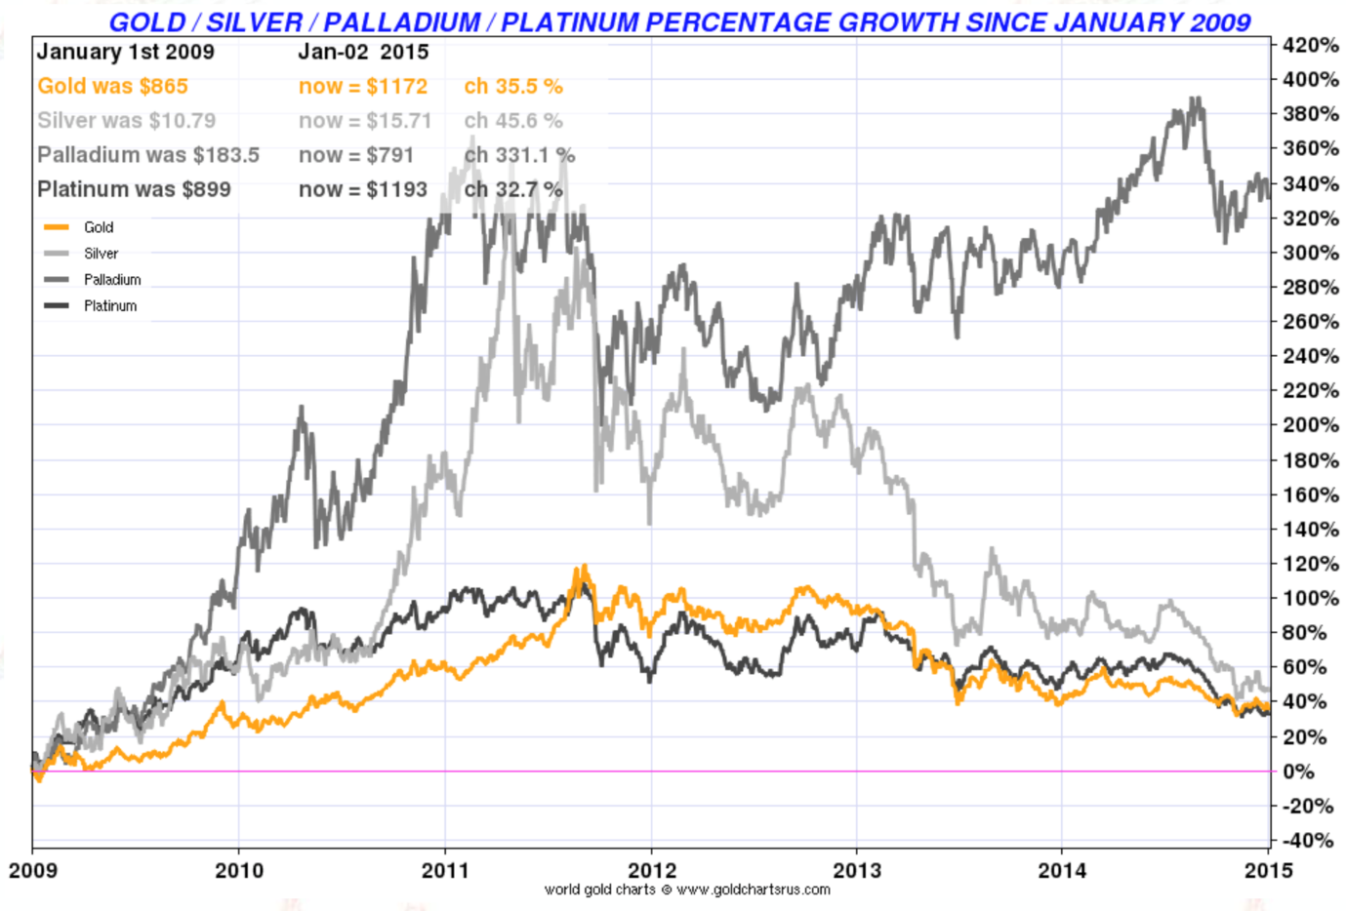
In the next chart, I chose to look at the precious metals since January 2009, which is right after the 2008 financial crisis that almost saw the collapse of the present international monetary system. Since then gold grew by 35.5%, silver by 45.6%, platinum by 32.7% and palladium by 331.1%.
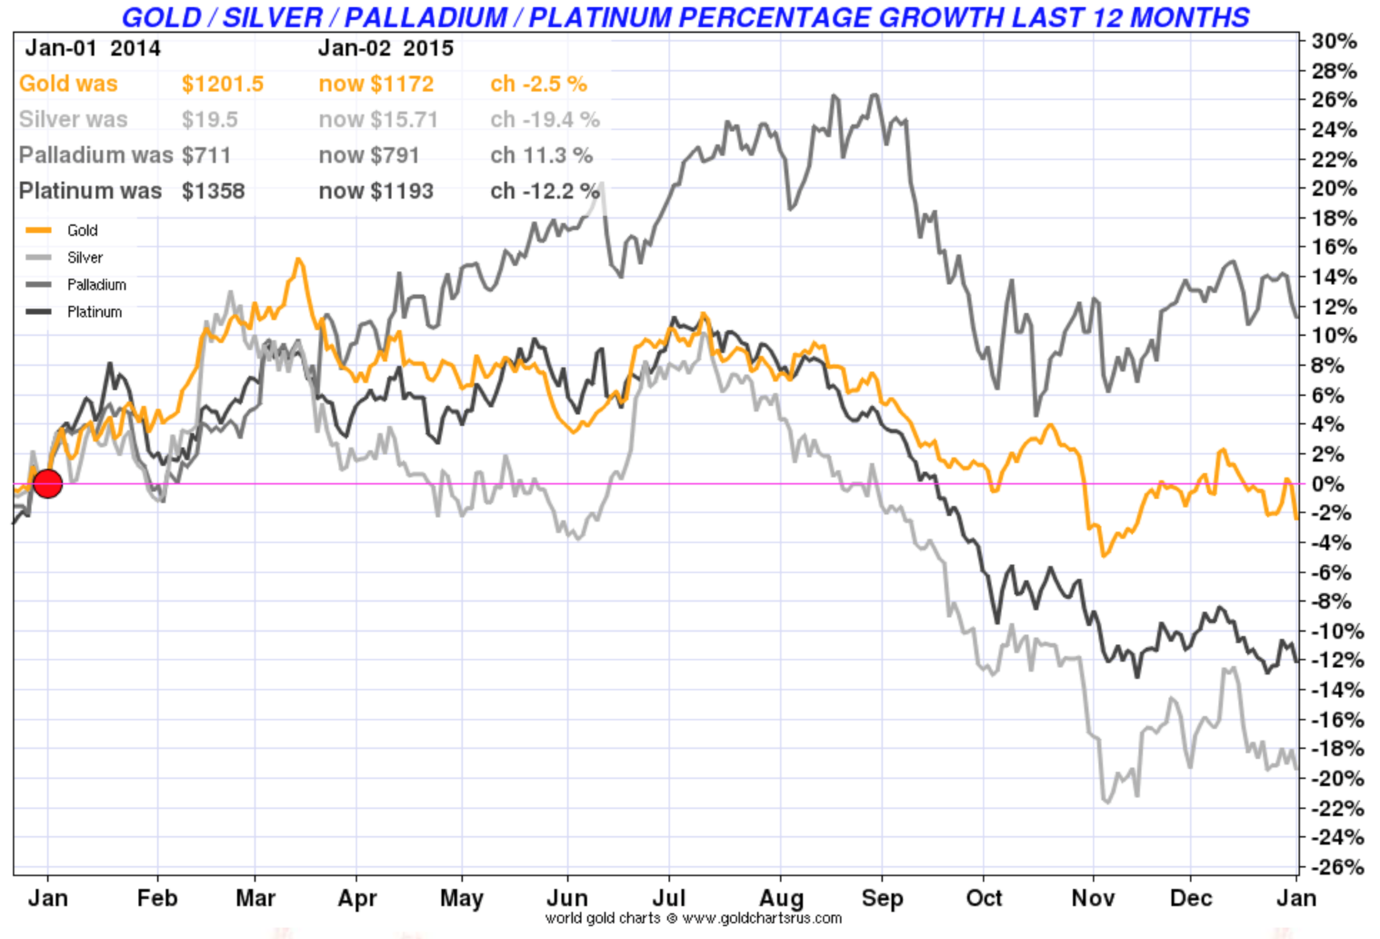
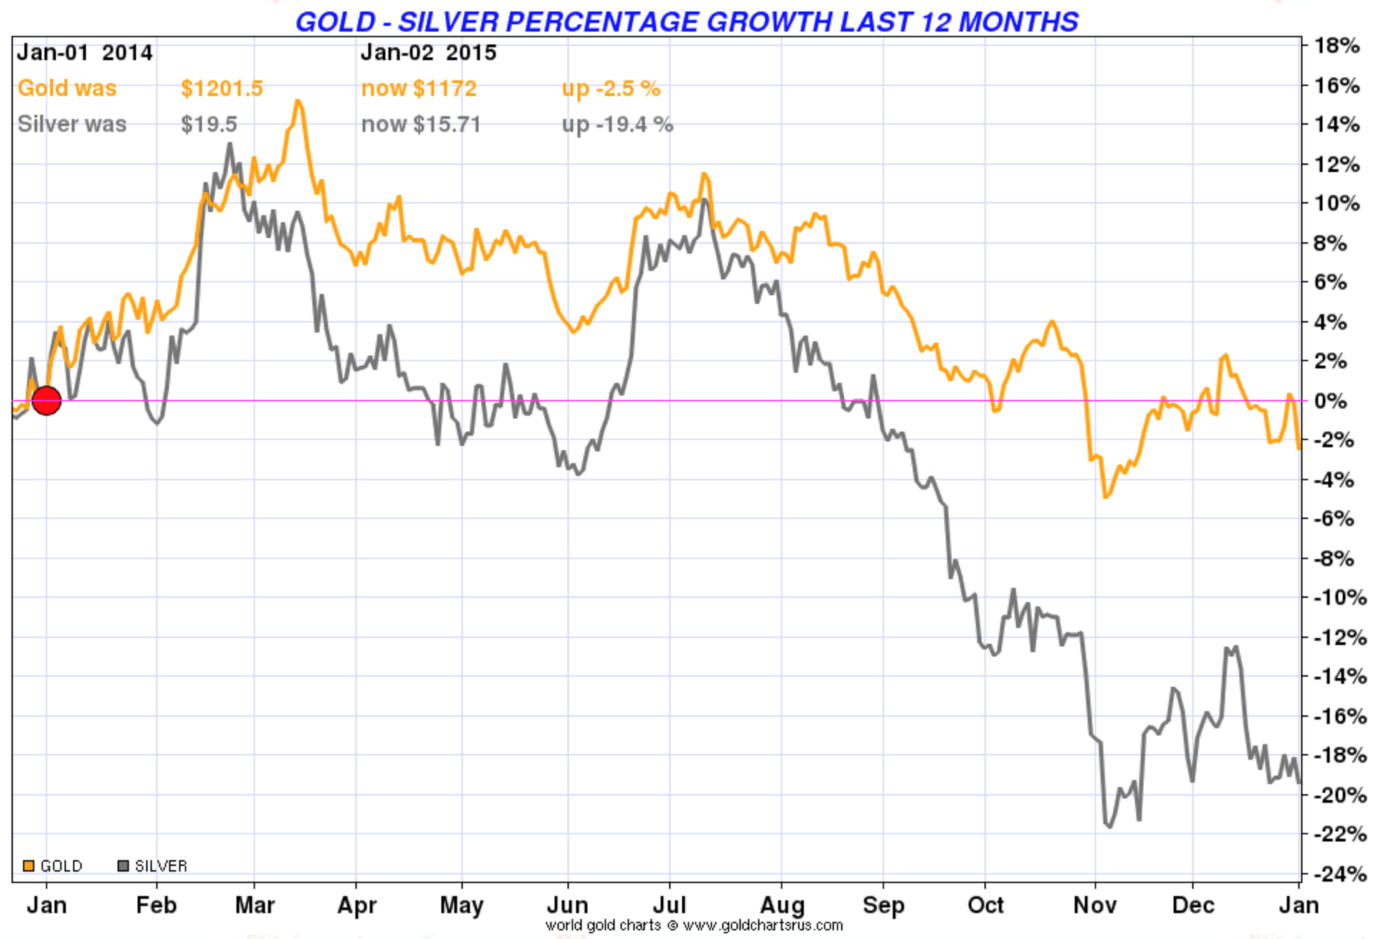
However, if we look at last year alone, we can observe that gold was almost flat with a drop of only 2.5%. Silver, on the other hand, followed industrial metals with a fall of 19.4%. The only exception was palladium with a growth of 11.3%, while platinum followed silver in negative territory with a 12.2% drop. With fear of inflation or hyperinflation gone, investors abandoned both gold and silver. Silver started to perform more as a commodity while gold remained a monetary metal supported, among others, by a large central bank demand.
In 2014, gold remained mostly into positive territory in the first half of the year and oscillated around 0% in the second half of the year. Silver, on the other hand, dropped well beyond zero in the second half, ending the year in negative territory at -19.4% vs gold -2.5%.
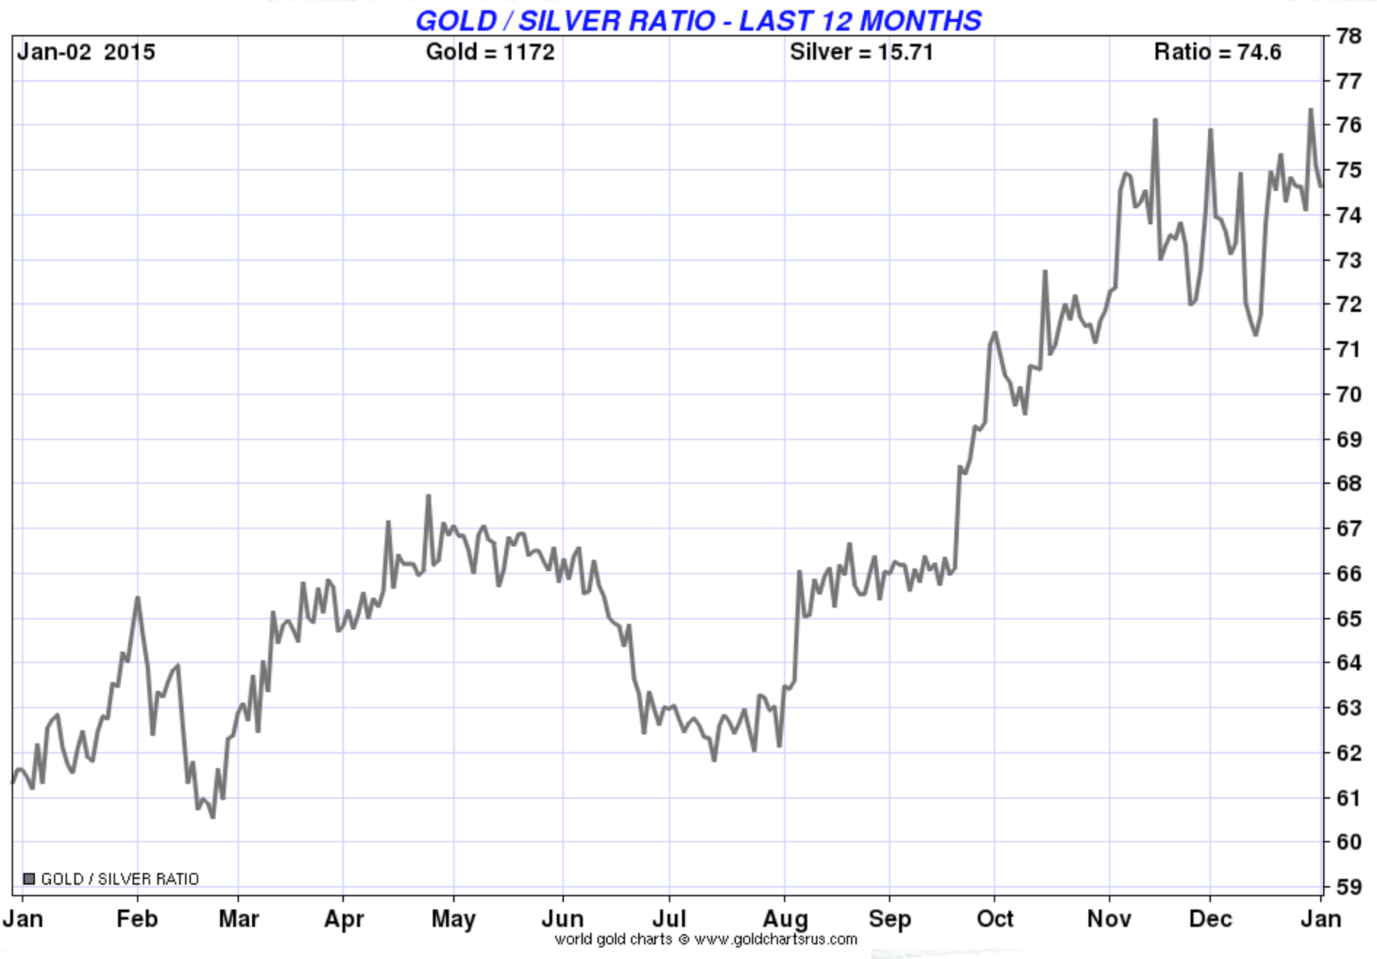
It’s interesting to look at what happened to the gold and silver ratio. In the graph below, we can see that the ratio increased substantially in the second half of the year. As the world economy collapsed, silver followed industrial metals while gold remained attentive to monetary issues.
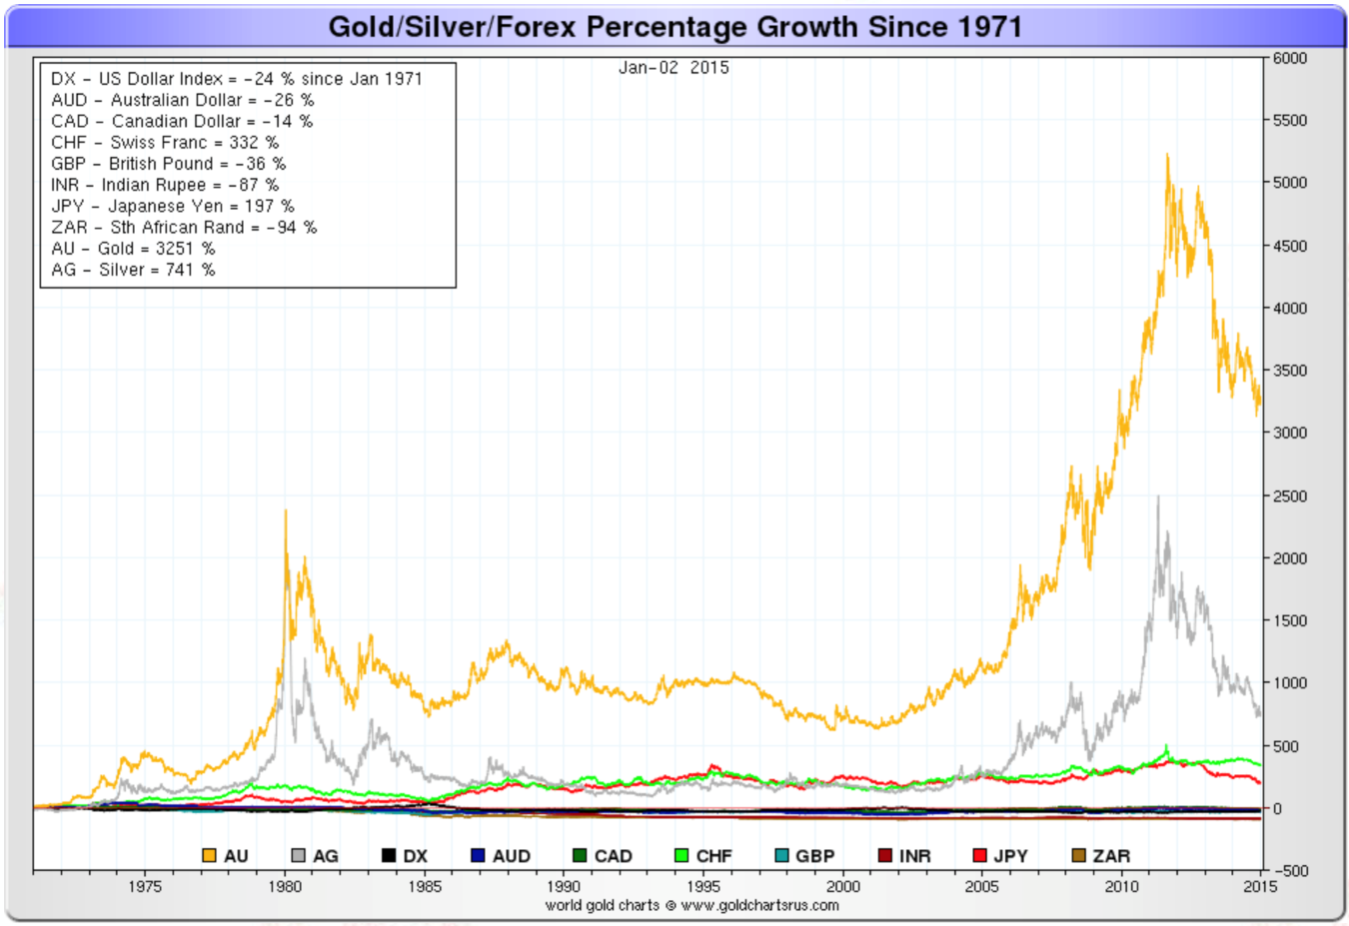
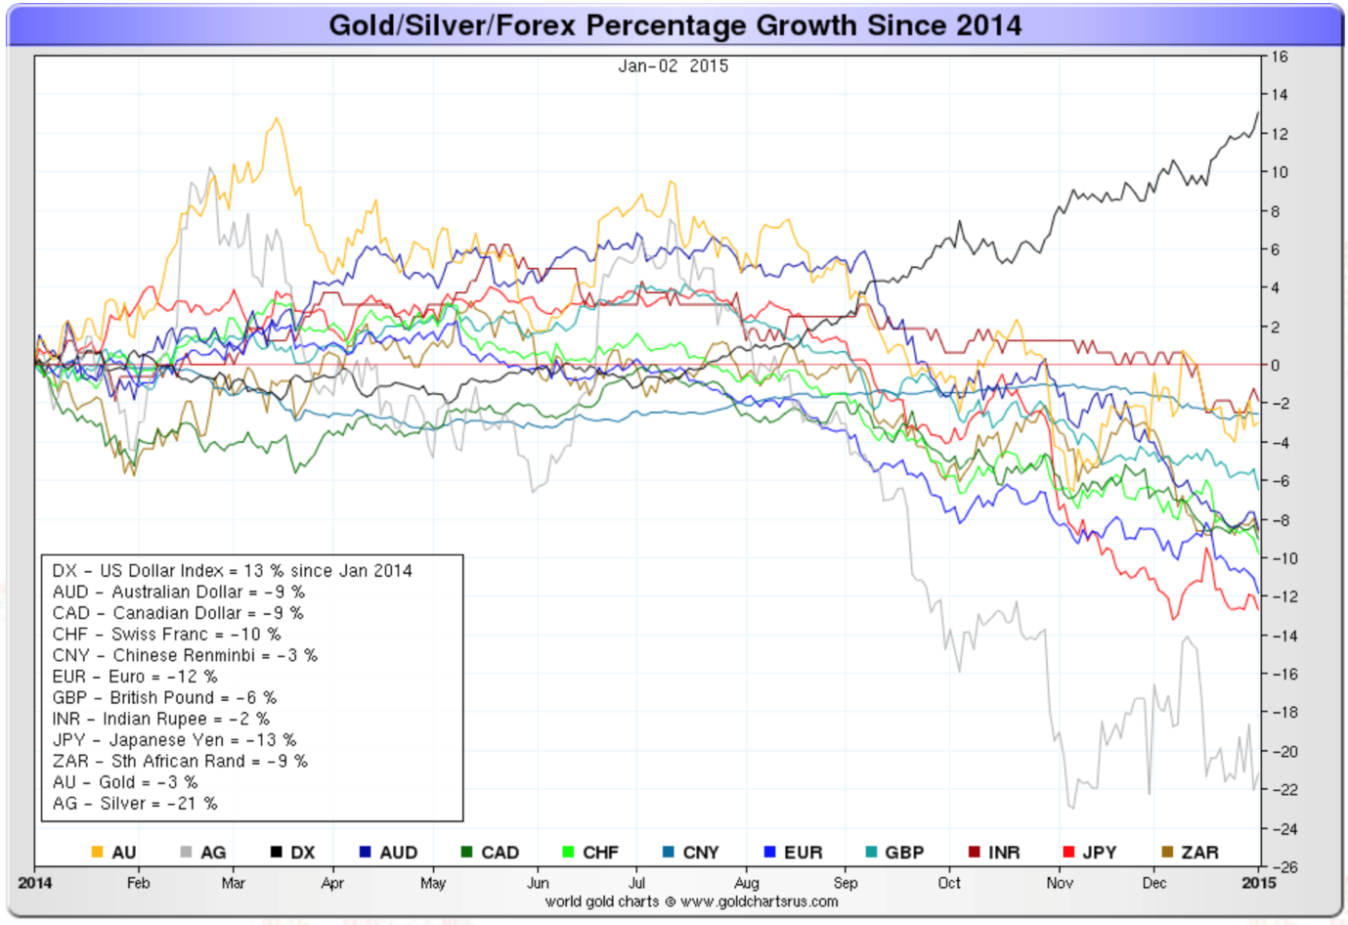
Since gold and silver are monetary metals and hard currencies, let us see how they performed against fiat currencies like the dollar and the euro. Let us start with the long-term perspective. Again, I would like to start from 1970; that corresponds to the end of the gold exchange standard. As you can see, both gold and silver have outperformed every fiat currency. Gold was up 3,251% and silver 741% in US dollars. No other fiat currency comes close or outperforms gold and silver.
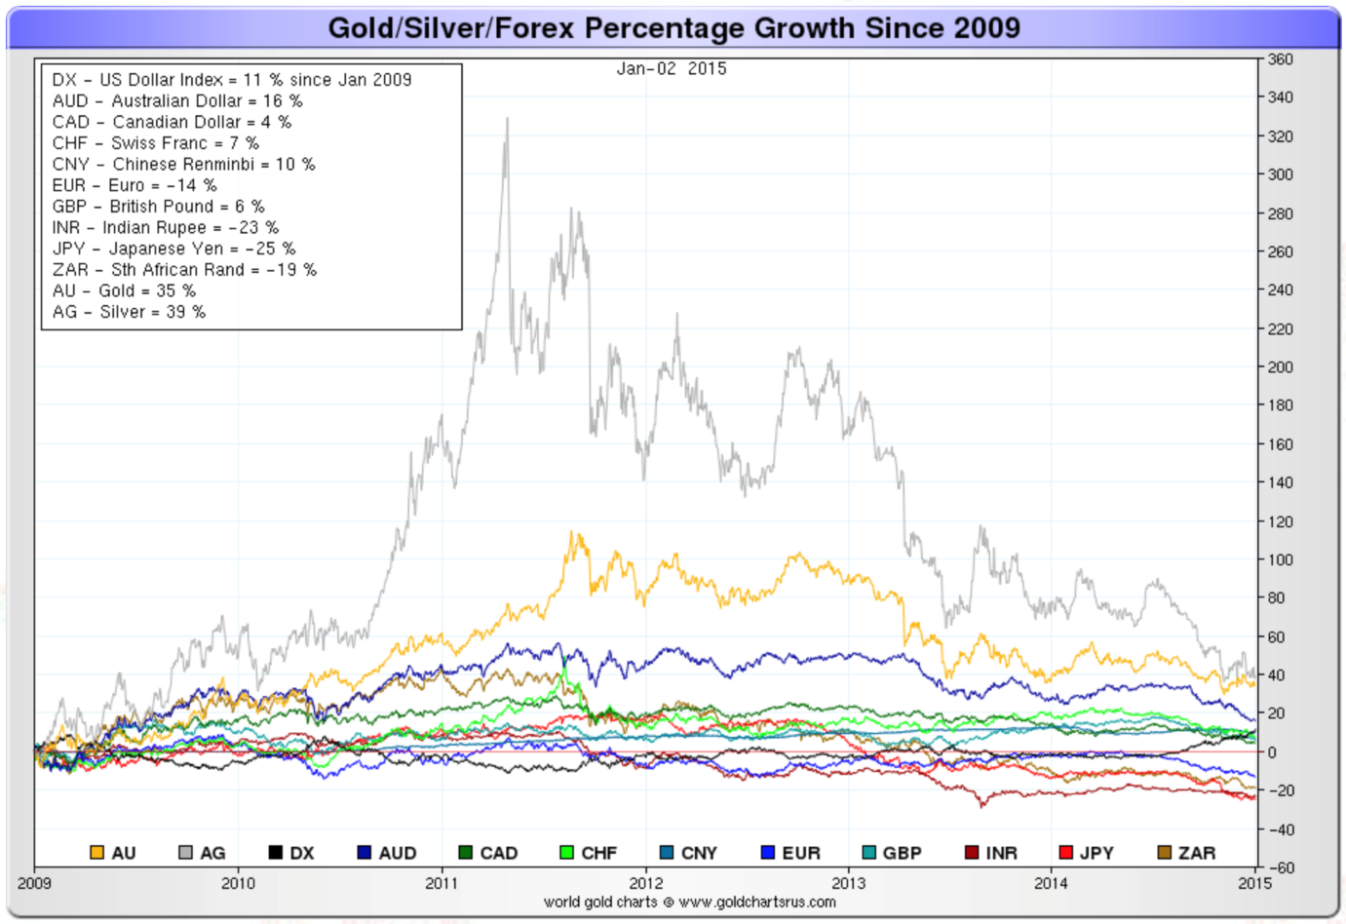
Since the end of the 2008 financial crisis, gold and silver have performed better than all the fiat currencies, with gold up 35% and silver up 39%, in US dollars.
As for the short term, gold was almost flat against the US dollar. Only the Chinese renminbi and the Indian rupee stayed close to and almost flat against the dollar, within the margin of error.
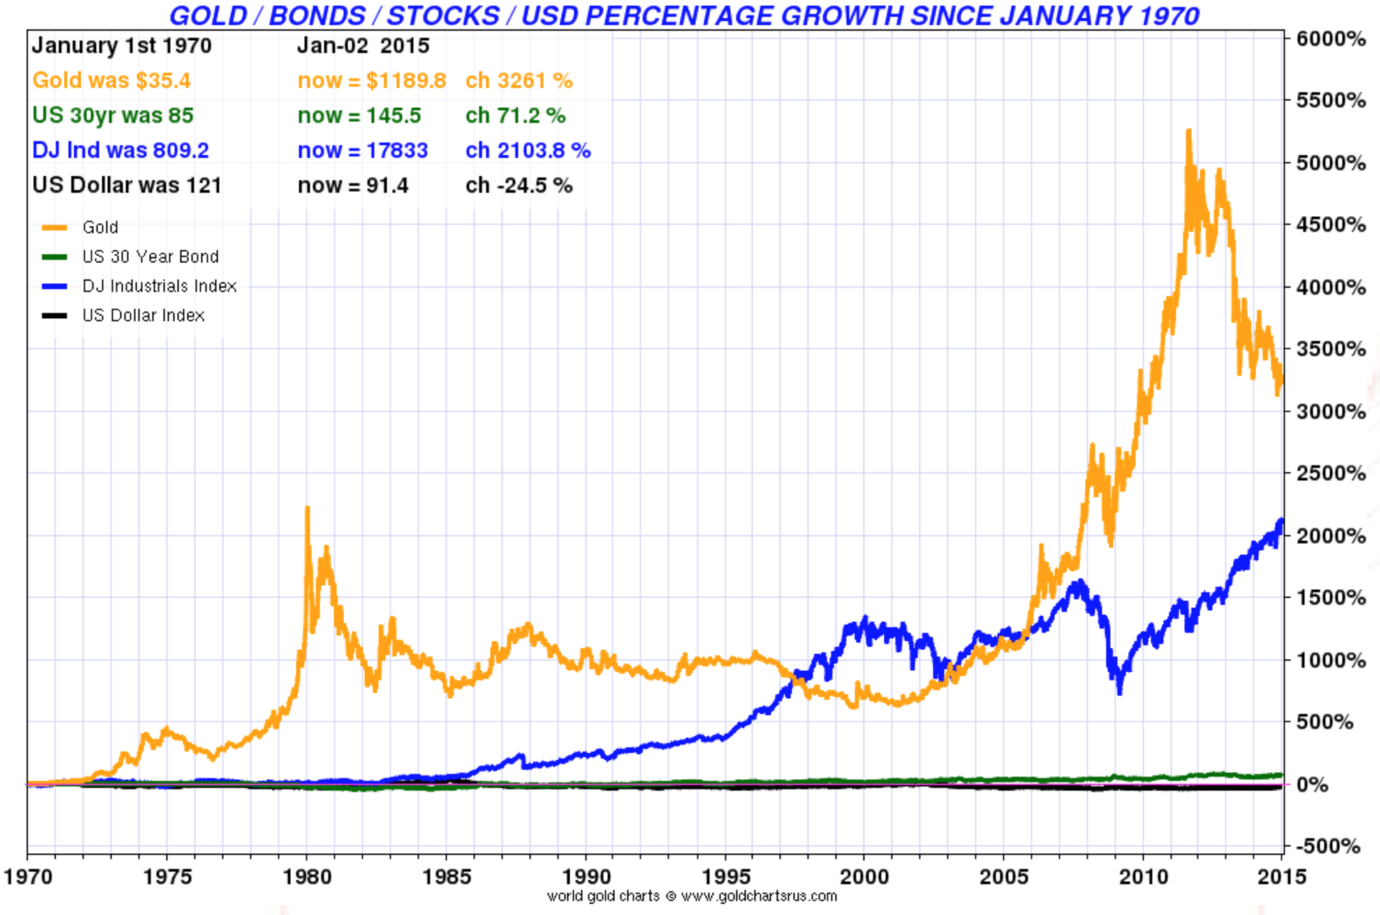
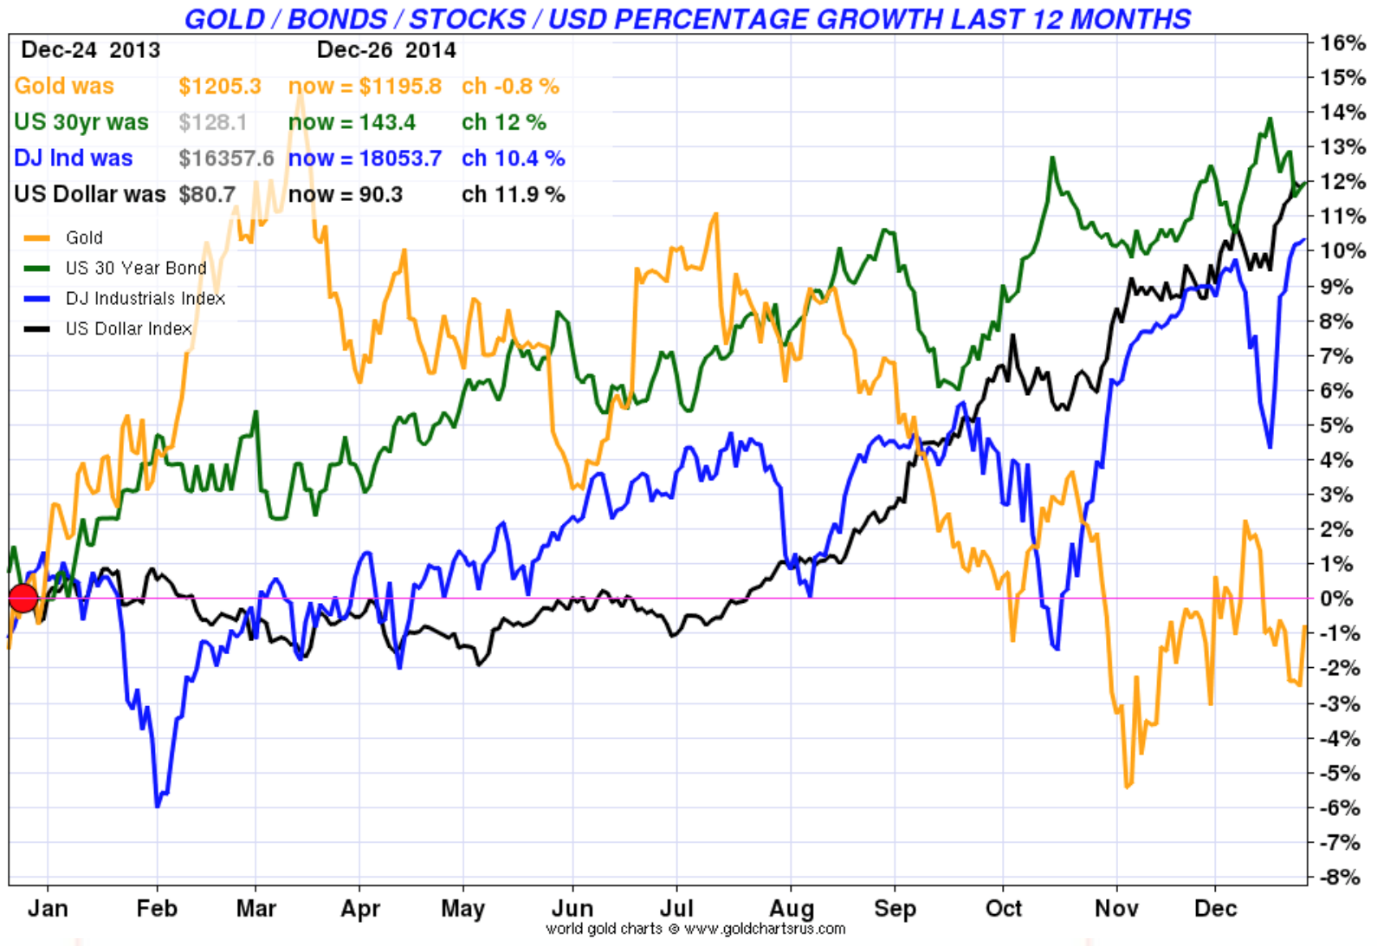
If we look now at gold and silver as an investment and compare them with stocks, bonds and foreign exchange, we can observe, in the next graph, that since the collapse of the gold exchange system, gold was up, approximately 3,261%, silver 740.1%, stocks up 2,103.8% and bonds 71.2%. The US dollar was down 24.5% against a basket of major currencies.
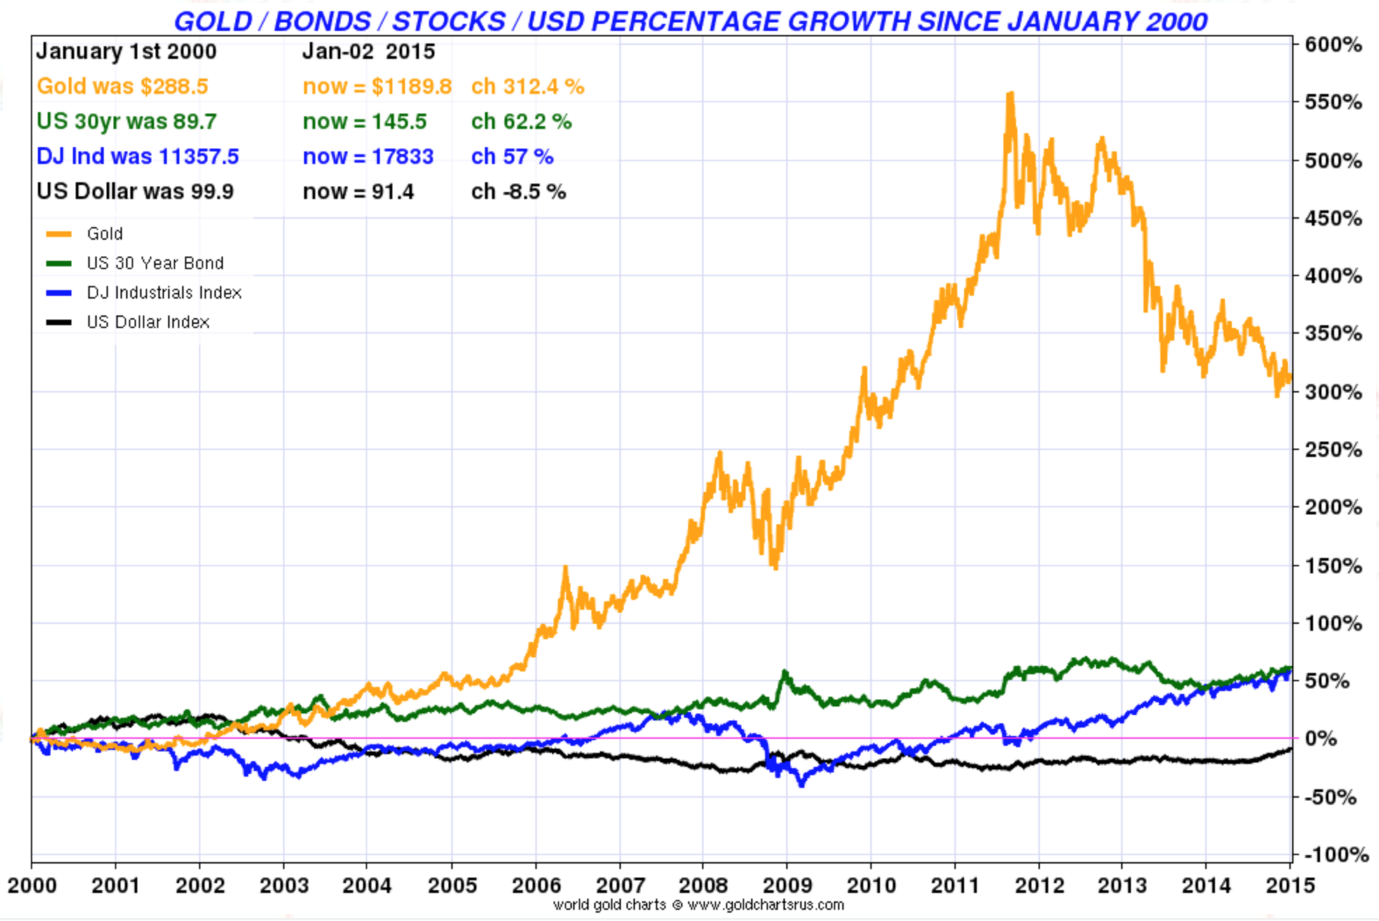
Since 2000, gold is still up in front with a percentage growth of 312.4%, with silver approximately 200%, bonds 62.2% and stocks 57%, while the US dollar lost 8.5%.
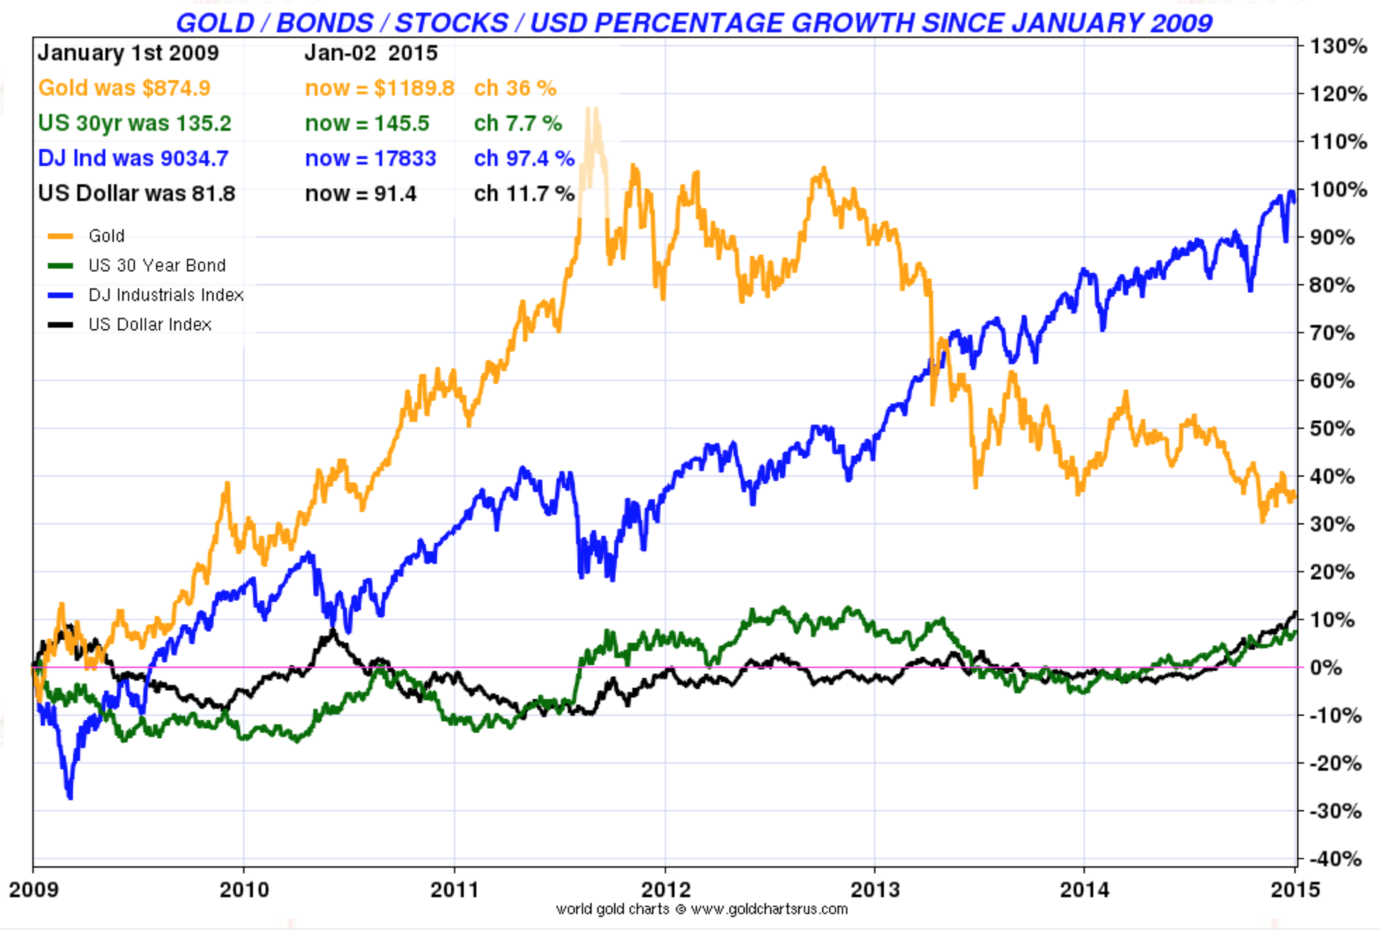
Since the financial crisis of 2008 and the exceptional government intervention and manipulation of the markets, gold, after increasing close to 120% and silver 360%, ended the year up 36% and silver 45.6% vs stocks that were up 97.4% and bonds 7.7%. The US dollar increased by 11.7%.
In 2014, gold was almost flat, but slightly negative, at 0.8% and silver was down approximately 19.4%, while stocks were up 10.4%, bonds up 12% and the US dollar up 11.9%.
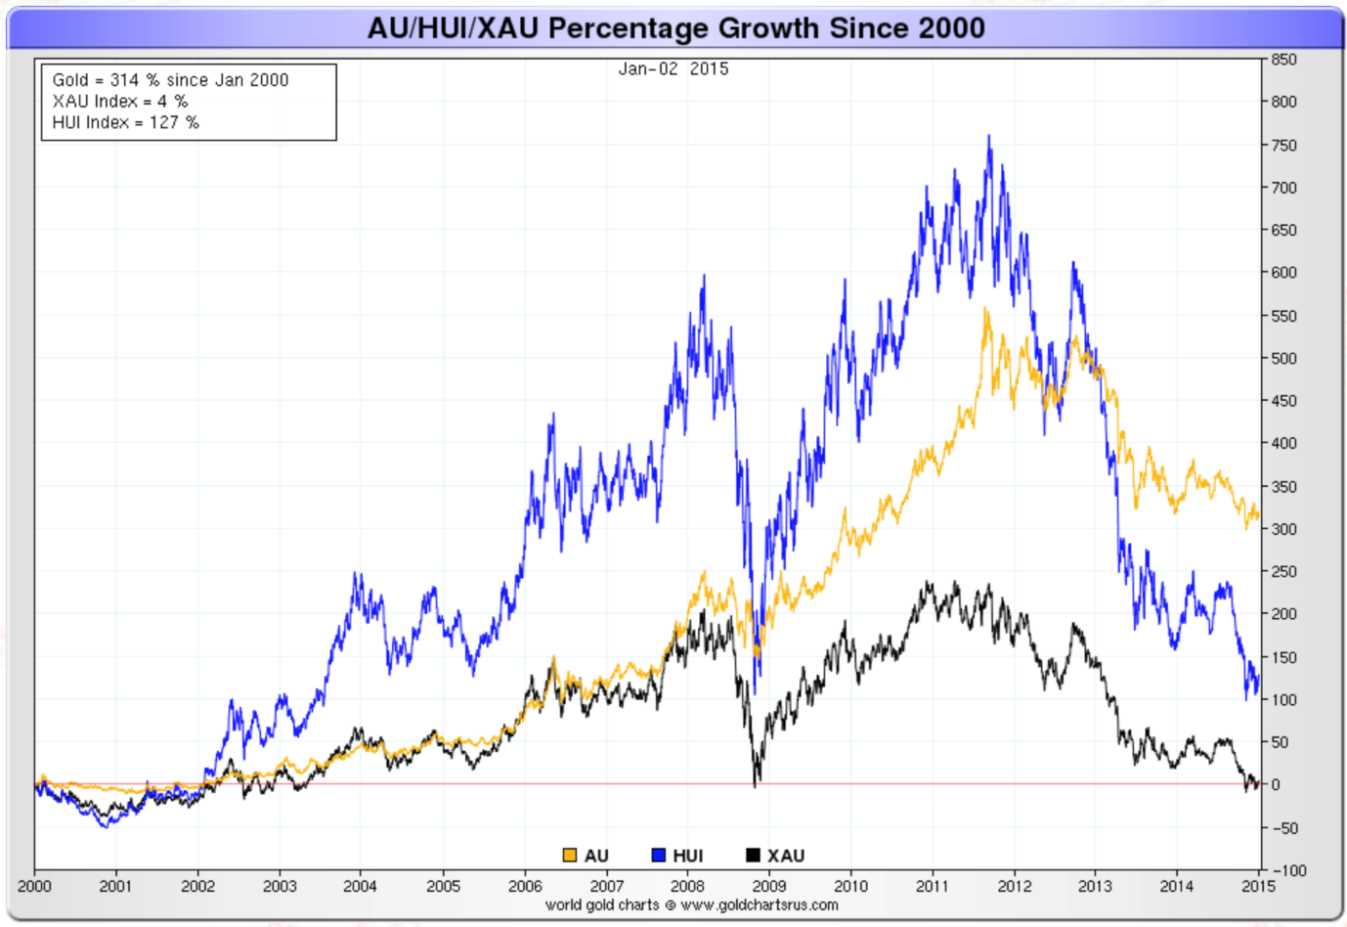
Gold stocks have not performed as well as gold and silver in any of those periods I chose. However, in the gold and silver bull markets, they outperformed. Since the end of the gold exchange standard in 1970, the BGMI gold stocks index has zero percent growth, when adjusted for inflation. Since 2000, the two major gold stocks indexes (XAU and HUI) were up 4% and 127%, respectively, in nominal terms.
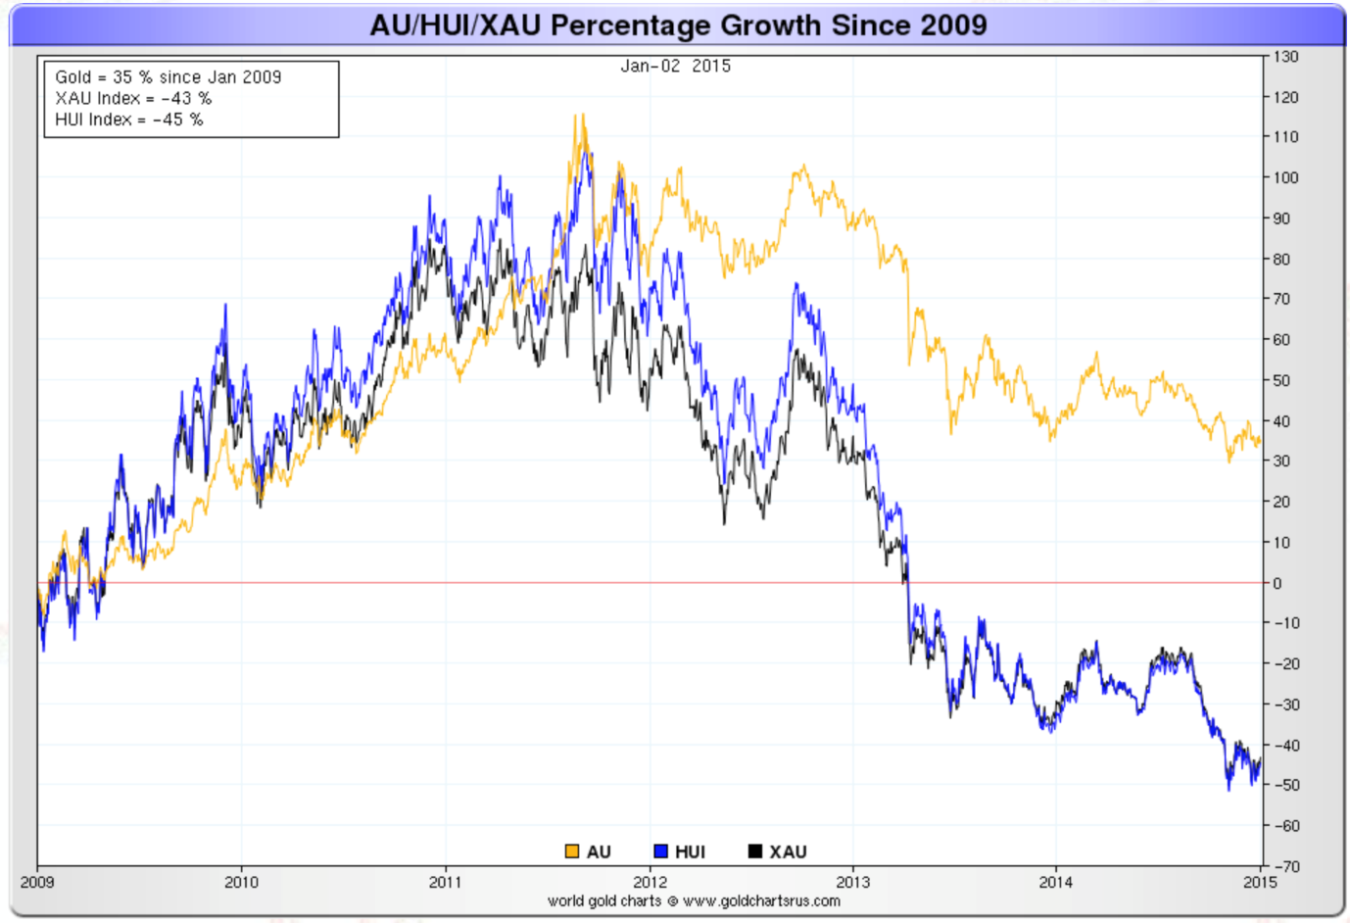
Since the financial crisis of 2008, they were down 43% and 45%, respectively.
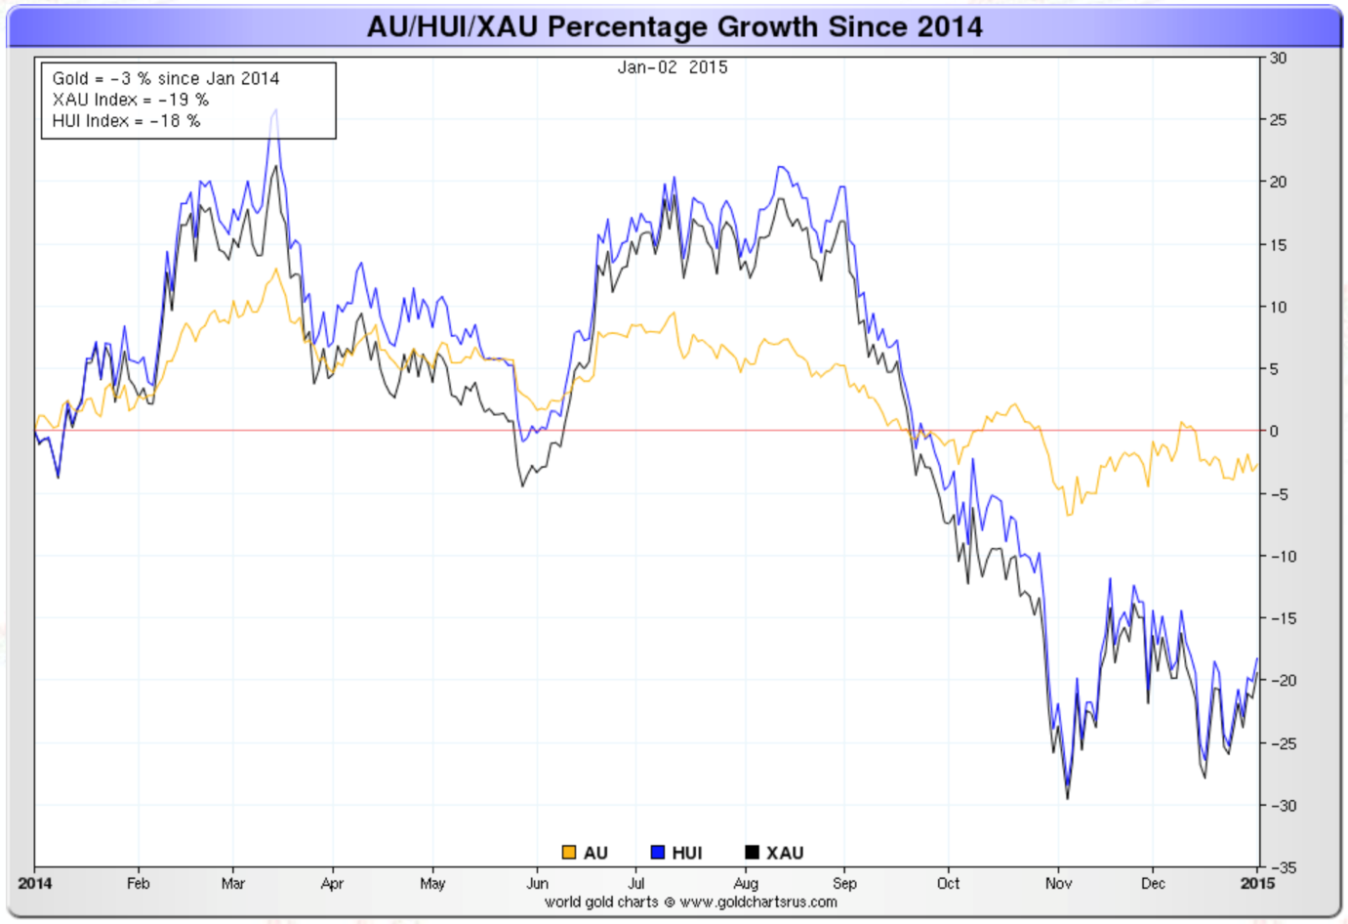
In addition, for the year 2014, they were down 19% and 18%, respectively.
2014 has, in my opinion, been a year dominated by government interventions and market manipulations of every kind to save the world economy from excessive debt… by adding more debt. Most active have been the central banks and especially the US Fed. They have only managed to avoid a total collapse of the economy and only postponed the inevitable collapse of the international monetary system.
We have seen a new Cold War starting in 2014, we have been in currency and gold wars since 2009 and, at the end of 2014, oil and commodities wars have started. We must not forget the geopolitical crises bursting everywhere around the world, from Ukraine to the Middle East, and social unrest in Europe and the United States. None of them exploded in a major way last year, but it doesn’t bode well for 2015.
Reproduction, in whole or in part, is authorized as long as it includes all the text hyperlinks and a link back to the original source.
The information contained in this article is for information purposes only and does not constitute investment advice or a recommendation to buy or sell.
