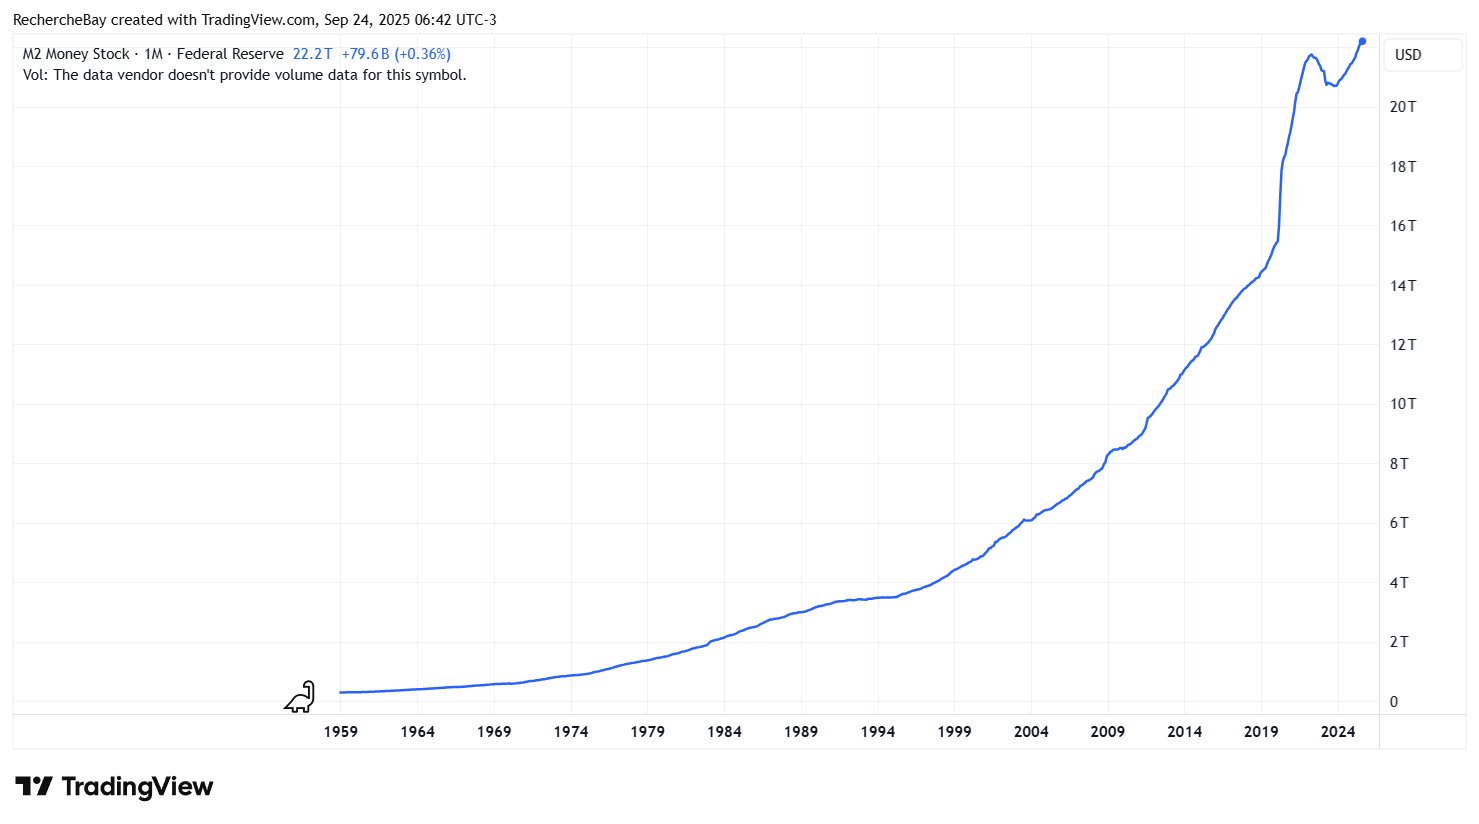
For two years, observers have been puzzled by a paradox: while the Fed is reducing the size of its balance sheet through quantitative tightening (QT), the M2 money supply is on the rise. In theory, the contraction of the Fed's holdings of Treasury bonds and mortgage-backed securities should reduce the money supply. But this is not what is happening. The key to this mystery lies in the growing role of money market funds (MMFs).
What is M2?
To understand this, remember that M2 is a broad measure of money in circulation. It includes “base” money (banknotes, coins, demand deposits) as well as savings deposits and certain highly liquid investments. It is therefore an indicator that more closely reflects what households and businesses consider to be “available cash.”
Since 2024, the M2 money supply has once again been growing rapidly and steadily.
The US Treasury, the leading source of liquidity
The increase in M2 is not due to the Fed injecting money as it did during QE, but rather to massive spending by the US Treasury.
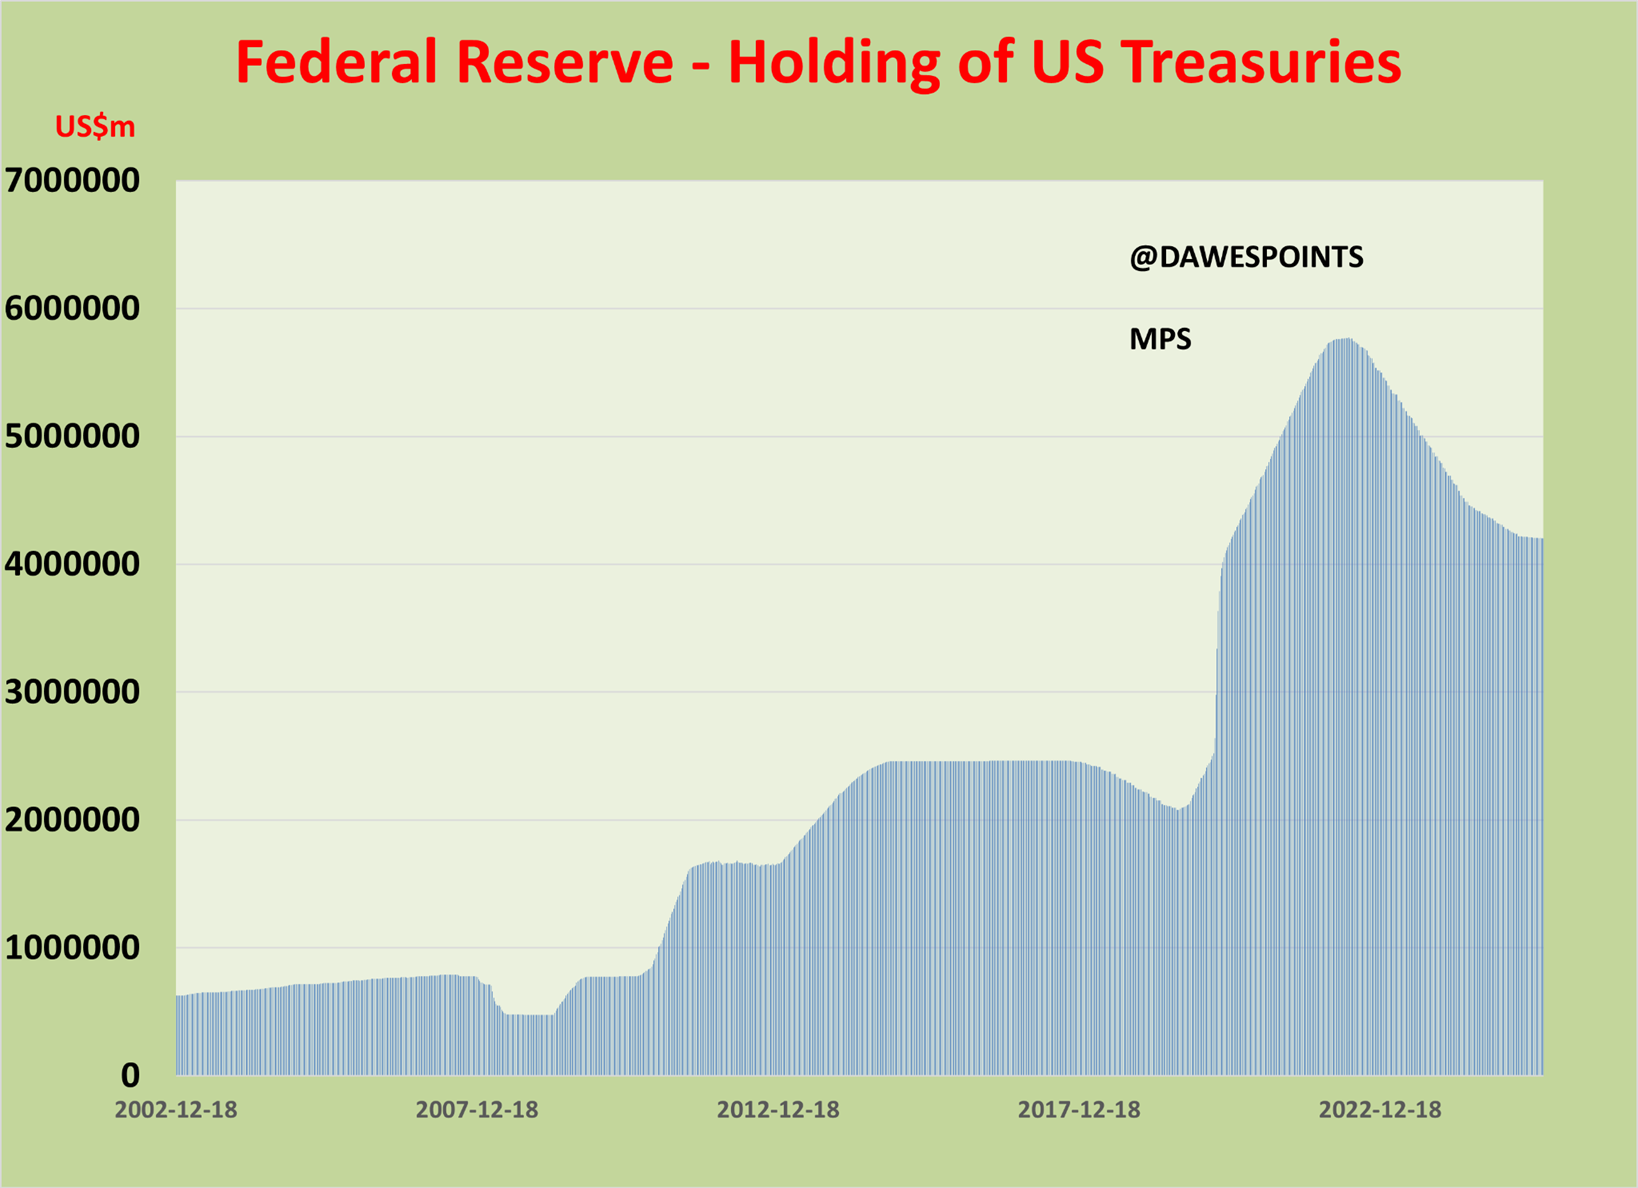
On the contrary, since 2022, the Fed has been engaged in a program to reduce its balance sheet by gradually selling off its US Treasury bonds:
The US Treasury not only offset the Fed's balance sheet reduction, it actually contributed to a net increase in M2. In other words, while the Fed was trying to put out the fire, the Treasury was fanning the flames.
To finance its record deficits, the US Treasury issues hundreds of billions of dollars in short-term Treasury bills (T-Bills) every month. This strategy amounts to concentrating the weight of public debt on very short maturities, a form of “fiscal QE”: instead of the Fed injecting liquidity by purchasing bonds as in traditional quantitative easing, it is now the Treasury that is flooding the market with T-Bills, which are immediately absorbed by money market funds. These massive issuances feed bank deposits and thus the M2 money supply. In other words, financing the public deficit through short-term issuances acts as a disguised liquidity boost, counteracting the Fed's monetary tightening efforts.
This phenomenon is accelerating at an impressive rate. The U.S. federal government now issues $1 trillion in new debt in less than 80 days. Just a year ago, it took about 100 days to reach this threshold. In other words, the pace of debt accumulation is constantly intensifying: the government is now adding the equivalent of the GDP of countries such as the Netherlands or South Korea to its public debt... in just a few months.
This dynamic reflects a twofold reality:
- Chronic budget deficits that are getting worse, fueled by rising public spending (social programs, defense, debt servicing) while tax revenues are stagnating.
- Growing dependence on financial markets, which absorb these massive issuances through Treasury auctions. Foreign investors, pension funds, and especially money market funds are becoming the main financiers of this borrowing frenzy.
Even more worrying is that this acceleration is accompanied by increasing use of T-Bills, very short-term Treasury bills. In other words, the more debt increases, the more it is financed by short maturities that will have to be constantly renewed. This exposes the United States to an increased risk of permanent rollover: the Treasury must constantly refinance mountains of debt, often at higher rates, which fuels the debt spiral.
In short, the United States is not only borrowing more, it is borrowing faster and, above all, increasingly in the short term. While the Fed is reducing its balance sheet and seeking to withdraw liquidity from the market, the Treasury is pumping liquidity into the economy by accelerating the pace of its short-term debt issuance.
When these short-term debt securities are purchased, the dollars from these issuances immediately end up in the accounts of the beneficiaries of public spending: households, businesses, and government contractors. In short, the Treasury is flooding the economy with liquidity, which is inflating bank deposits and therefore M2.
Why are Money Market Funds attracting all this cash?
Once these dollars arrive in bank accounts, many investors and companies seek to invest them in a safe and profitable manner. MMFs have become particularly attractive since the Fed raised interest rates:
- They offer returns of over 5% with no market risk.
- They invest mainly in short-term T-Bills or via the Fed's reverse repo facility.
- They allow investors to maintain immediate liquidity while taking advantage of high rates.
As a result, MMF assets now exceed $7 trillion, an all-time high.
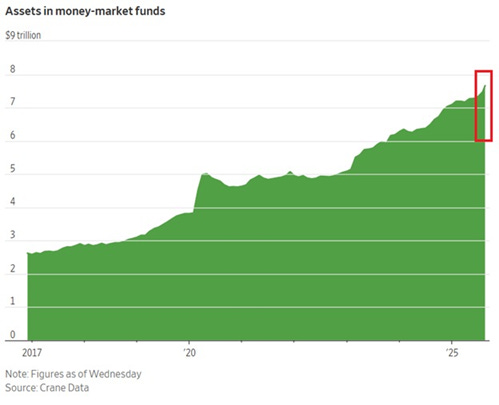
A veritable flood of cash is accumulating on the fringes of traditional financial markets.
From tide to flood: when cash returns to the stock markets
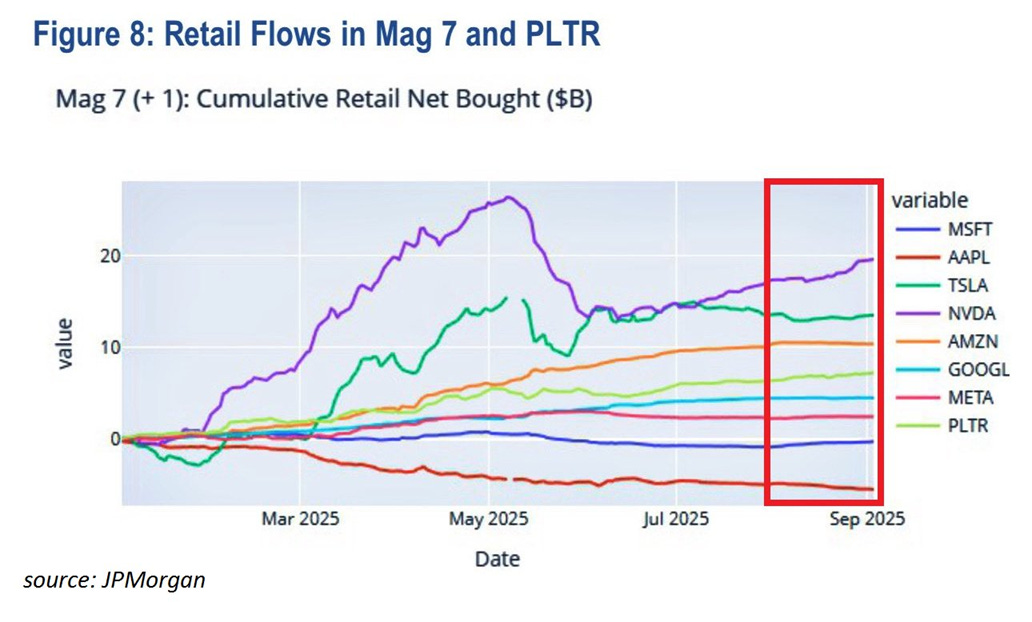
What makes this phenomenon explosive is that this liquidity remains available. As soon as a stock market correction occurs, some of the cash parked in MMFs is redeployed to the stock markets, particularly to large technology stocks. We have seen this in recent months: flows from retail investors to Nvidia, Tesla, Microsoft and the like pick up again after each downturn. MMFs therefore act as a buffer reservoir that fuels the “buy the dip” dynamic.
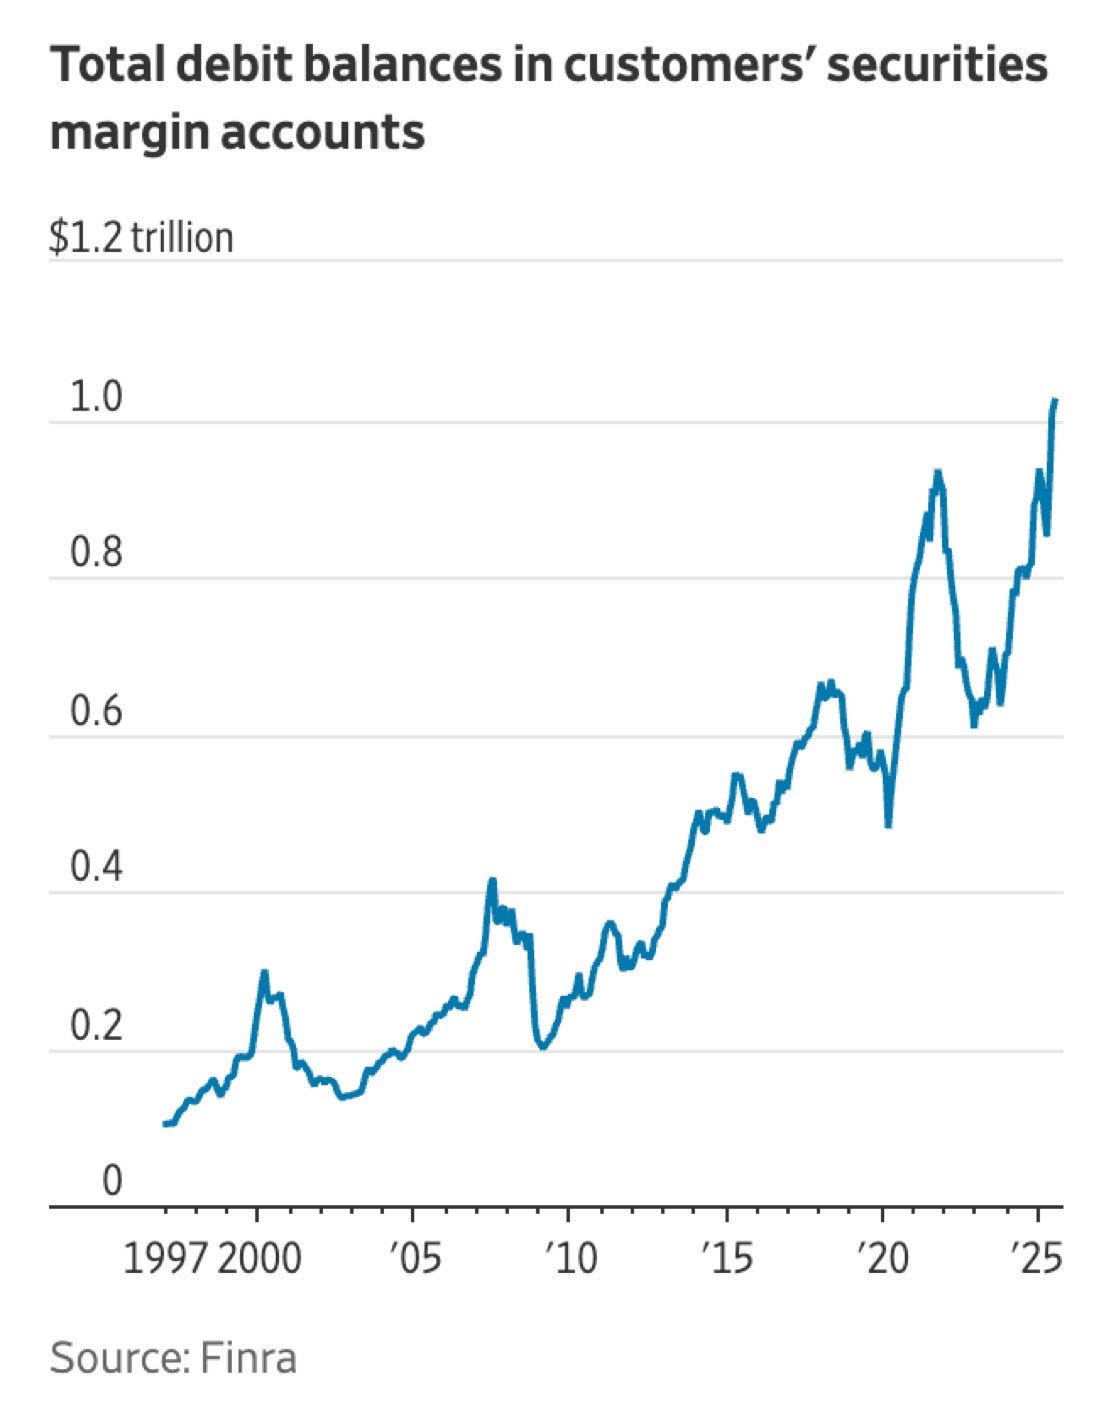
And these investments are being made with increasing use of leverage.
Margin debt in the United States has just reached $1.02 trillion, a new all-time high. In other words, investors have never borrowed so much to finance their stock market positions.
Margin debt is the amount borrowed by individuals and professionals from their brokers to buy stocks. It acts as a powerful bullish lever: when markets rise, gains are amplified. But the opposite effect occurs during corrections: losses widen and force investors to sell urgently, triggering margin calls.
Historically, every peak in margin debt has coincided with periods of stock market overheating. We saw this before the bursting of the internet bubble in 2000, on the eve of the 2008 financial crisis, and again before the crash of 2020. The FINRA chart clearly shows that these spikes in investor debt often precede periods of high volatility:
Since its low point in April, the Nasdaq has jumped more than 50%, driven almost exclusively by large technology stocks. US tech stocks have never been so expensive: the price-to-sales ratio for the S&P 500 technology sector has reached 8.8, an all-time high. Even at the height of the internet bubble in 2000, this indicator did not reach such a level. It is simply staggering.
The S&P 500 has just completed 107 consecutive sessions without a single-day decline of more than 2%. This is the longest such streak in over a year.
This figure illustrates the climate of extraordinary apparent stability that currently prevails on the US market.
Another fact has caught the attention of observers: since August, not a single session has started in the red for Nasdaq futures contracts. In other words, investors are consistently finding reasons to buy back into the market before the opening bell.
This phenomenon coincides with the US Treasury's auction schedule. Each time there is a massive issuance of Treasury bills, international inflows pour into US debt. But once the T-Bills are acquired, some of the liquidity is immediately recycled into the “Magnificent 7” (Nvidia, Apple, Microsoft, Tesla, Meta, Alphabet, Amazon). These ultra-liquid stocks, which dominate the indices, have become the natural destination for foreign capital.
In practice, this creates a mechanical effect:
- The Treasury raises hundreds of billions to finance its deficits.
- Foreign buyers (central banks, sovereign wealth funds, institutional investors) obtain dollars.
- Part of this cash is reinvested almost immediately in large US tech companies, considered the safest “equity equivalents” and closest to Treasuries in terms of liquidity.
The result is spectacular: the market seems to suck up global liquidity at every auction and concentrate it in a small core of stocks. It is this mechanism that explains both the dizzying rise of the Nasdaq and the absence of visible corrections since the summer.
Under these conditions, the market is reaching insane levels. We are actually sitting on the biggest bubble in history.
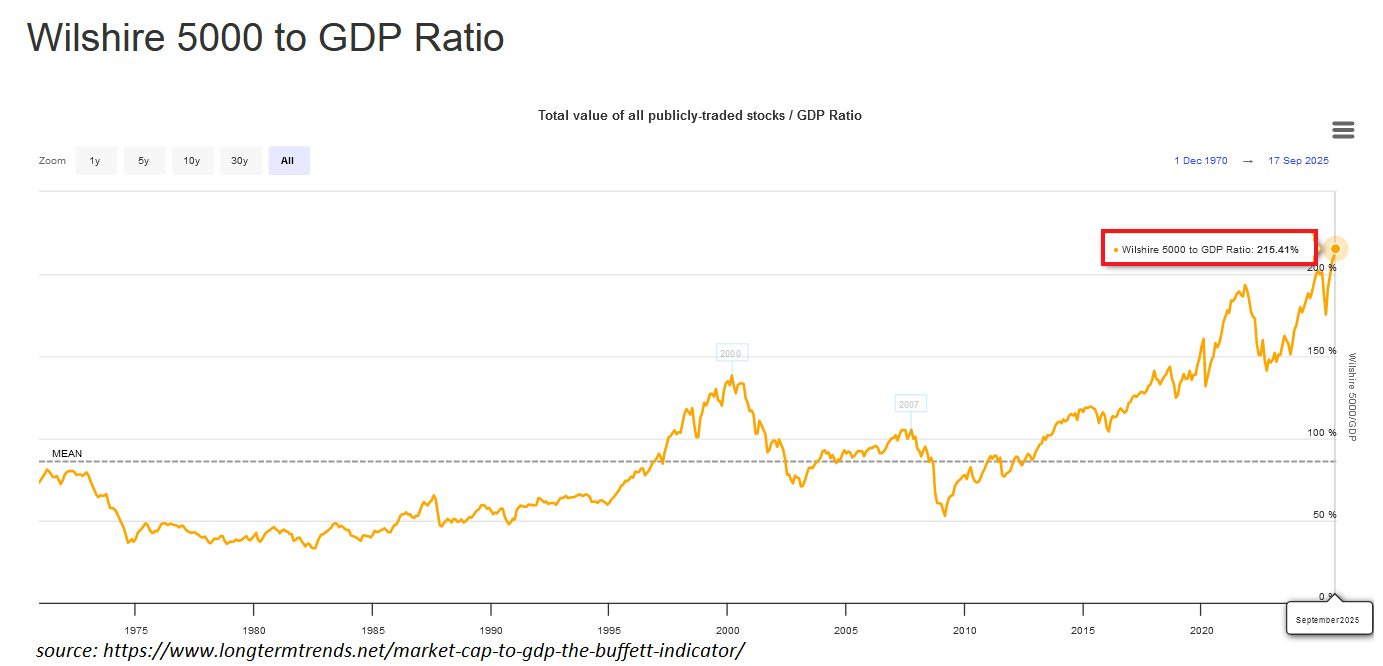
Never before has the US stock market outperformed economic growth to such an extent: Warren Buffett's indicator has just reached a record high of 215%. This means that the market capitalization of US stocks is now more than twice the size of the world's largest economy.
The hidden risk
This mechanism explains why equity markets are holding up so well despite the Fed's QT. But it carries a risk: if T-Bill yields remain high for a long time, cash may remain stuck in MMFs instead of returning to the stock market. And if confidence is lost, these flows could reverse abruptly, depriving the markets of their fuel.
When “buy the dip” runs out of steam... precious metals take over
Until now, the “buy the dip” mechanism has seemed unstoppable. With each downturn, billions of dollars parked in money market funds find their way into big tech stocks, prolonging the bubble and masking the fragility of the system. But this collective reflex is based on an implicit assumption: that the United States will remain the global financial center of gravity and that its tech champions will remain safe havens for liquidity.
If this confidence were to be shaken – by a budget crisis, a shock to US debt, or disillusionment with the “Magnificent 7” – the cycle could reverse. Instead of being redeployed into equities, cash could freeze in money market funds or seek other safe havens. And financial history shows that when confidence in paper assets erodes, investors turn en masse to real assets: gold and, increasingly, silver.
These metals, which carry no counterparty risk and are buoyed by growing industrial demand (particularly for silver), appear to be the natural alternatives. They offer protection against currency depreciation and the fragility of a system that, for the past two years, has been fueled by artificially sustained “buy the dip” trading.
In other words, when the flow of money into equities stops, the tide will turn towards gold and silver.
Reproduction, in whole or in part, is authorized as long as it includes all the text hyperlinks and a link back to the original source.
The information contained in this article is for information purposes only and does not constitute investment advice or a recommendation to buy or sell.


