After the low point in early September, silver started a first wave of rising, before logically bouncing back to the low support line.
On December 1st, as the stock market collapsed, silver started its second leg up until it hit the resistance twice, if not three times.
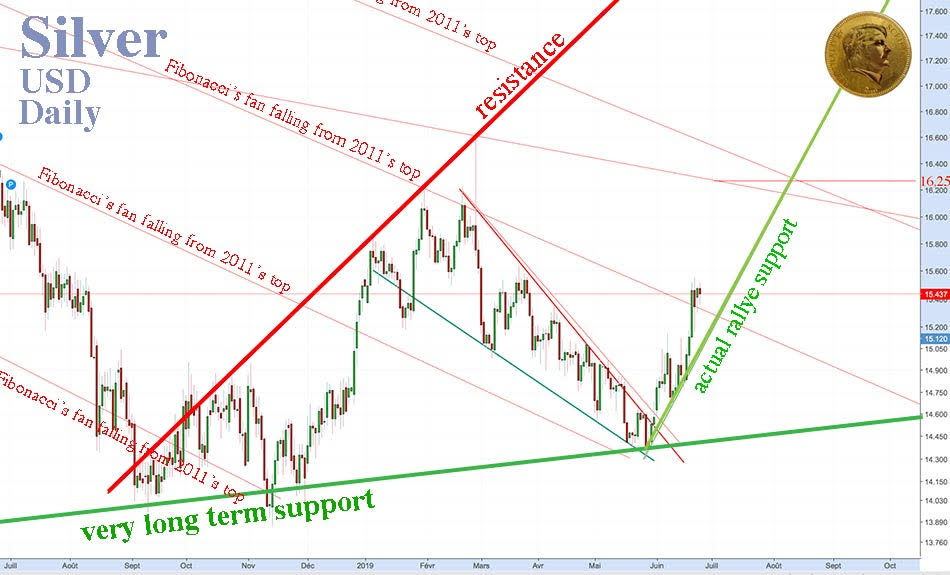
On May 28, the consolidation of silver in the form of a falling wedge ended with the pull-back on the Fibonacci fan, which had been passed on December 27, and a new support on the very long term support, already touched in September and November 2018. These successive pull-back on the long-term support ended the long consolidation of silver prices since the 2010-2011 JPM short-squeeze.
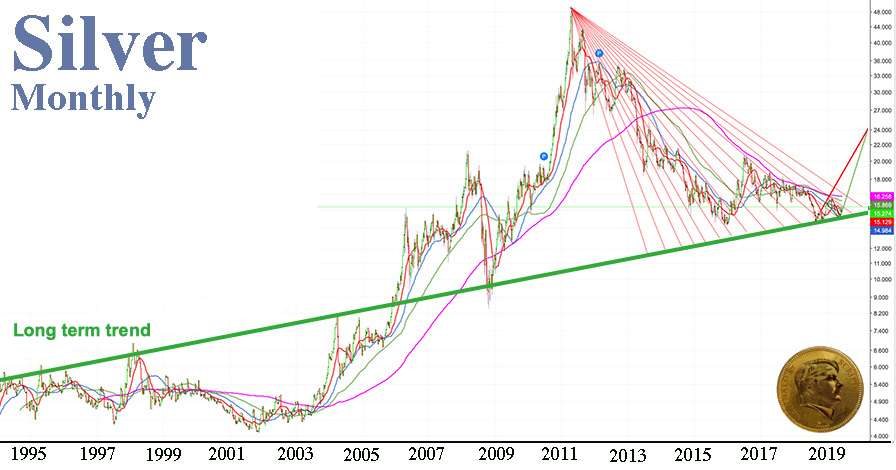
Having found a solid base, silver will be able to develop the third leg of its bullish rally.
The rising oblique resistance, which capped the hike of prices during the first leg of the rise and blocked the bullish peaks three times from January to March, will be tested again before the end of the year, but it is very bullish. If it is tested in December 2019, it would be around $21, even $22 in January.
If we compare the slope of this resistance with that of 2016, the 2016 bull rally was more violently bullish. But the slope is strictly the same as the increase from February 2009 to January 2011. I hope it lasts.
During this second leg of the rise, silver passed one of these Fibonacci fans, which pace the space from the top. These fans are of crucial importance in the trading algorithms of the bankers who are in charge to "manage" the movements of precious metals. Each time a fan has been passed, and theoretically it has changed from resistance to become a support, the prices will come back on it-what is called a pull-back-to certify that this fan has become support. This small game allows the masters of the game to delay the rise of precious metals and gold in particular, since it still serves as a monetary standard.... "Today more than yesterday but much less than tomorrow".
The bullish surge following the June 19’s FOMC meeting broke the next Fibonacci fan and fenced it off. The prices came back down to make a pull-back on the 100 day market moving average, which had been broken in this small wave of increase, but prices should go back Northwards. I still consider that silver should be at $21 around January 2020 and that it should be at $34 at the end of 2020.
There are various factors that drive up precious metals.
On the one hand, Trump is totally destabilizing international trade, generating an extremely deep crisis. In the long term, this will be beneficial for America, which will have to recreate the industrial fabric that has been destroyed by three decades of relocation. In the short term, it will plunge the United States into a deep recession.
Trump, by attacking all over the place: Russia, China, India and Europe, is facilitating de-dollarization.
On the other hand, European banks have not taken into account the lessons of the 2008-2009 systemic crash. Unlike American banks, which had to reduce their leverage with the Dodd-Frank Act, European banks did not comply with the prudential rule of a maximum leverage of 10 and still display extremely dangerous leverage. Lehman had been put into bankruptcy with a leverage of 32.
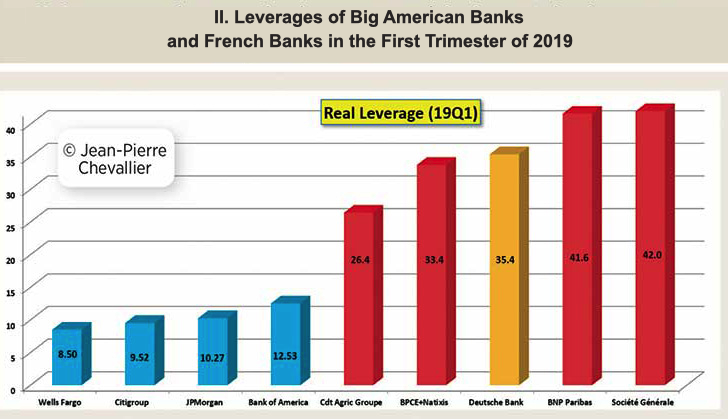
The result is that the Big Capital fled to the the safest banks. The stock market prices of European banks are frightening.
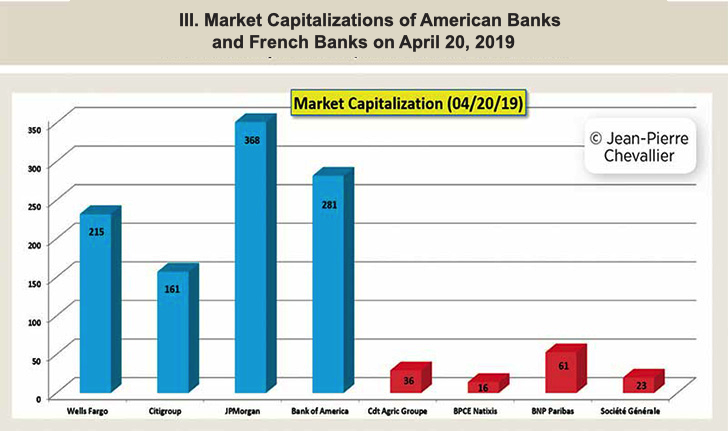
Analysts always talk about Deutsche Bank, but the Société Générale graph is worse. The share was worth €50 at the end of 2018, it is now worth only €21.
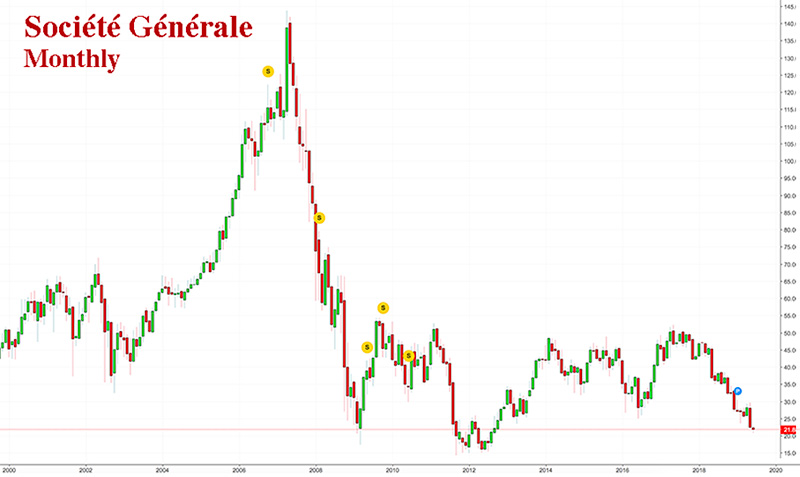
In December 2018, in order to avoid a systemic banking crash, the BIS imposed a 180° reversal of the Federal Reserve's monetary policy, and authorised the ECB to flood banks with its TLTROs, practically interest-free loans. The Bank of Japan (BOJ) announced that it would resume the systematic purchase of Japanese government bonds and the Chinese Central Bank (BPOC) flooded the market with liquidity during the first quarter.
Chinese banks are also in a bad position. The Trade War, which is hurting over-indebted Chinese companies, is making it more difficult for them to meet their loan deadlines.
As a result, many banks in China are on the brink of bankruptcy. SHIBOR, the equivalent of LIBOR for China, shows that the interbank market is under stress.
Since December, to save the system, all central banks have been creating currency in one way or another.
In this globalized world, the fall of a bank can lead to the fall of the entire system. Big Capital takes refuge en masse in government bonds, preferably in the United States, but also in Germany, Switzerland and even France. The safest countries borrow nowadays at negative rates. This is not healthy. It's not tenable.
Even if the media do not report it, we are in the middle of a serious and deep crisis, which is pushing precious metals up.
By December 31, 2021, all banks will have to comply with Basel III standards. That is to say, to have a maximum leverage of 10. For this, banks will have to increase their equity capital. Imagine that these banks invest part of their equity in physical gold, which is actually held. Since March 2018, this gold has been classified as "Tier 1", i.e. it is recorded at 100% of its real value. If the gold price in euros increase sufficiently by December 31, 2021, it would enable European banks to meet Basel III standards.
Deep down, I am convinced that this is what is going to happen. In pushing this logic to the end, I consider that the upward leg of precious metals will be very gradual in 2019 and 2020, with an extremely powerful acceleration from October or November 2021. You will not be able to find it by searching in the graphs, but only by asking yourself the why of NYMEX rule 589 (which I already explained in a previous article). If silver will be allowed to rise by $12 a day, gold will be allowed to rise by $400/day, i.e. $2,000 a week. At this pace, banks that have converted their equity into gold will quickly return to Basel III prudential standards.
The world's leading money managers are already on deck maneuvering to keep the system running, whatever happens, until the end of 2021. Draghi said he would do "whatever it takes" to save the euro zone, whatever the means. That's what he does month after month. But he is not the only one. Central banks are working in team for that.
Looking at the Dollar index graph, one might wonder if there has not been "Plazza Accord 2.0" and a central bank agreement, as in 1985 to lower the Dollar index price. At that time, the United States had the same problem with Japan as it has today with China. It was therefore urgently necessary:
- To stop the speculative bubble on the US dollar;
- To reduce the US current account deficit, which had reached 3.5% of GDP;
- To reduce Japan's trade surpluses, and stop the worrying growth of its investments, particularly in real estate, in the United States.
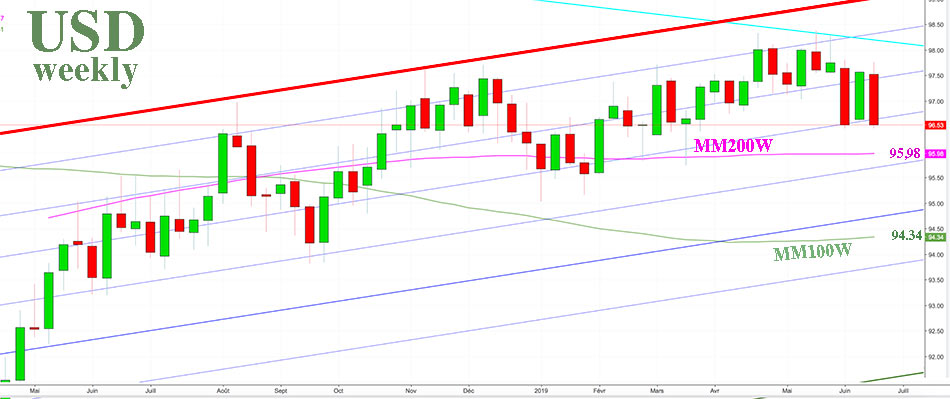
Two weeks ago the Dollar index experienced a sharp drop, which seemed orchestrated. Last week, we witnessed a logical pull-back to the supports that had been broken and this week, another very sharp drop was observed. The prices should end the week below the 40-weeks moving average, which corresponds to the 200 days. I wouldn't be surprised if the target were to bring the Dollar index back to the MA100W, which would correspond to the Dollar price a year ago.
In 1985, the speculative bubble on the Dollar was crazy, which is not the case today. Prices had been reduced from a high 165$ to a low of $87.50 in two years. Imagine how much this would support the rise in precious metals, if this "Plazza Accord 2.0" were to become a reality. We will see this in the graphs, if it happens. At the moment, the monetary authorities have not communicated on the subject.
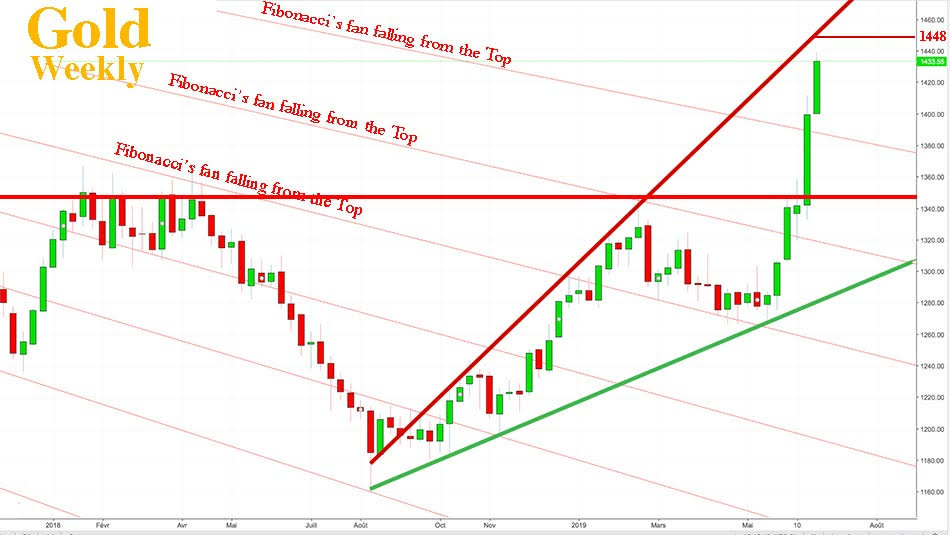
The weekly gold graph is close to the silver graph.
This week there was a great breakthrough in horizontal resistance. The prices even crossed the next Fibonacci fan, approaching the oblique resistance.
Once the thrust is over, around $1.448, as usual, there will be a pull-back on the horizontal resistance, which has blocked the prices for 2000 days.
Gold is entering a new level, but trading methods have not changed. You have to be patient.
Reproduction, in whole or in part, is authorized as long as it includes all the text hyperlinks and a link back to the original source.
The information contained in this article is for information purposes only and does not constitute investment advice or a recommendation to buy or sell.


