This week, we'll look at charts of both gold and silver vs. the United States Consumer Price Index, which essentially uses a basket of goods and services to measure the cost of living in the United States over time. Another way to look at these charts is that they are measuring the metals against inflation over time. It is not enough for the metals to increase nominally if inflation is increasing faster. To be in a bona fide bull market, the metals should be rising faster than CPI.
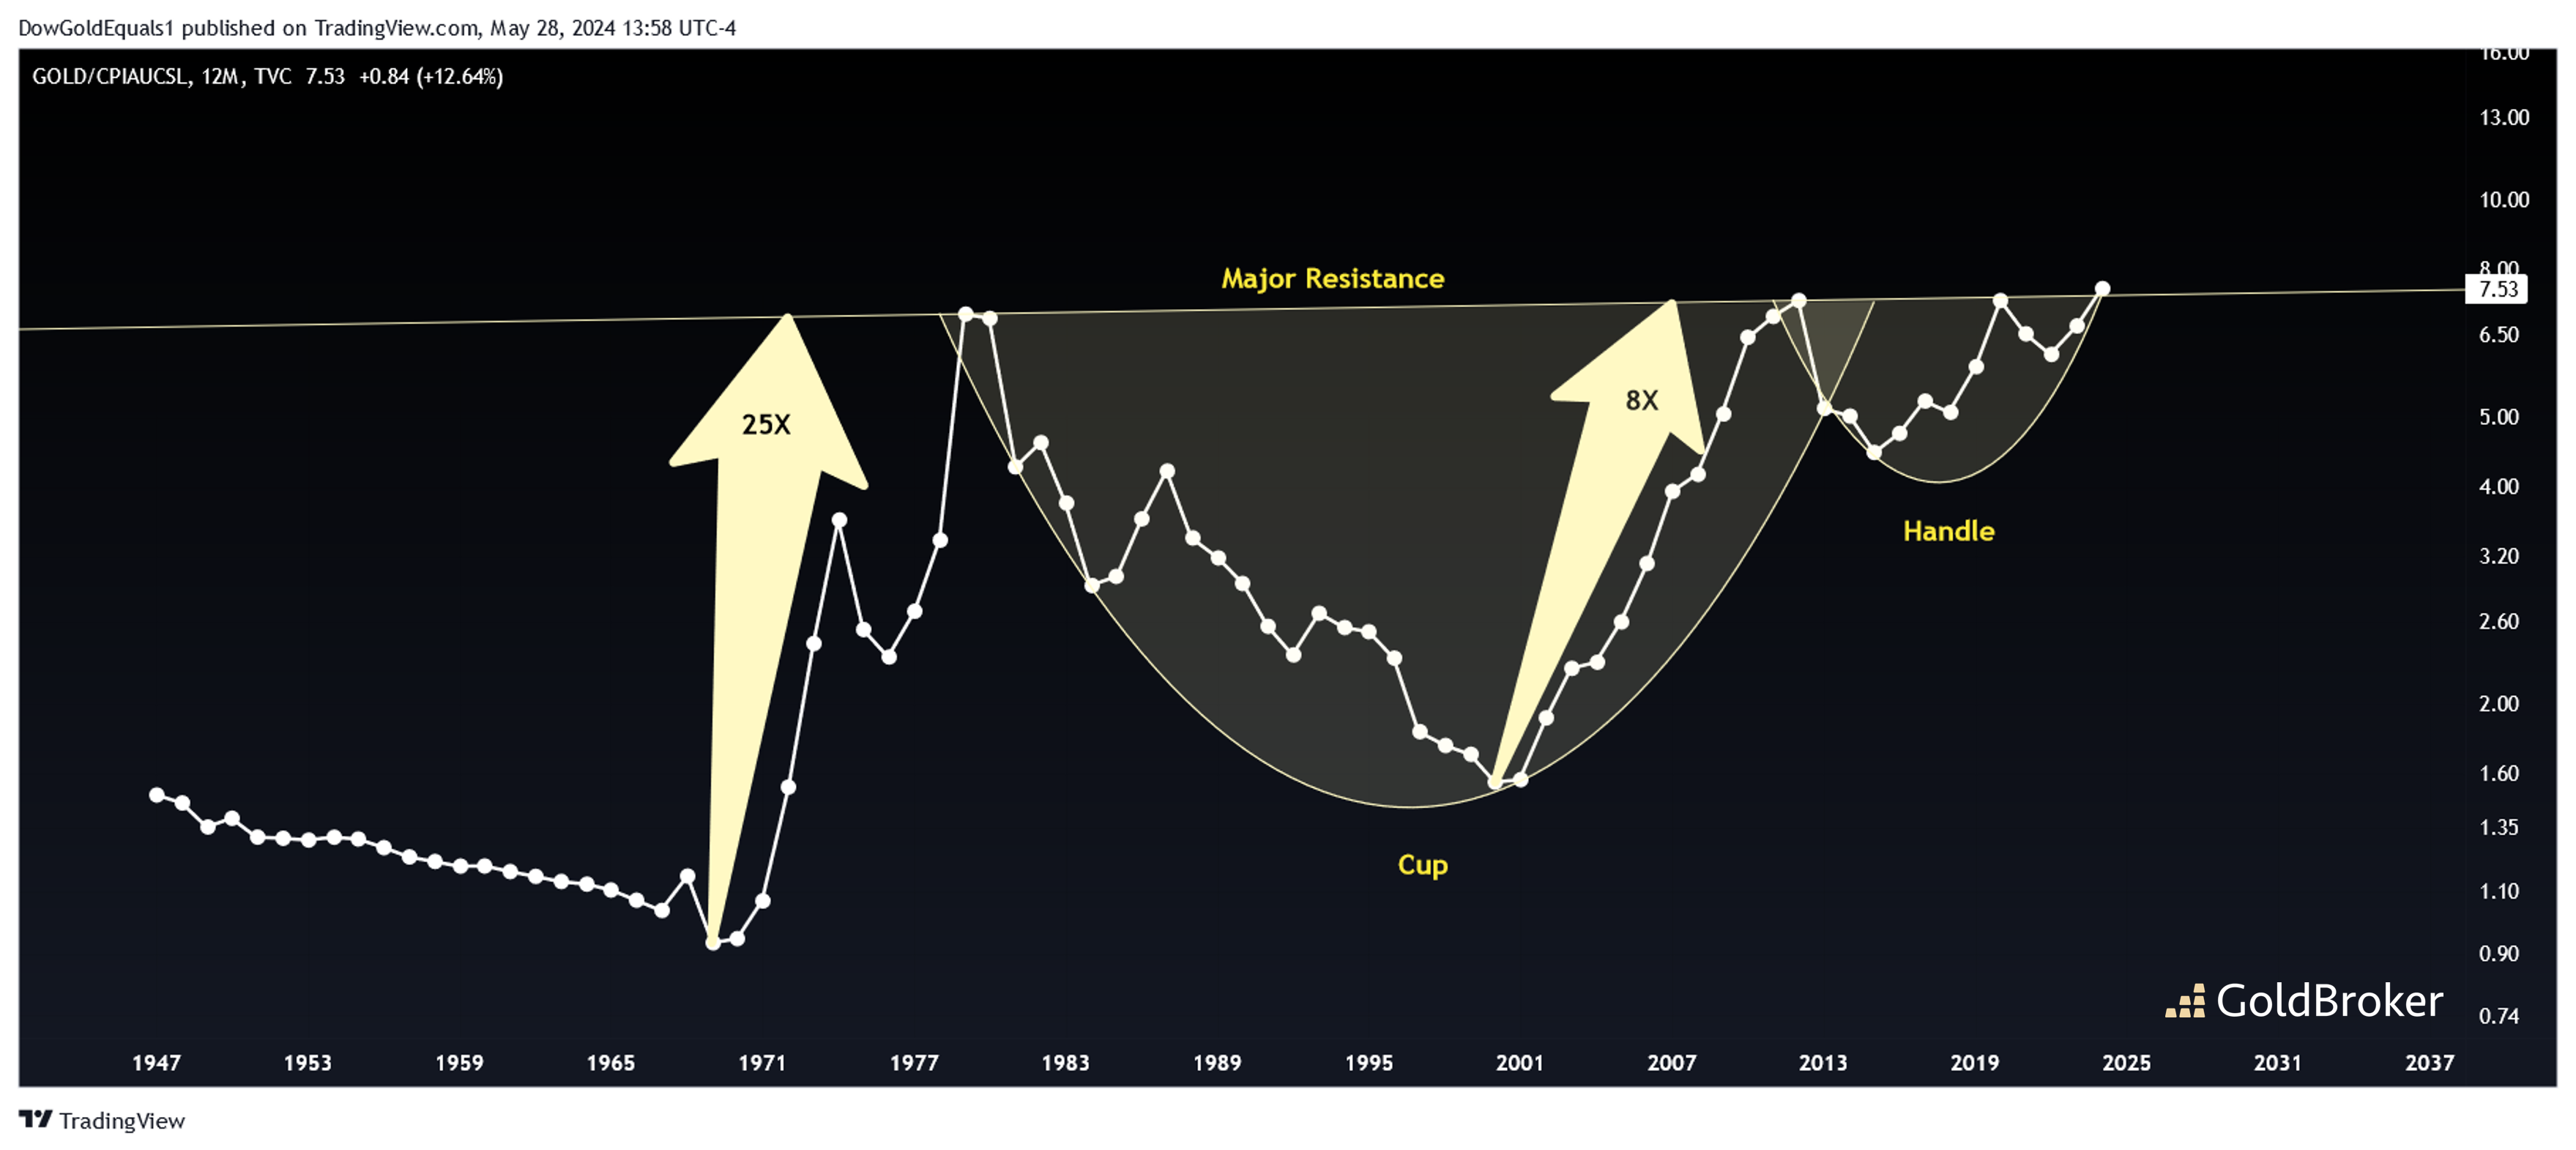
Starting with gold/CPI, we can quickly see that when the yellow metal has outperformed CPI for a sustained period, we have seen immense bull markets, as gold increased 25X in the 1970s and 8X in the 2000s. What is important about this chart, however, is that gold/CPI is starting to peak above its all time resistance. We also see a huge Cup & Handle pattern forming right below this historic resistance. Granted this is a yearly chart, and there is a lot of time left in 2024, but if gold/CPI closes above resistance, the C&H pattern is likely to activate. This would signal a huge bull market in gold that could be on par with what we saw in the 1970s.
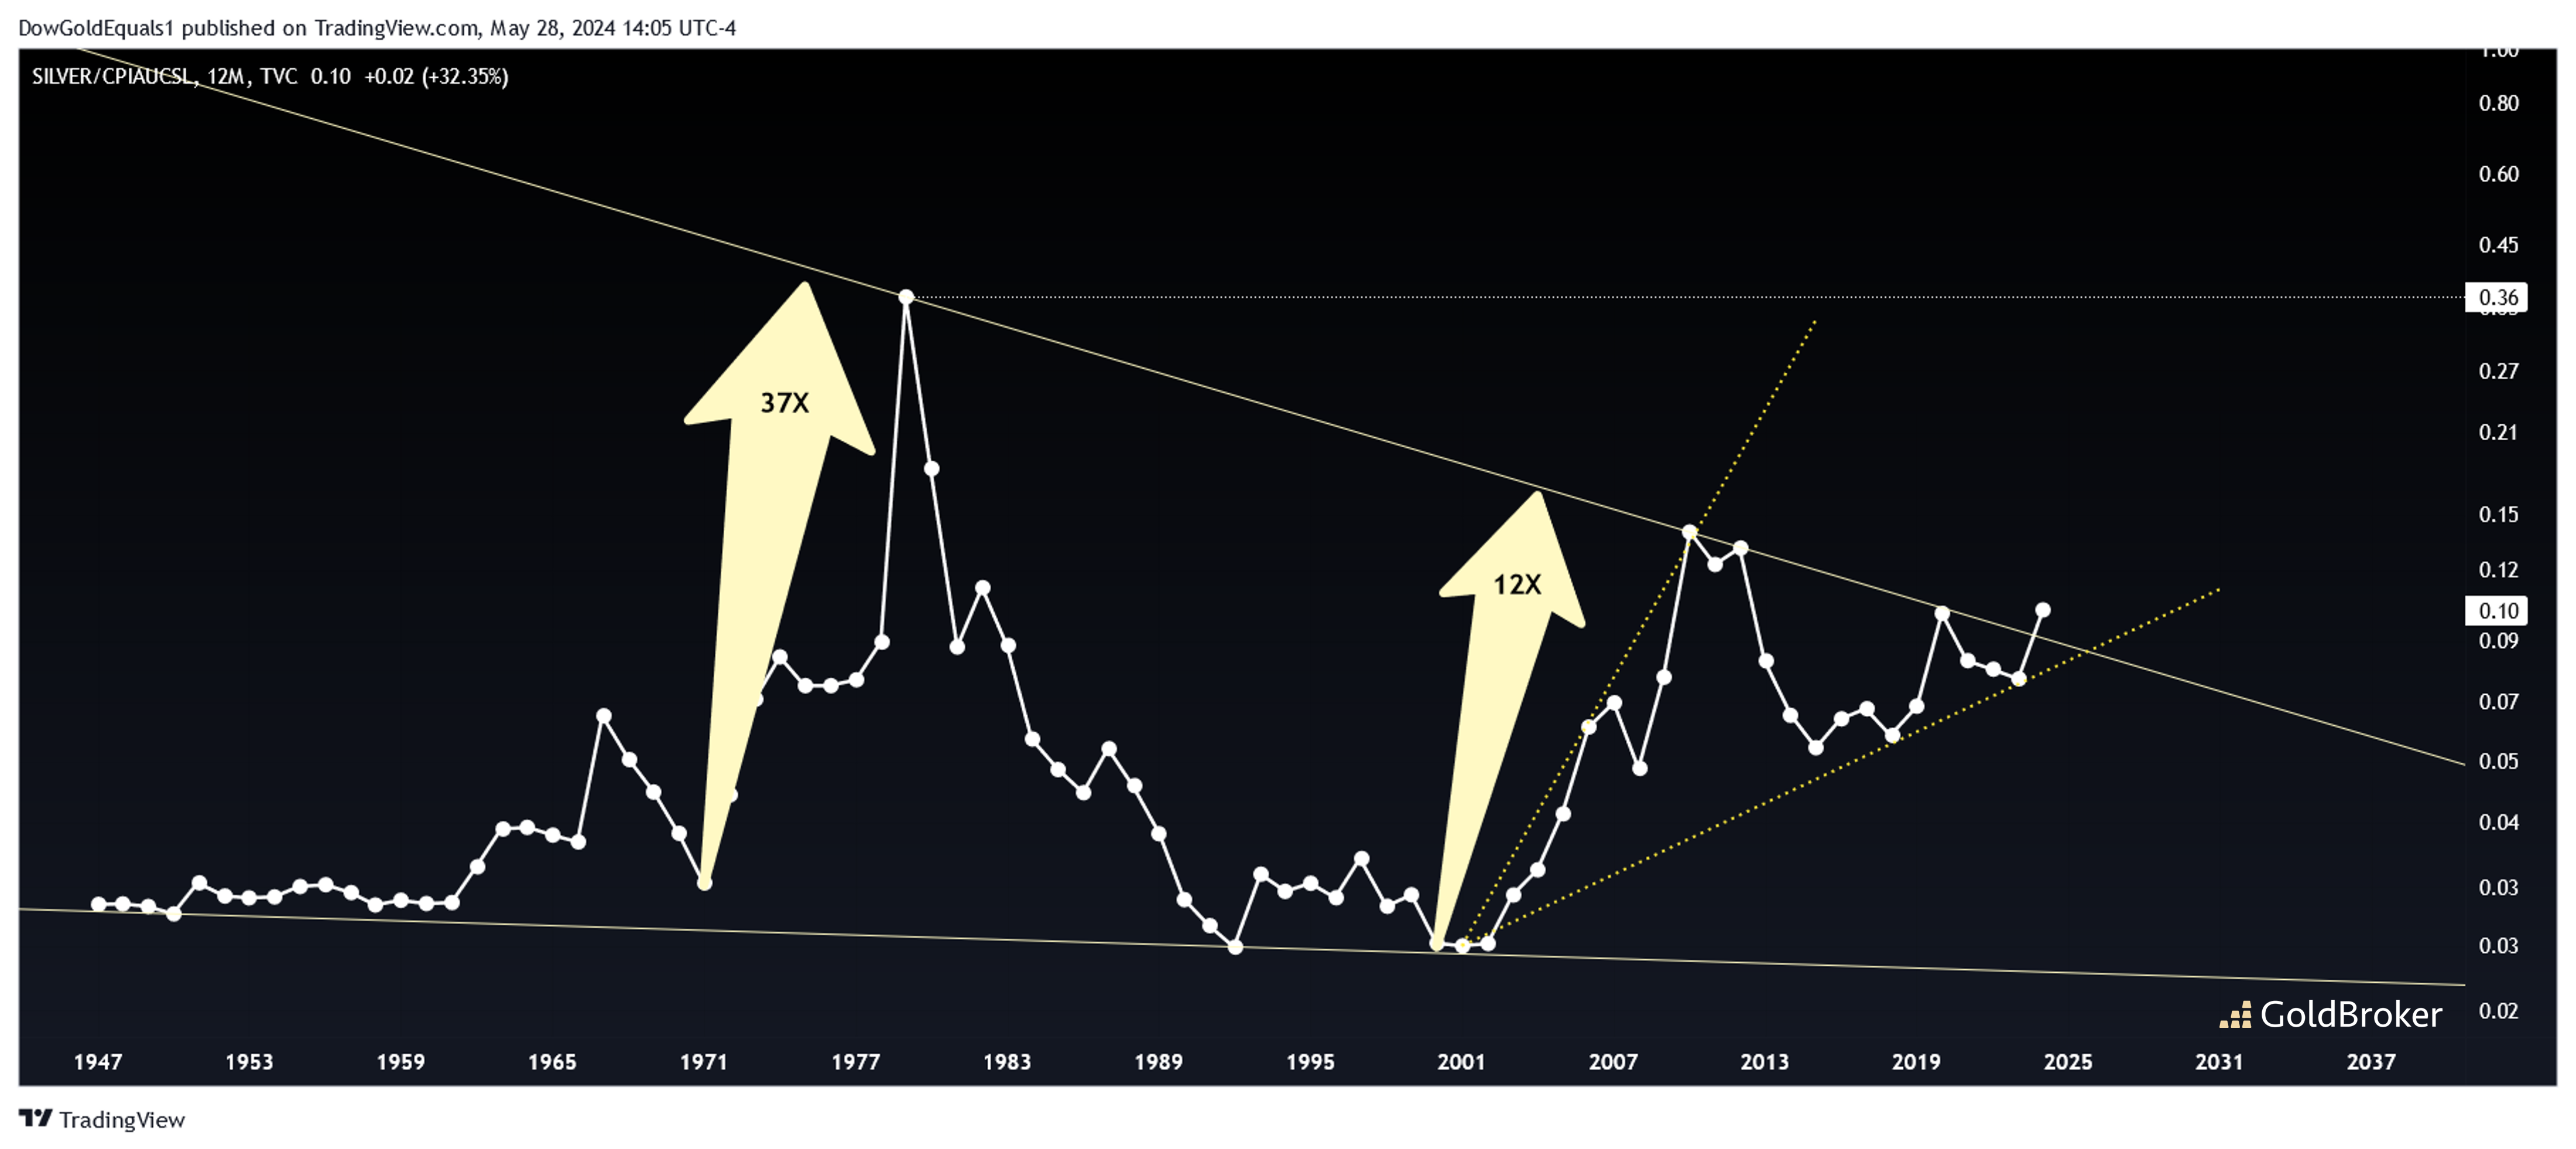
Silver/CPI is an equally compelling chart, as price has broken out of a huge wedge that goes back to the 1940s! Like with gold, we can see that when silver has outperfomed CPI, there have been big bull markets in silver. The measured move for a breakout of a wedge such as this is its all time high. Adjusting for inflation, that would put silver well into the triple digits. Again, we'll have to wait until year-end to see where this chart closes, but it is looking more and more likely that 2024 will be the year of the precious metals bull market breakout!
Reproduction, in whole or in part, is authorized as long as it includes all the text hyperlinks and a link back to the original source.
The information contained in this article is for information purposes only and does not constitute investment advice or a recommendation to buy or sell.


