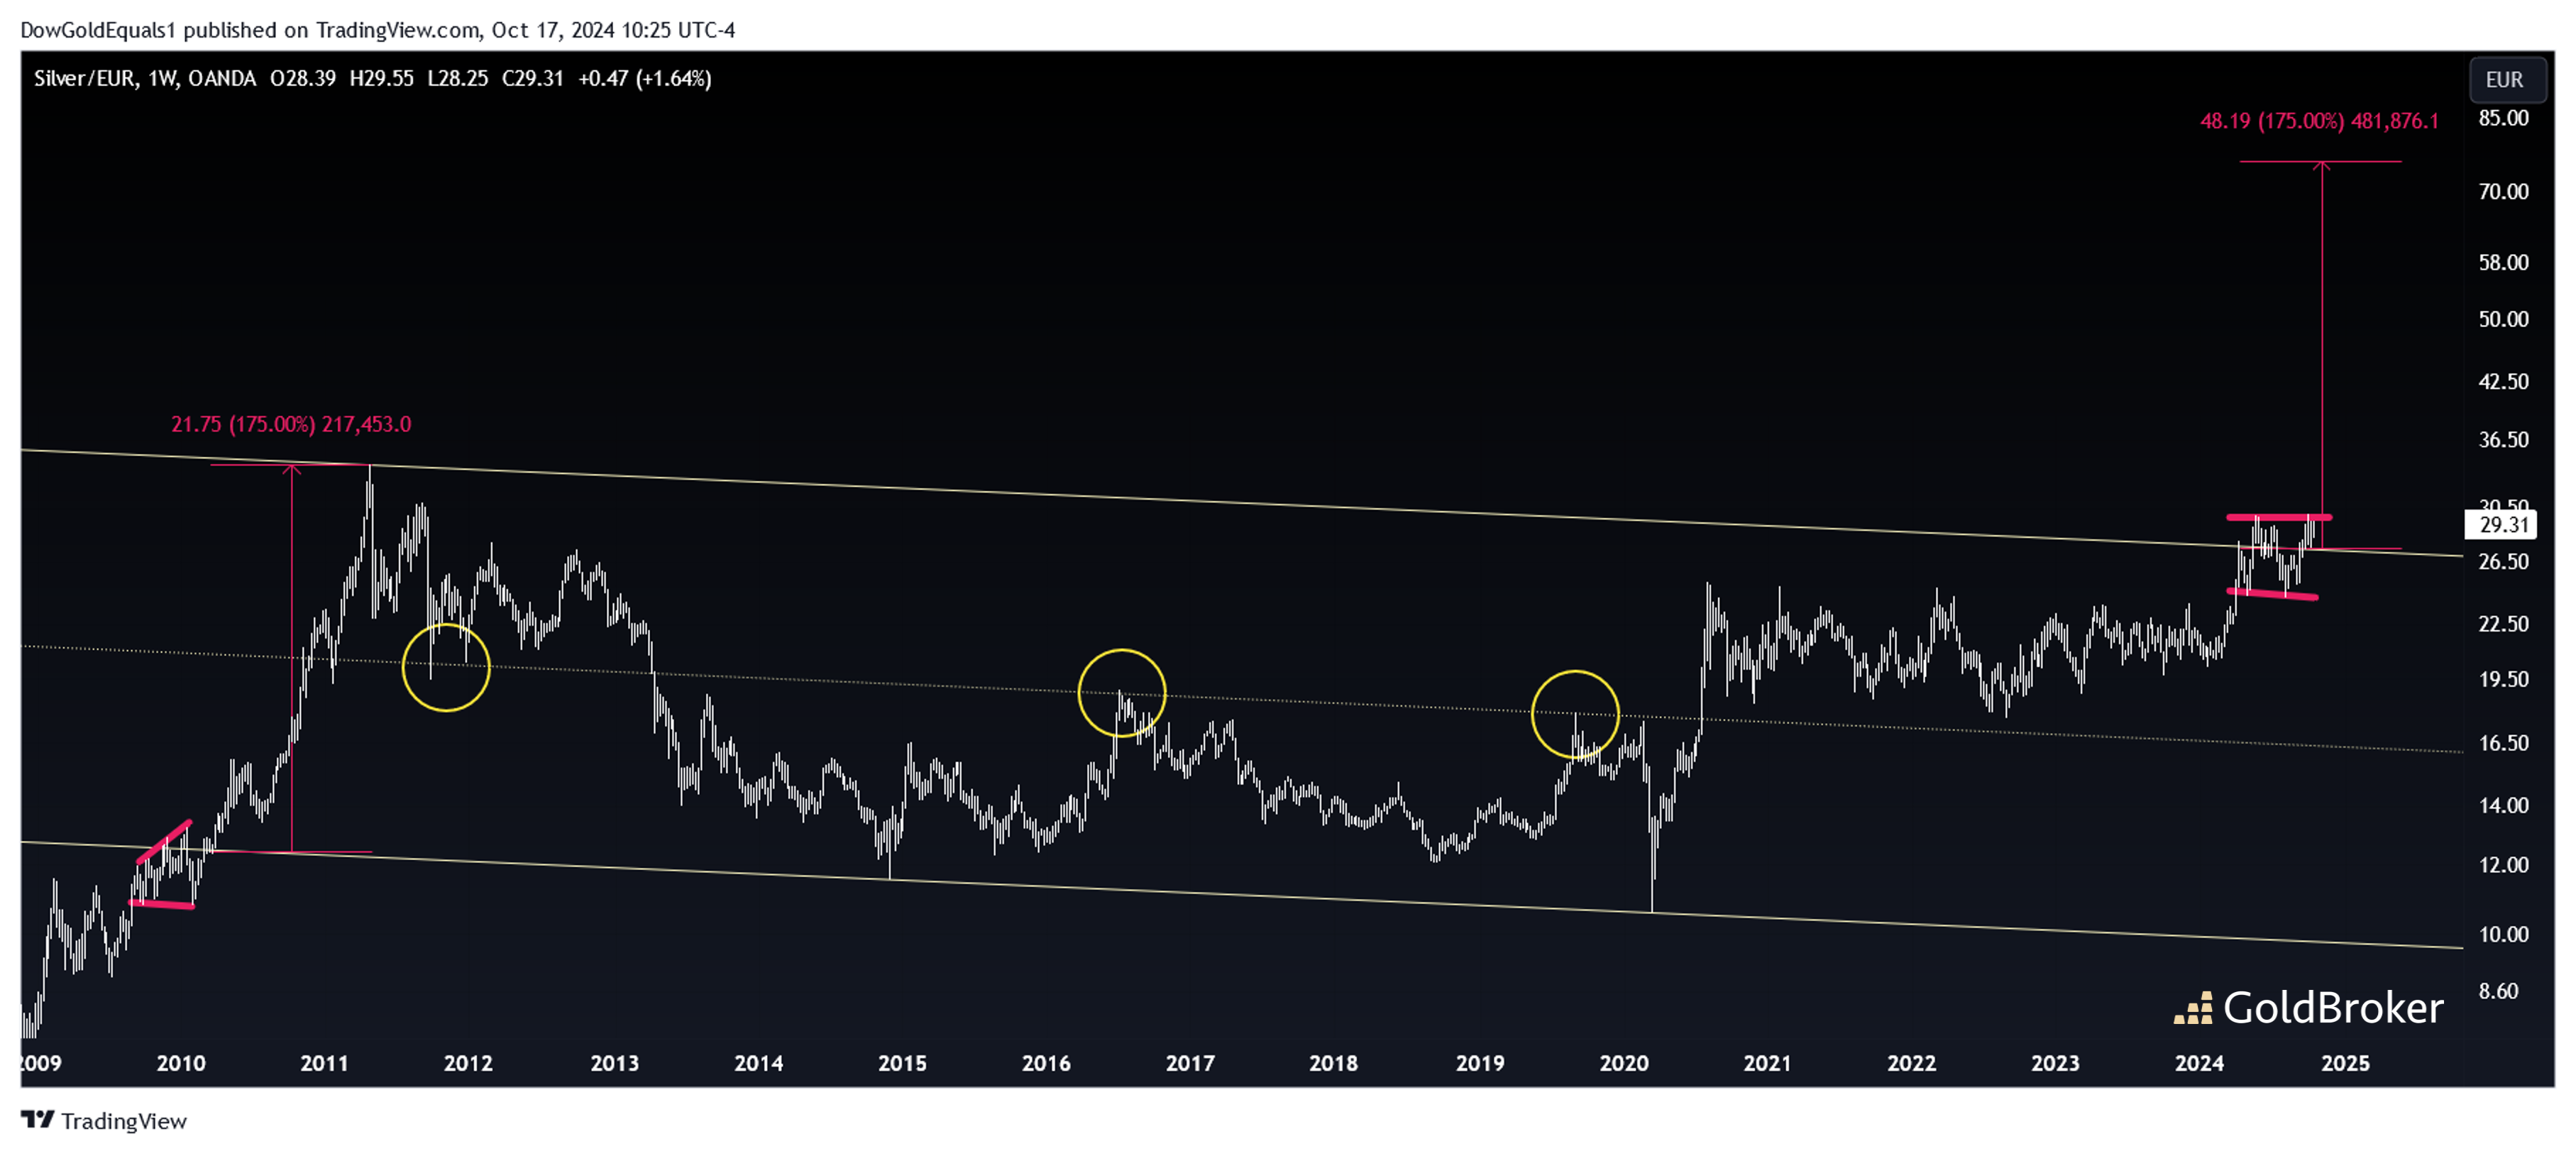
This week, we'll start with a look at Silver/Euro going back to 2010 and see that the price action over the past 15 years can be defined as a broad descending trading channel. When I look for trading channels, not only do I look for touch points at lower and upper rails, but I also look for how price interacts at the channel midline. If price bounces hard at a midline, as noted by the three yellow circles, that add validity to the channel. Also, if price pierces the midline and is followed by an impulsive move, that too adds validity. The price action in 2013 and 2020 are good examples. Finally, a good channel often sees price consolidate just below or above before entering the channel, as we noted by the pink broadening wedge in 2010 and we're now seeing again, noted by the pink consolidation of 2024. All this is to say that Silver/Euro has traded within a very strong technical channel, and price now appears to be attempting to break out. With all the energy of the last 15 years of trading about to explode upwards, it would not be surprising to see an impulse move similar to the one we saw in 2010 when price shot from the lower rail to the upper in 14 months. Such a move this time would see Silver/Euro north of 70 in short order.
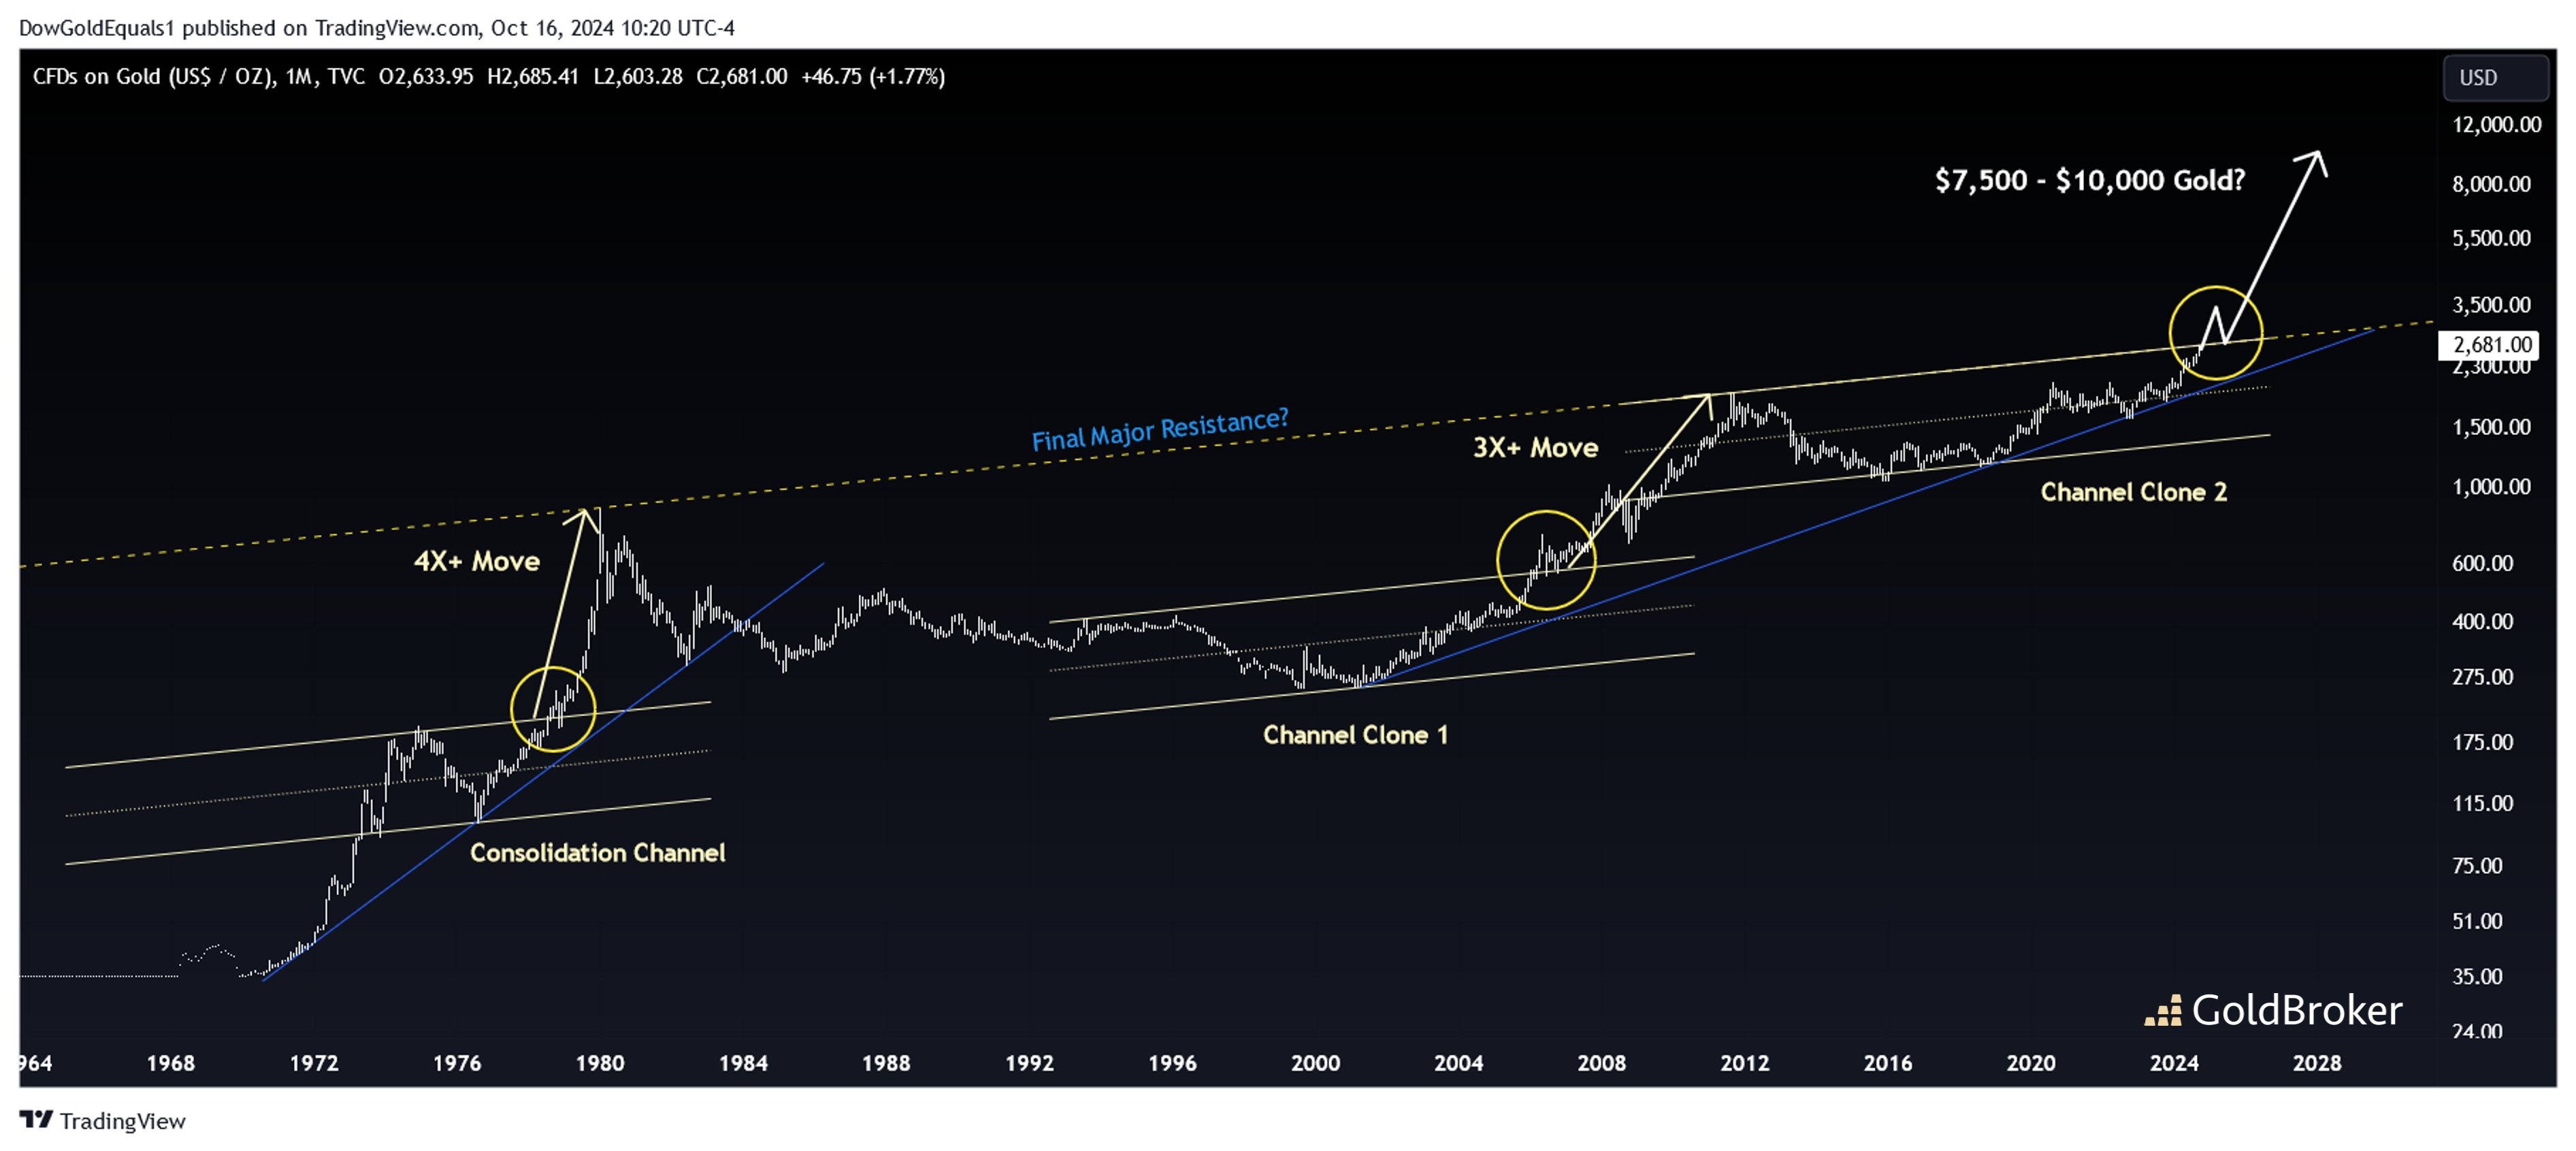
Switching over to gold, I'm excited to show you a chart you likely have not seen before - and one that should have even the staunchest bears thinking about their investment thesis. Most notable about this chart are the three trading channels that I've drawn exactly the same in time, width and angle. It is fascinating to see how price has conformed to these channels over three different decades of trading. Clearly, price has not spent the same amount of time in each channel, as gold traded within the 1970s channel for about five years; while the second channel saw price trade within it for about 15 years; and the third channel also has been trading about 15 years. What's truly exciting about these channels is what happened after price finally broke out. In the 70's, we see a channel backtest followed by a 4X+ move. After the 2006 breakout, we get another channel backtest followed by a 3X+ move. At present day, not only are we attempting to again break out of the channel, but we are also looking at a potential breakout from the 1980/2011 resistance line. Such a move is likely to be followed by a similarly strong impulse of 3X, 4X or more. This would put $10,000 Gold comfortably in range.
Reproduction, in whole or in part, is authorized as long as it includes all the text hyperlinks and a link back to the original source.
The information contained in this article is for information purposes only and does not constitute investment advice or a recommendation to buy or sell.


