Most financial analysts, including some who specialize in precious metals, analyze gold as a commodity however gold is not a commodity since unlike other commodities it is not consumed. Therefore, the traditional economic models and theories of supply and demand simply do not apply when analyzing gold. Gold is a monetary metal and as Prof. Antal Fekete says, “in the case of monetary metals, in contrast with all other commodities, high and increasing prices may not bring out new supply. Rather, they might make supply shrink. Monetary metals are exempt from the law of supply and demand.”
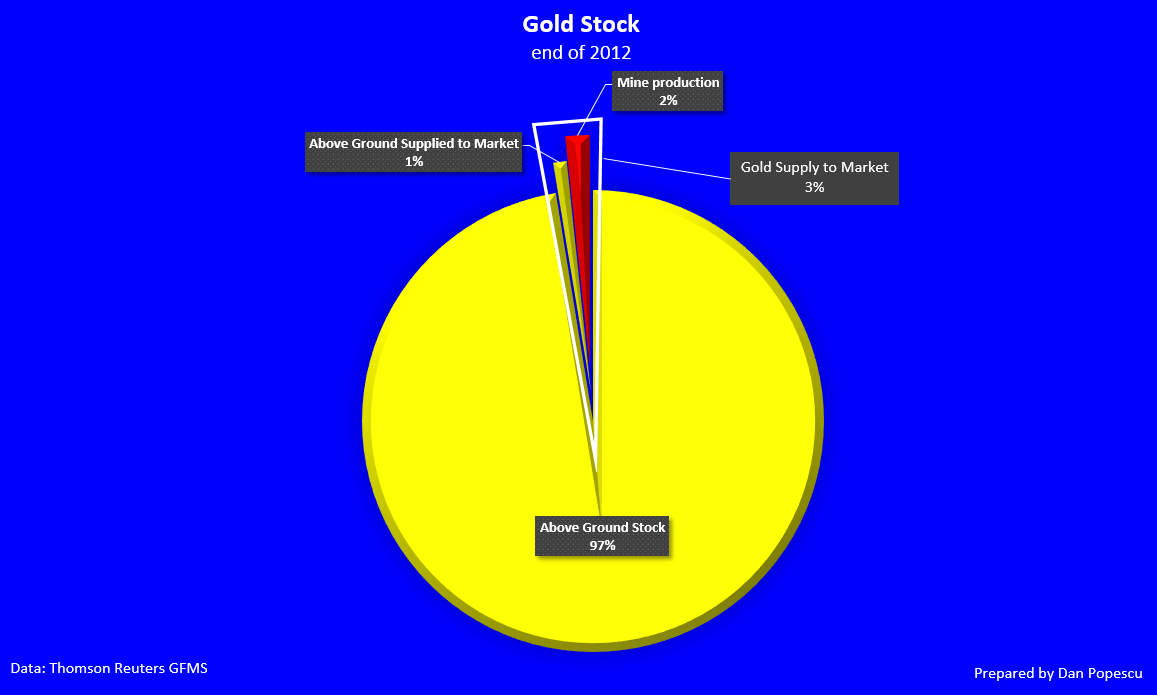
Graph #1 shows that gold mining represents only 1.64% of all the gold stock.
Graph #1
This is because of all the gold extracted throughout history from the relatively small number of mines, only a tiny fraction is ever “consumed” in the true sense. The overwhelming production is added to the ever-growing stockpiles of governments, corporations and private investors, along with small amounts of recycled scrap.
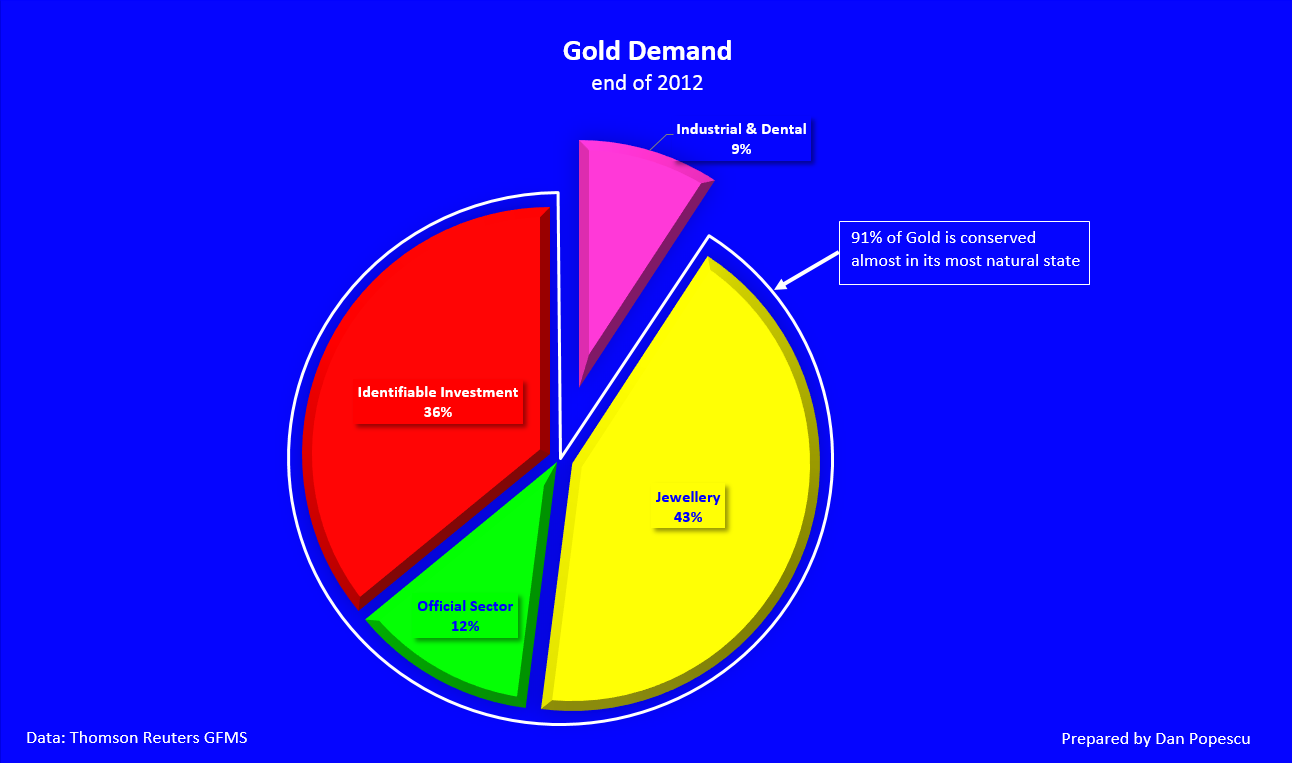
In the graph #2, we see that 91% of the gold demand retains gold in its most natural form while only 9% is wasted or is hard to recover.
Graph #2
It is estimated that there are about 174,100 tonnes of gold but this number is only an estimate. In my view, this is likely to be an underestimation of the order of about 10 to 20 times. Philip Barton of the Gold Standard Institute estimates that there are rather 1,200,000 to 2,500,000 tonnes of gold. The 174,100 estimation is based on a statistical approximation of the gold-mined using primitive means for 5,000 years. However, according to Philip Barton this estimation ignores the fact that until very recently, gold was easily found at the surface of the earth and did not require the same machinery it requires today. Nobody knows precisely how much gold was mined and that is still around in private or government safes.
Deficits or excesses in gold do not, and cannot affect the market price for the simple reason that nothing is actually consumed. In a sense, all that is happening in the market is that gold is moved from one person’s stockpile (the mining company) to another person’s stockpile (the investor). For gold, there is always a large stockpile and it never gets any smaller, it is simply the owners of the stockpile who change.
To understand the price of gold, the relevant supply is the total supply, not the new supply (mine production) coming to market during the last year (or week or month). The supply of gold consists of all of the supply that exists. The relevant demand is the total demand, not the new demand (mining) coming to market during any year. The vast majority of all gold mined throughout human history still exists and is held either in bars, coins, or jewelry.
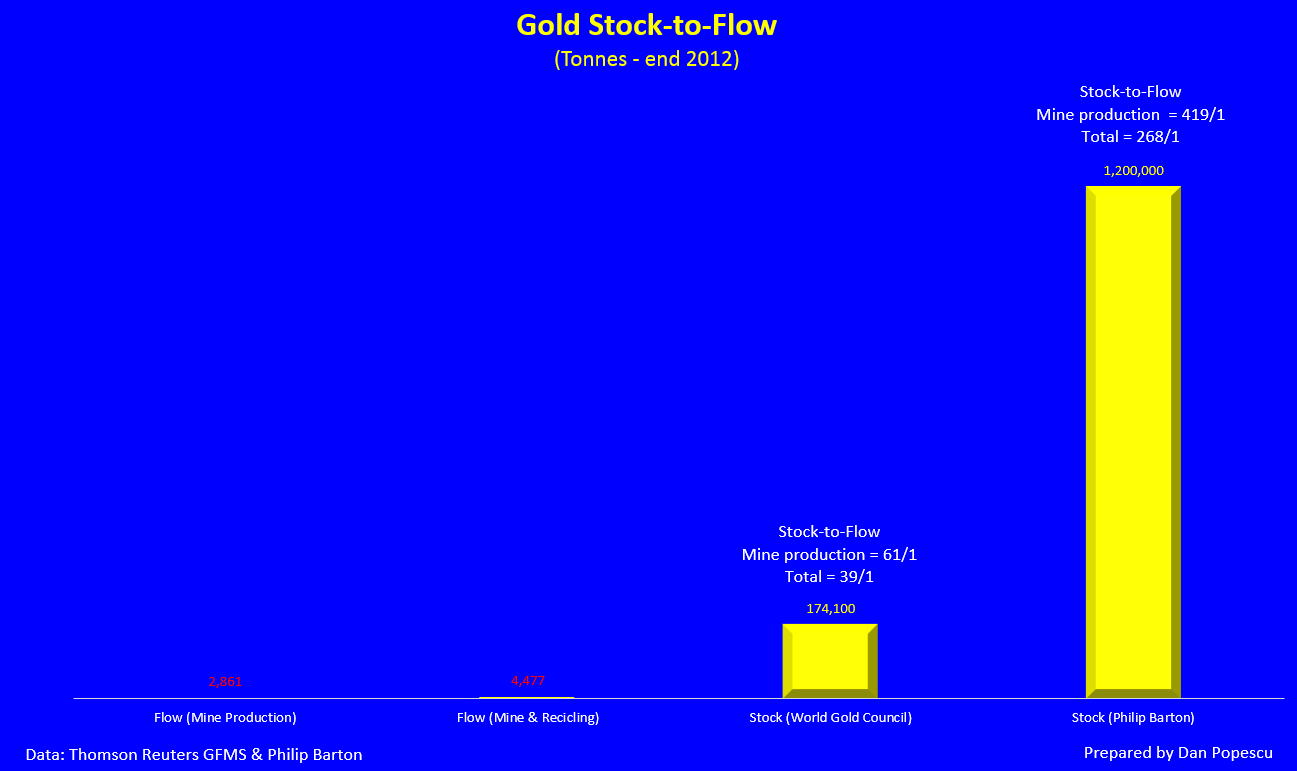
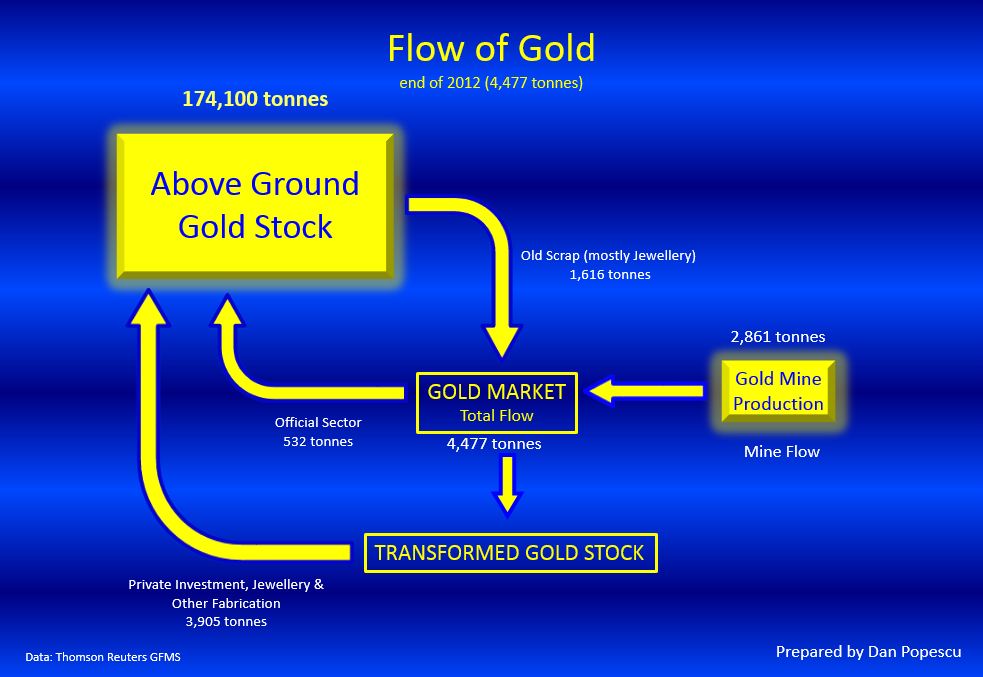
Mining represents only 1.64% of the total gold stock and, if we consider that, the total stock of gold is 1,200,000 tonnes then the mine supply goes down to 0.24%. Assuming 2,500,000 tonnes then mining represents only 0.11%. Therefore, how much impact can mine supply have on the price of gold? When we look at the graph #3, it is obvious that, in the gold market, miners cannot be price makers but they are rather price takers. There is 61 years of gold supply if we assume the total stock to be 174,100 (World Gold Council) and between 419 to 839 years of supply if we consider Philip Barton’s numbers. No matter which one we choose, they are both phenomenal.
Graph #3
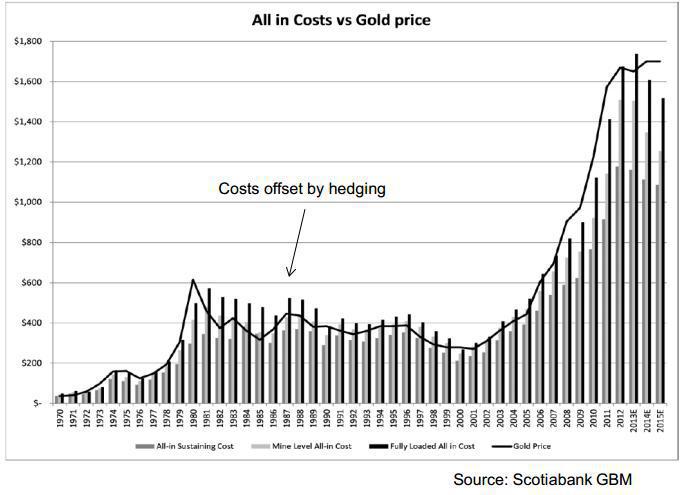
Looking at graph #4, we observe that the gold price has already dropped under the cost of production in the 80s when some argued it could not happen. More, it stayed under the cost of production for twenty years.
Graph #4
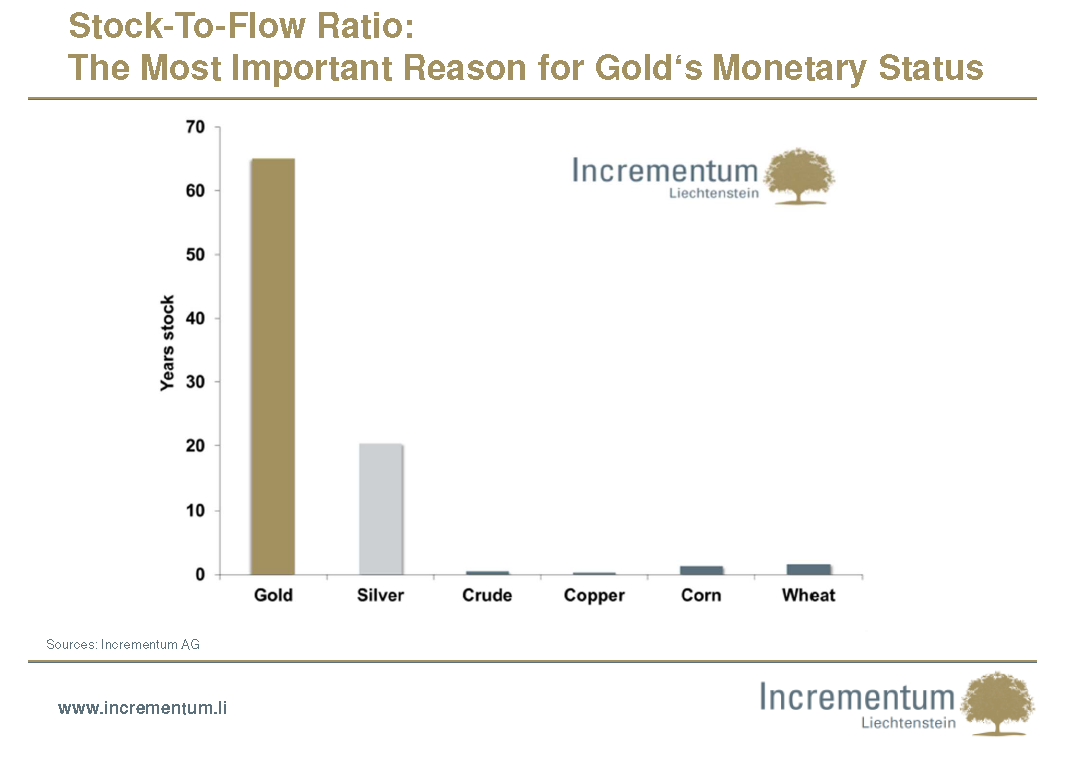
By looking at graph #5 we can understand better why gold is not a commodity like copper, oil or corn. The only commodity close to gold is silver (poor man’s gold) which behaves as a monetary metal but also as a commodity. The chart shows that the stock of copper or oil is close to one year’s demand while gold’s stock is around 60 years. This becomes obvious when we look at the uses of oil and corn which destroy all the stock and at the recovery of copper which is time consuming and therefore expensive. On the other hand, gold is stored in its most natural state, not consumed, requires only minimal cost to bring to market and can be done almost spontaneously.
Graph #5
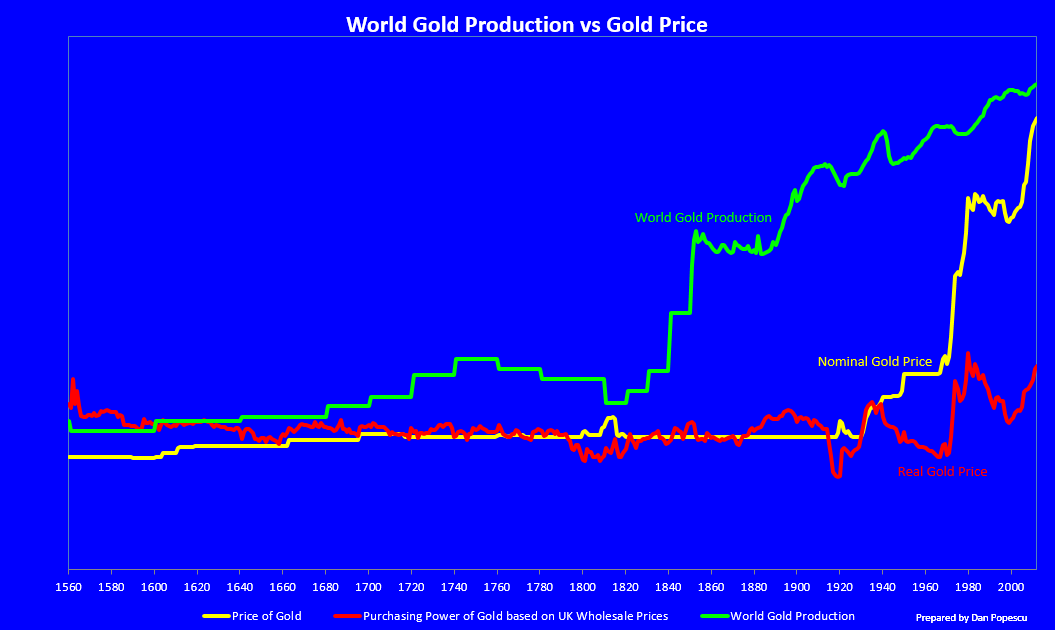
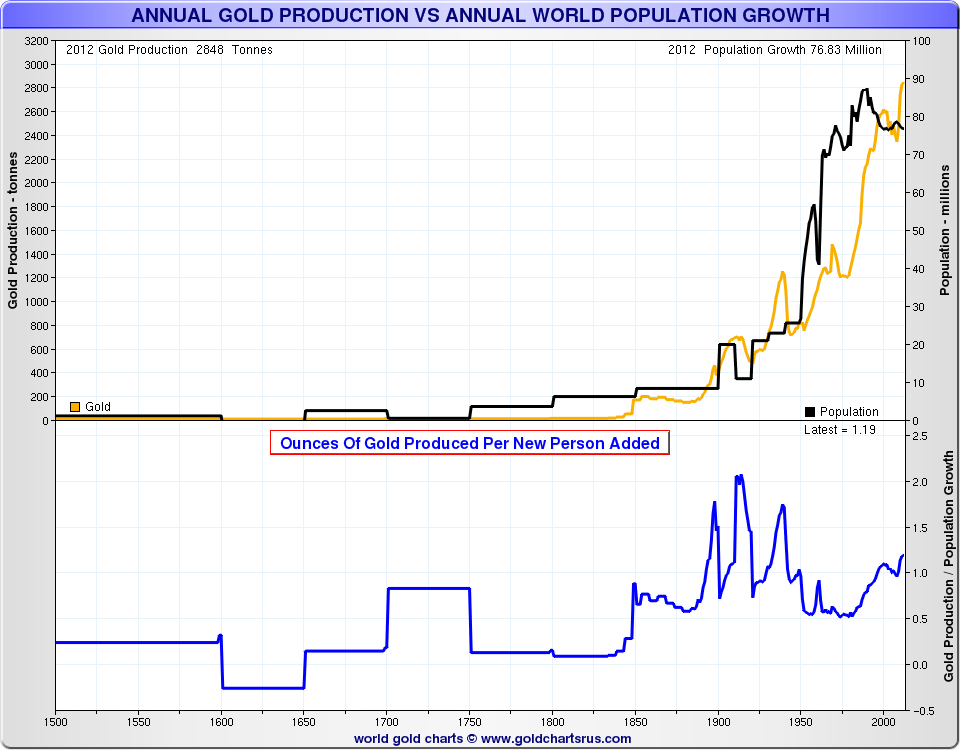
I would like to draw your attention to the next graph #6. We see that even when a very large mine supply of gold was brought to market, such as in the eighteen hundreds, the real price of gold barely changed. The traditional economic models based on “higher the supply - lower the price” do not apply to gold. Gold is highly valued at the assumed ratio of stock-to-flow of 61/1 or in my opinion, at the more realistic ratio of 419/1.
Graph #6
With the exception of the 9% industrial and dental use, all the gold is conserved in the most natural form, requiring minimal processing to be brought back to the market.
To be at scale in the flow chart below, the above ground gold stock rectangle should be 61 times larger than the gold mine rectangle and 39 times larger than the gold market rectangle. That would make it almost impossible to see.
Graph #7
For gold, there is always a large stockpile, and it never gets smaller. In most cases, when a buyer purchases gold, it moves from the seller’s hoard to the buyer’s hoard.
It is therefore very important when analyzing the price of gold to take into consideration the total demand not just the exchange demand. Exchange demand is expressed by giving up something in an exchange in order to for the thing demanded. For gold, it is 2.6%. Reservation demand is a demand that is expressed by holding onto something that you own and for gold, it is the 97.4% of the total stock of gold. People who hold gold are demanding it by holding it off the market.
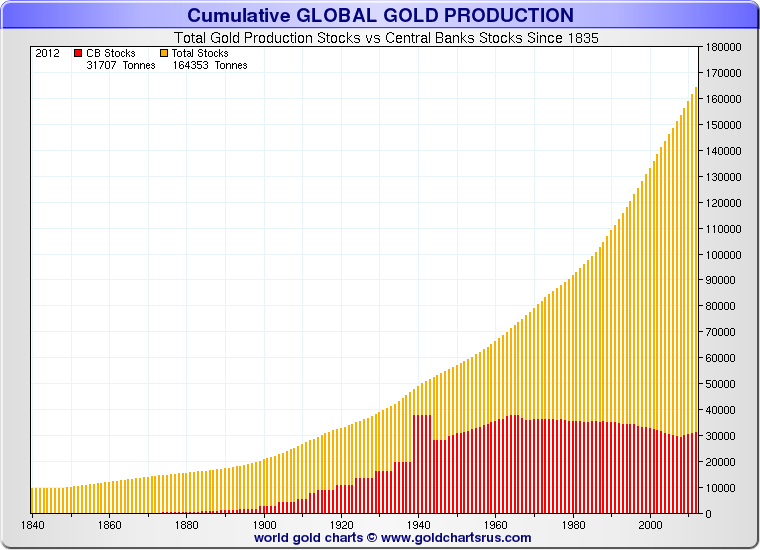
Now let us look at the stock of gold owned by the central banks as reported by the International Monetary Fund (IMF). We can see in the graph bellow that, if accurate, the stock of gold owned by central banks is one eights of the total stock of gold. If we take Philip Barton’s estimation of the stock of gold then the ratio becomes one fortieth of the total gold stock. It is not much but you must keep in mind that all this central bank stock can easily be brought to market in very large quantity, at low cost and very fast. Therefore, it can have a very big impact on the market, which consists of approximately 4,500 tonnes per year. In the nineties, both the IMF and the Bank of England influenced the price of gold just by threatening to sell large amounts. Today the reverse seems to be the case since central banks have become major buyers rather than sellers.
Graph #8
We must not forget that central banks do not all report their gold holdings or they only do it sporadically like China and Saudi Arabia. The IMF does not require it and does no verification of the data it receives from the central banks. Therefore, the current amount of around 30,000 tonnes could be a lot much higher. Information publicly available indicates that contrary to the nineties, since 2000, countries have been net buyers of gold for their reserves in large amounts and I expect this to continue. At the same time, those who have gold are not selling it (at least not at these prices). We could see central banks’ gold reserves in the next 5 to 10 years exceed 40,000 tonnes.
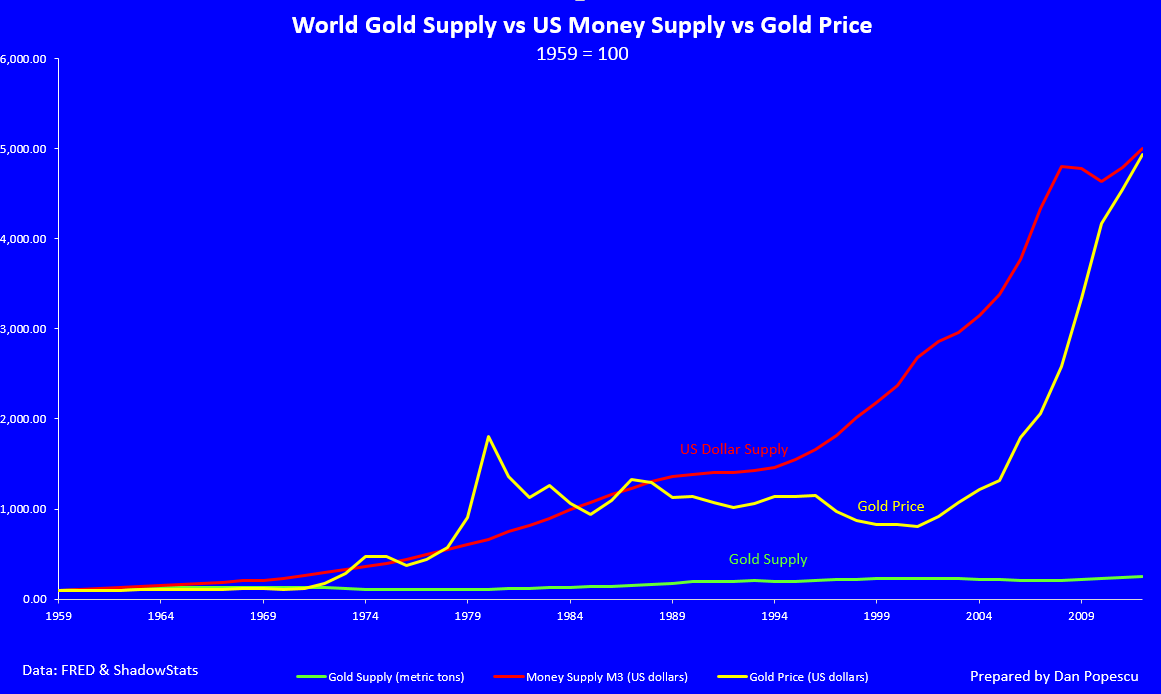
James Turk, founder of GoldMoney, compares the quantity of various currencies (M3) to the gold stock. Gold’s stock (gold’s equivalent of M3) increased approximately at the same rate as world population and new wealth creation, which are key components critical to determining the supply and demand for money. When M3 of a fiat currency grows faster than gold’s stock (see chart below), the fiat currency is being debased, and the price of gold in that currency will rise, assuming demand for both gold and the currency remain unchanged.
Graph #9
Graph #10
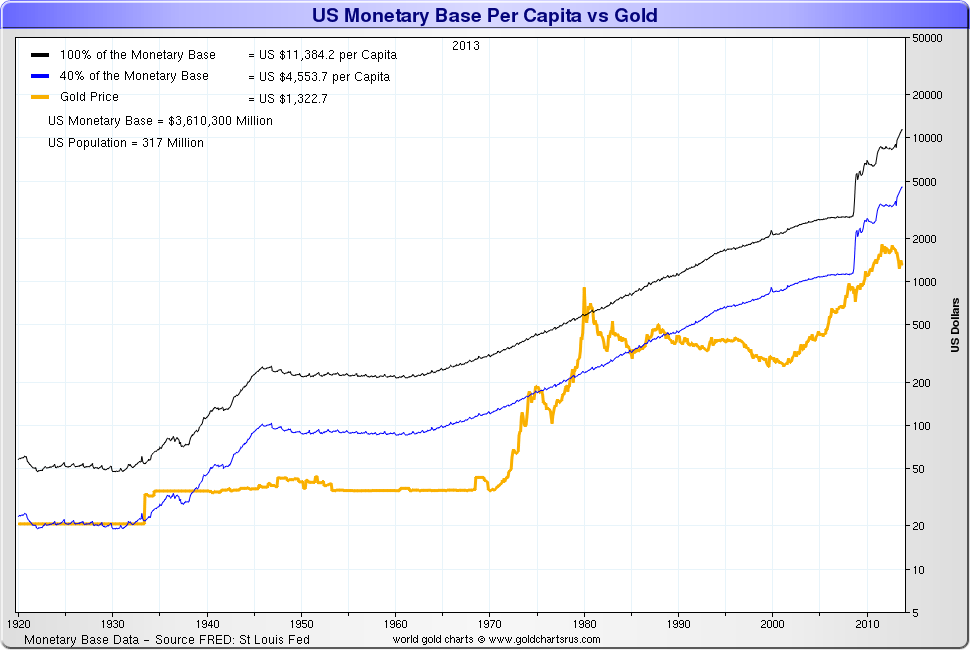
It is very important to understand gold supply, demand and stock because if gold is to become again part of the international monetary system after the collapse of the actual US dollar based monetary system than the market price of gold will be important in the reset. As we can see in the next chart (#11), a reset at 100% gold backing would mean a price of gold of US$ 11,384.2 and at 40% it would mean a price of gold of US$ 4,553.7.
Graph #11
Gold is not a commodity, but a hard currency and should be studied as such. It should be analyzed with fiat currencies (dollar, euro, yuan, etc.) and not with commodities (copper, oil or wheat, etc.). Yes, gold is a natural resource. It is extracted from earth, and because it is not consumed, but rather stored in its most natural form, it is not a commodity. Because of its exceptional natural characteristics, it has become all over the world and for thousands of years the best hard currency and without counterparty risk.
We are going through a period of major currency wars and gold is at the core of these wars. In the end, we will have a new international monetary system and, I predict it will be linked to gold in some form or another. It is gold’s monetary function that drives its price beyond the value it would have if it were just a commodity.
You must understand that the gold market is very opaque. The problem with the gold market is that most of the trading is not done on exchanges. In addition, both individuals and government institutions (central banks, sovereign funds, etc.) do not report all or some of their gold stock and sometimes even mislead the market on their stock.
“Gold is like a canary in the coal mine. It signals problems with respect to currency markets.” Alan Greenspan
"Money is gold and nothing else” John Pierpont Morgan
Reproduction, in whole or in part, is authorized as long as it includes all the text hyperlinks and a link back to the original source.
The information contained in this article is for information purposes only and does not constitute investment advice or a recommendation to buy or sell.
