This week we will look at a couple ratio charts that compare precious metals to real estate to get a sense of what might be the better investment going forward.
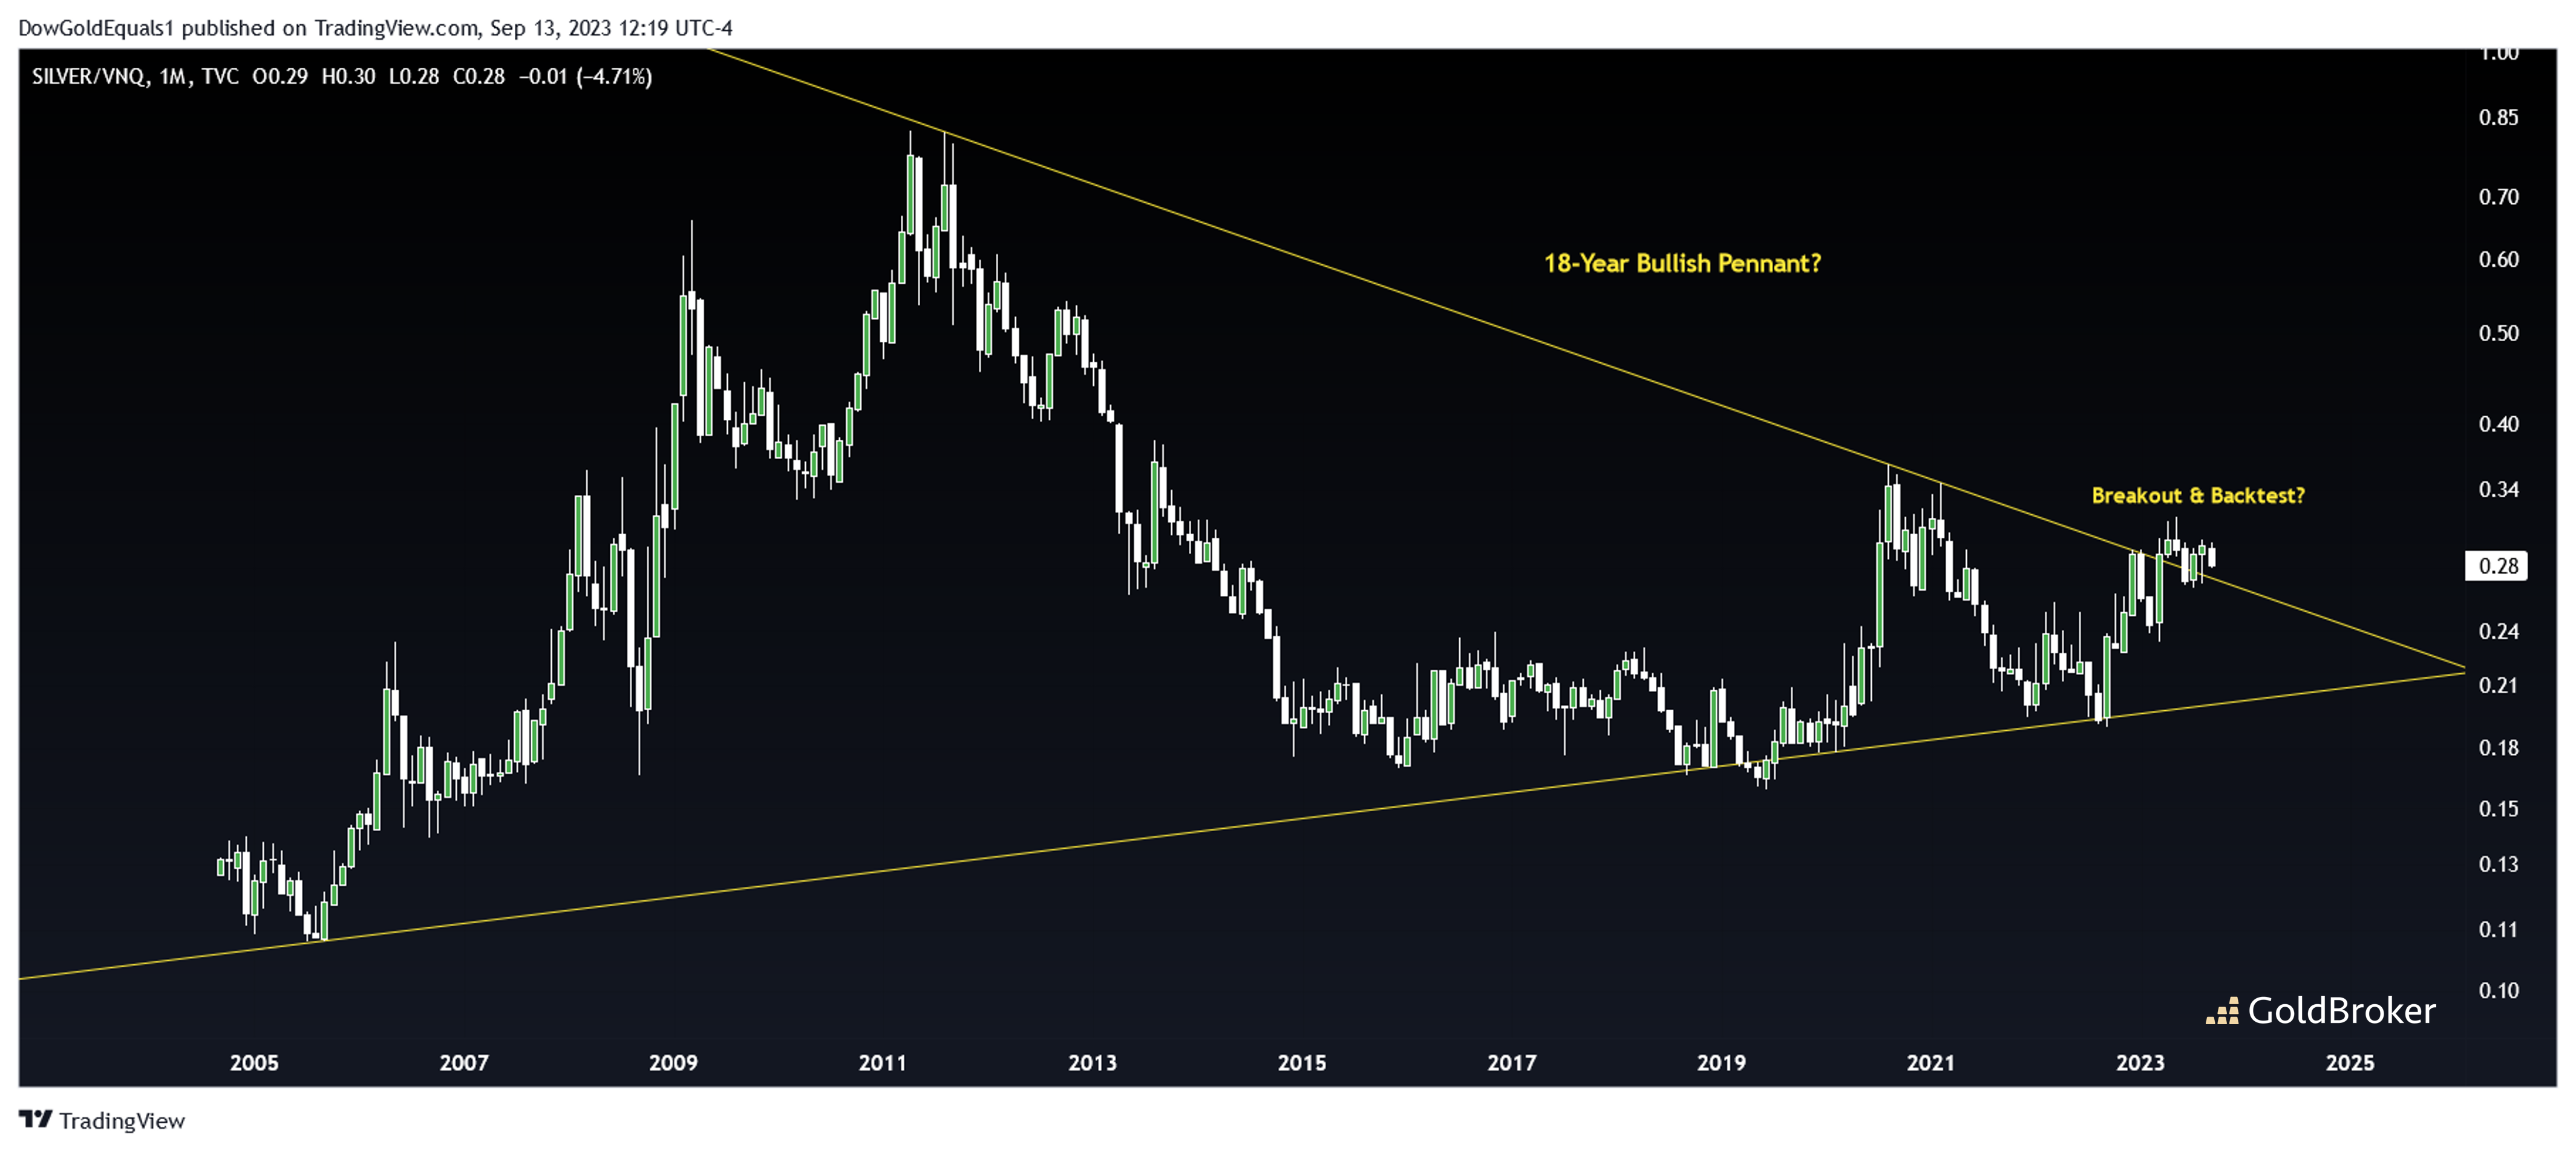
The first chart compares the price of Silver to VNQ - an ETF that invests in stocks of Real Estate Investment Trusts that purchase office buildings, hotels and other commercial property. Note that price has recently broken out of and backtested a compelling 18-year bullish pennant. I know there are many who are skeptical of such large structures, but the sheer number of touches within the pennant lends credibility and the breakout that occurred this year likely means Silver is to significantly outperform commercial property returns over the coming years.
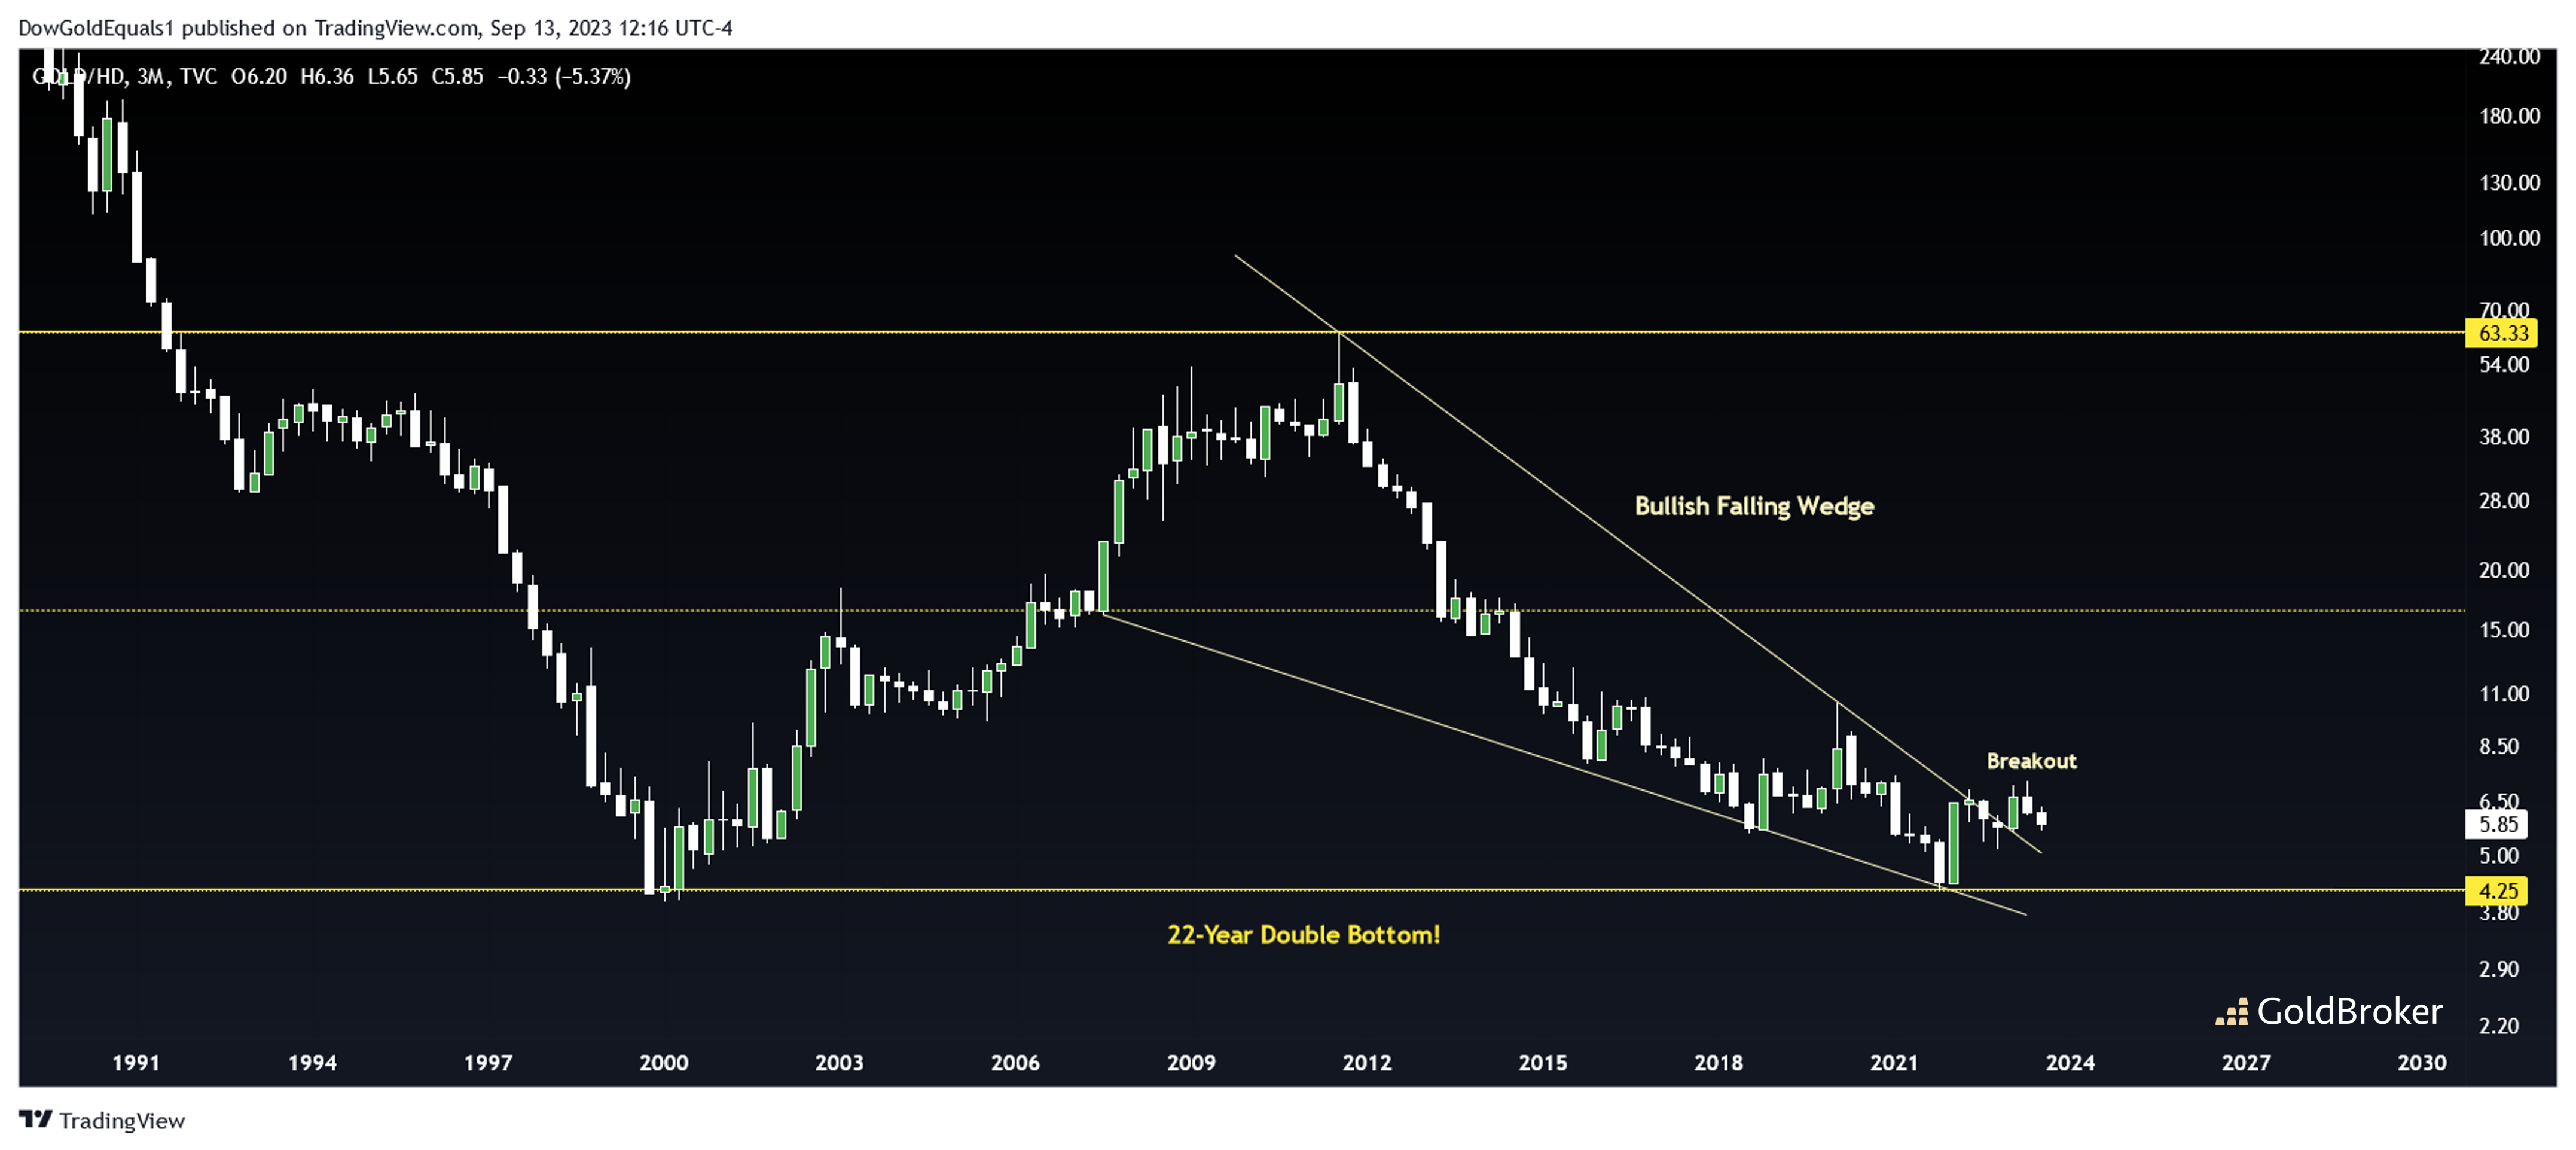
The second chart compares the price of Gold to Home Depot stock - a good proxy for the strength of the residential real estate market. The first thing that stands out is a very interesting 22-year double bottom. We all recall what happened to the price of Gold after that first bottom in 2000. We also know what happened to residential real estate as this ratio topped from 2008-2012. It now appears that the ratio has broken out this year from a large bullish falling wedge, which means this ratio might be set to rise substantially over the coming years. If this chart plays out, it looks like indeed that precious metals, not real estate, will be the place to be.
Reproduction, in whole or in part, is authorized as long as it includes all the text hyperlinks and a link back to the original source.
The information contained in this article is for information purposes only and does not constitute investment advice or a recommendation to buy or sell.


