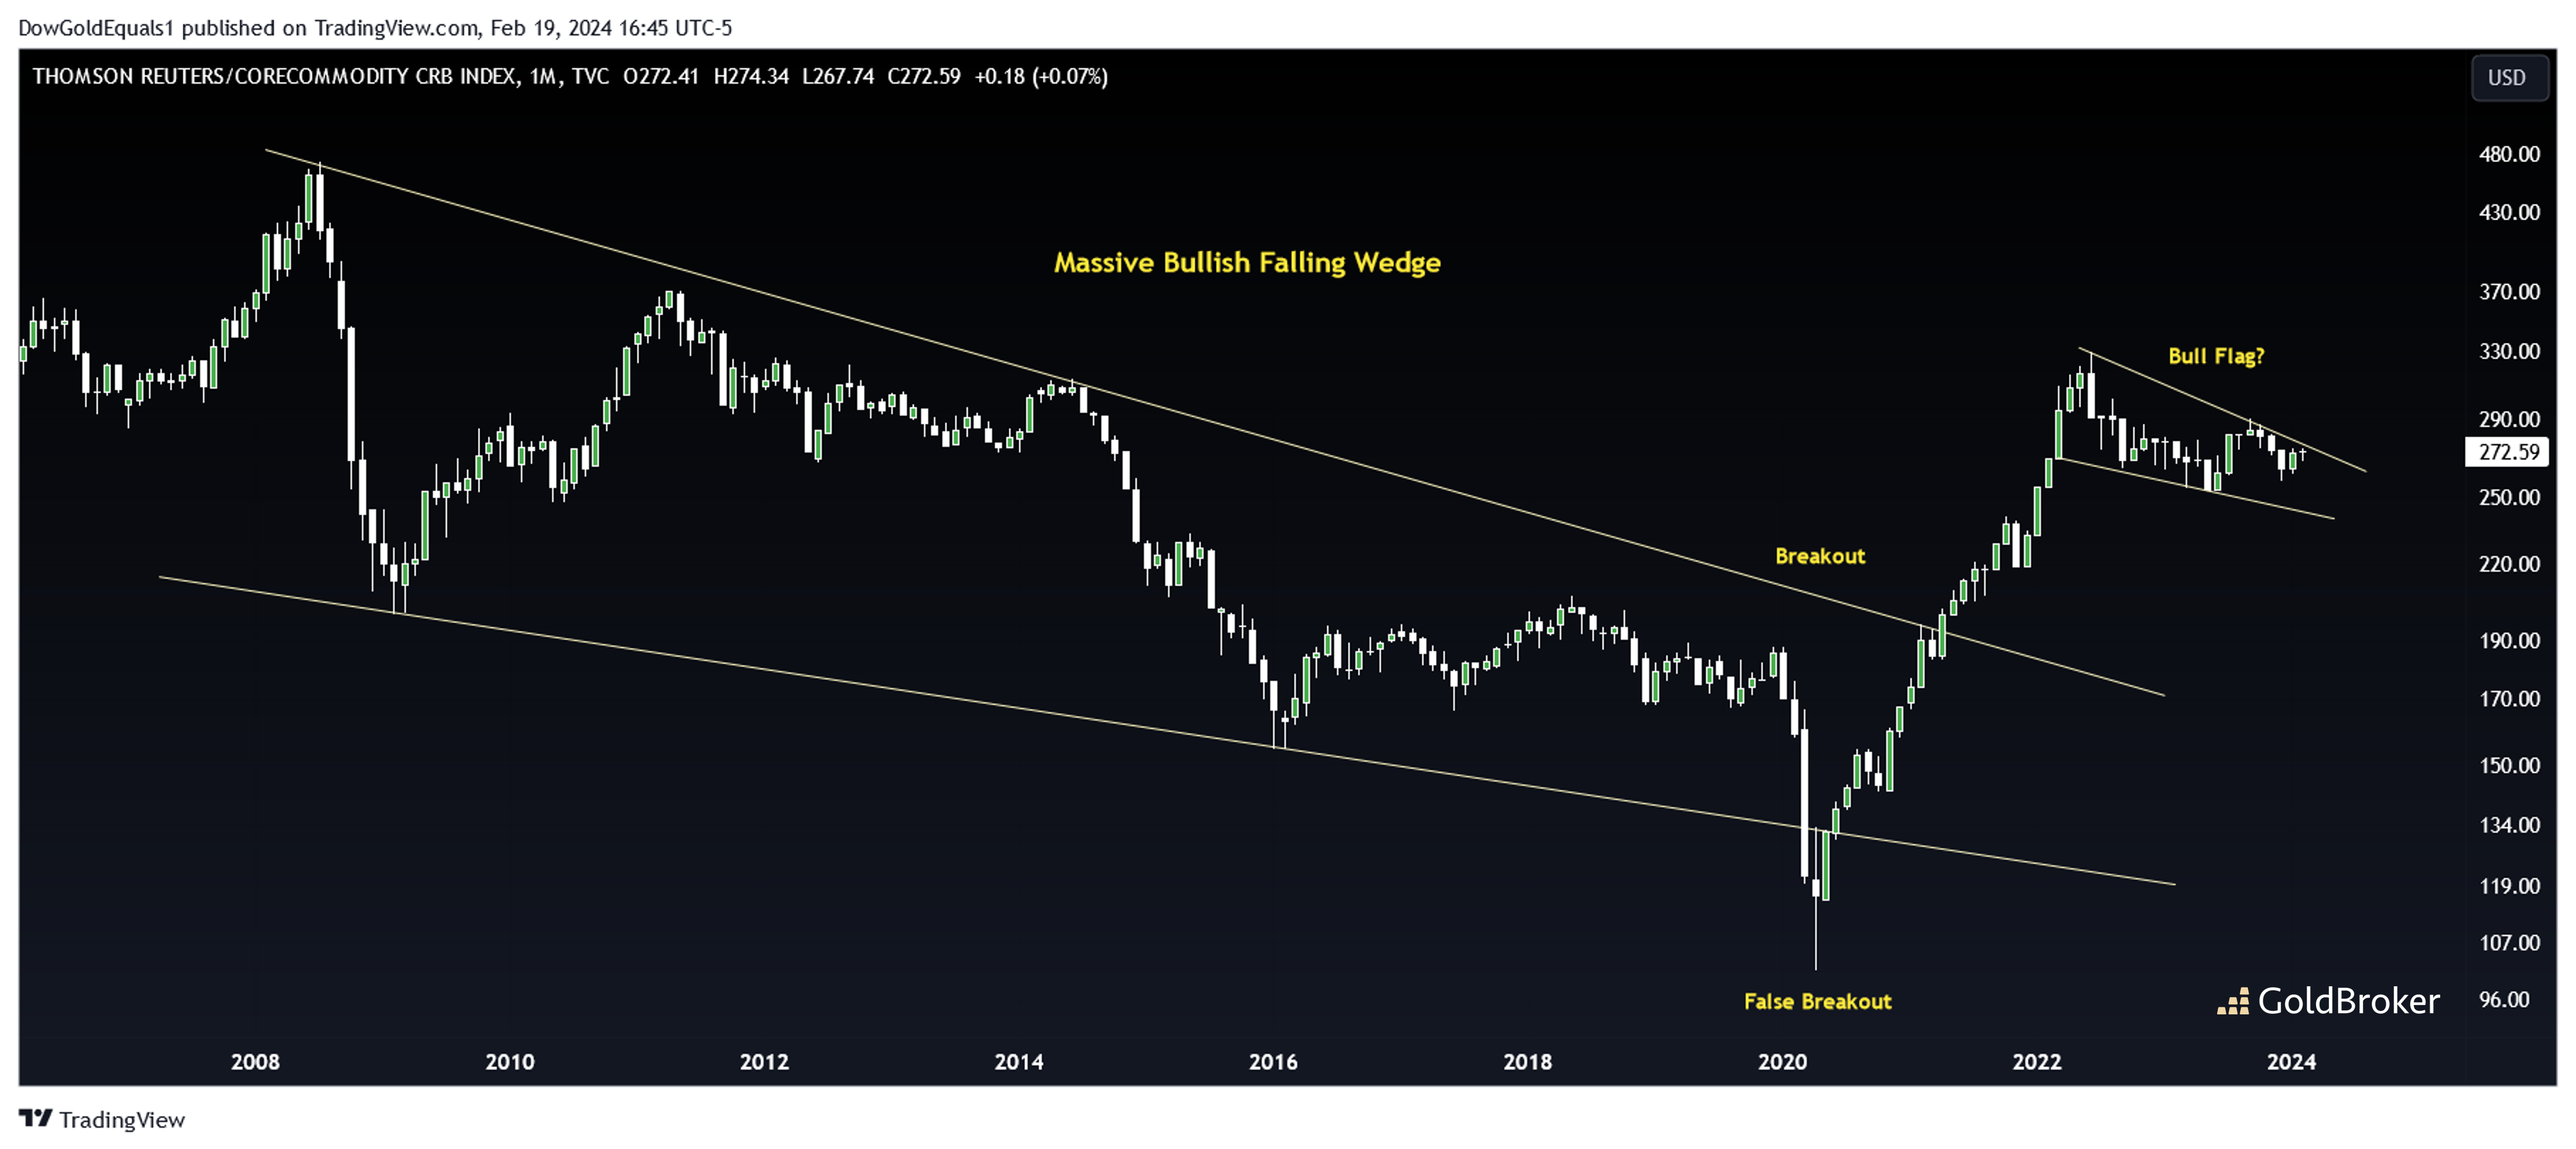
This week we'll look at a chart of the CRB Index, a broad proxy for the global commodities market that includes gold and silver, but also Corn, Live Cattle, Soybeans, Orange Juice and a host of other raw commodities. CRB is an excellent way to track overall inflation. The chart is fascinating: a decade-plus bullish falling wedge that gave us a false breakout during the 2020 Covid scare that reversed when policy-makers around the world gave us an inflationary impulse that caused this chart to breakout in 2021. Overall, we can see that the period that began with the Global Financial Crisis in 2008 and ended with Covid was indeed a disinflationary time. Interesting to note is that gold doubled in price from around $1,000 in 2008 to around $2,000 by 2020, a testament to its bull market strength during this time.
Since 2022, it appears that the CRB has formed a bull flag off the 2020 impulse leg higher. Should this bull flag break out, we are looking at another inflationary impulse higher. It will be important to protect your purchasing power with gold and silver should this occur.
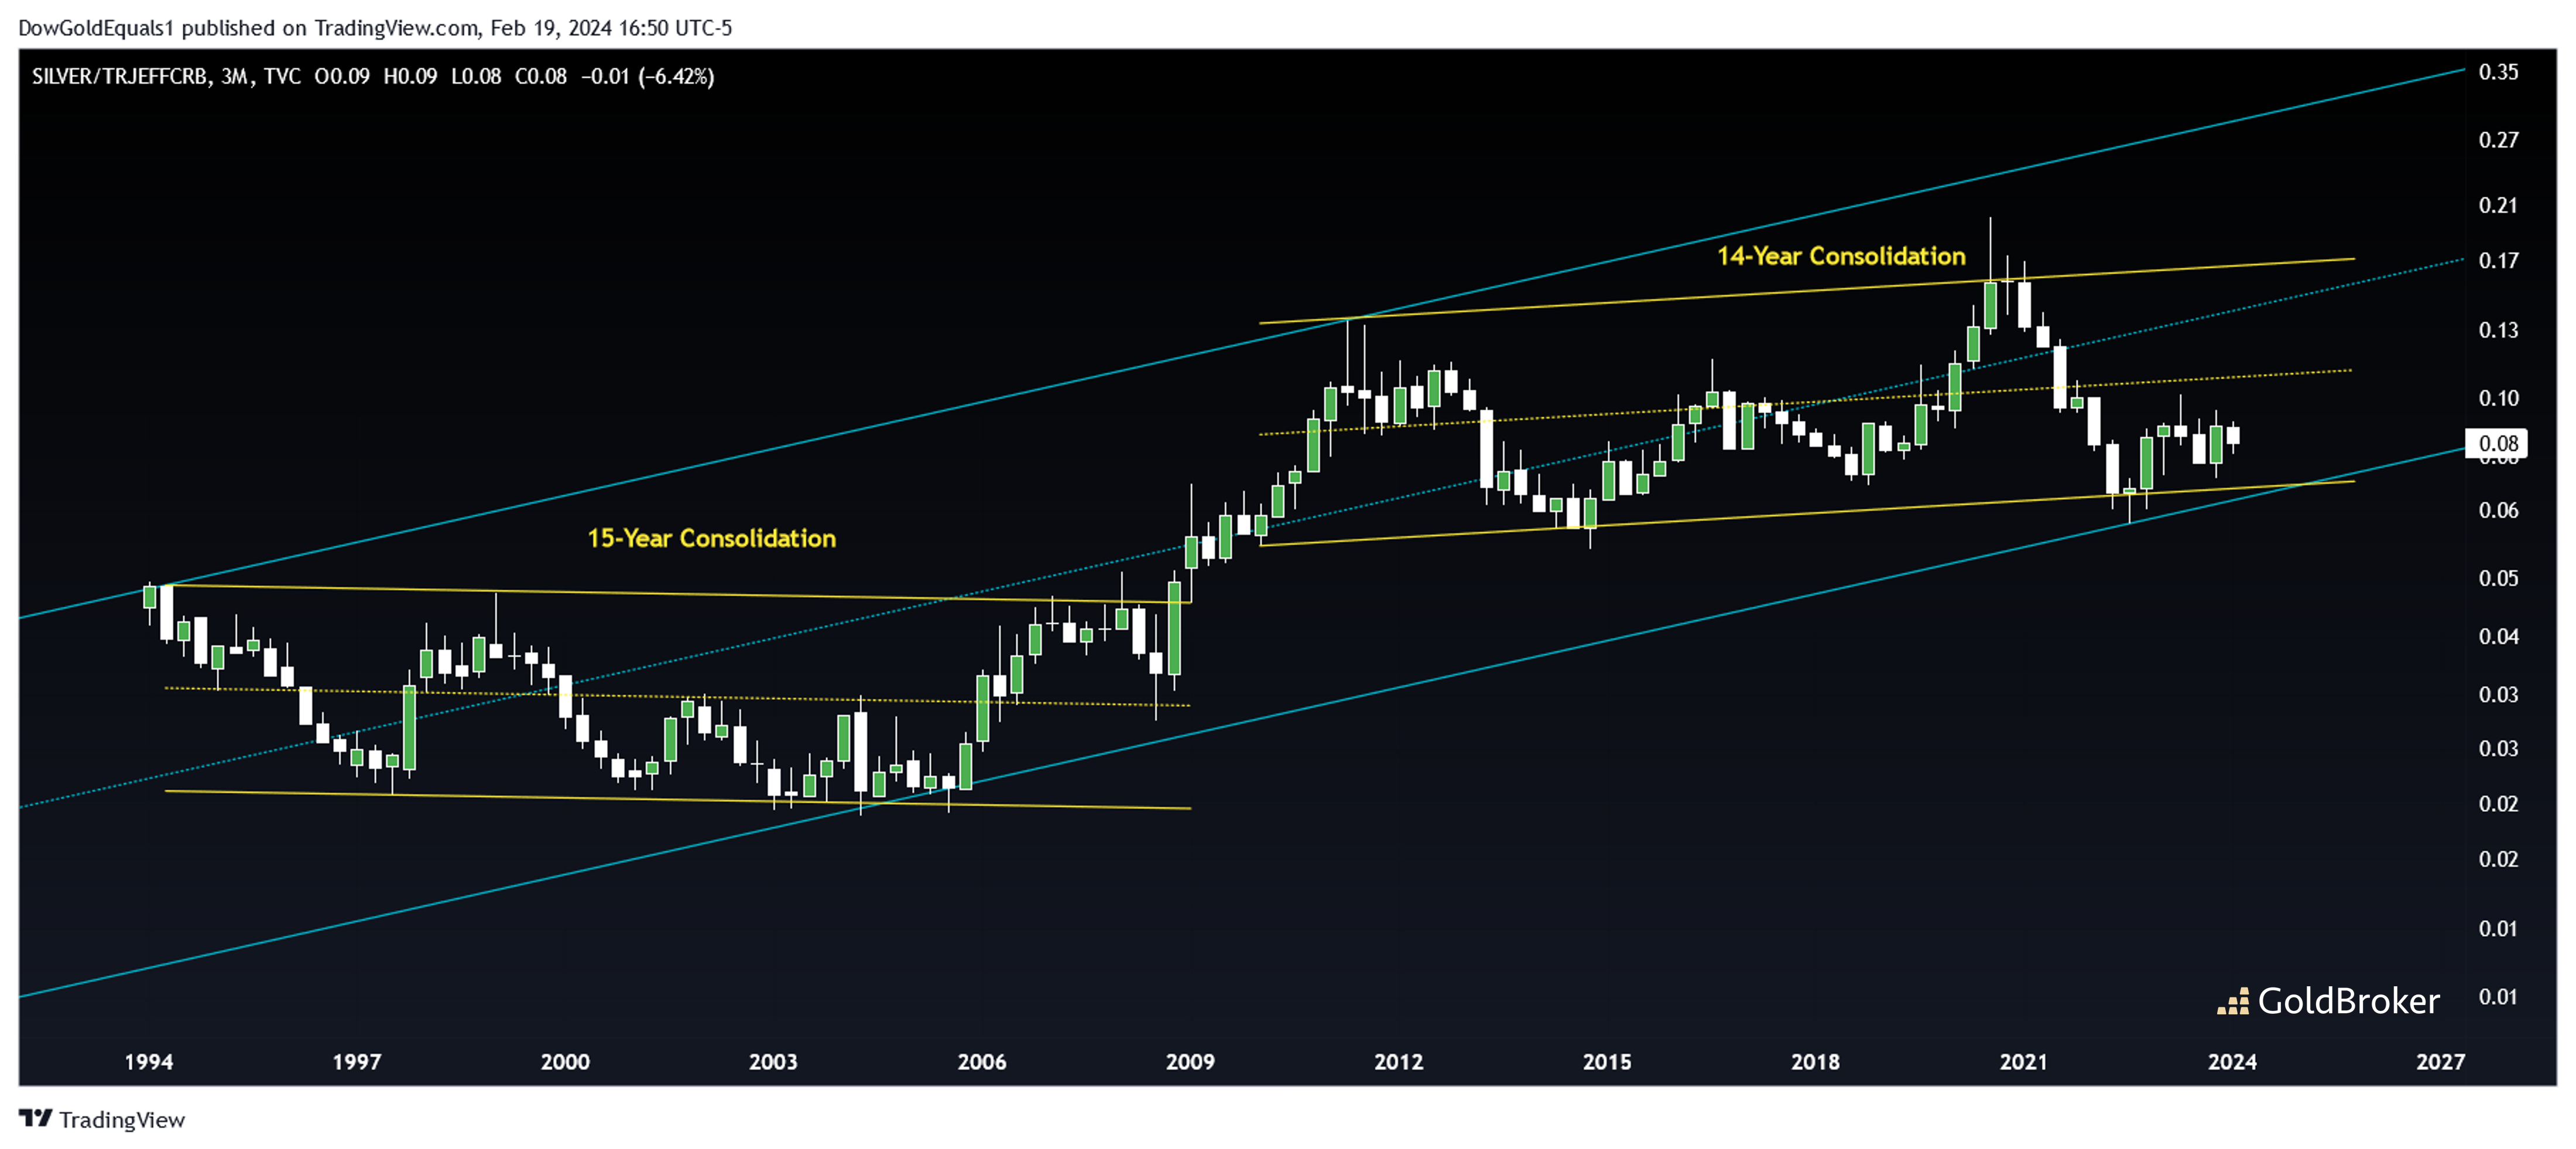
The next chart we will look at is the ratio of silver to the CRB. If precious metals are going to roar, we want to see them outperforming the general basket of commodities. The 30-year chart shows us an ascending channel that shows us that silver very broadly has indeed outperformed the CRB. Within the blue channel we see a couple of large consolidations. When the first one broke out in 2009, silver went vertical toward its 2011 All Time High of $50. If silver can break out above its current consolidation, that will be a clue that Silver is about to go vertical once again.
Reproduction, in whole or in part, is authorized as long as it includes all the text hyperlinks and a link back to the original source.
The information contained in this article is for information purposes only and does not constitute investment advice or a recommendation to buy or sell.


