It has been more than a year since we last looked at the Dow/Gold ratio, which at the time was threatening to break down from a very large bear flag. This week, we'll update those charts and see that the expected breakdown has indeed occurred as anticipated.
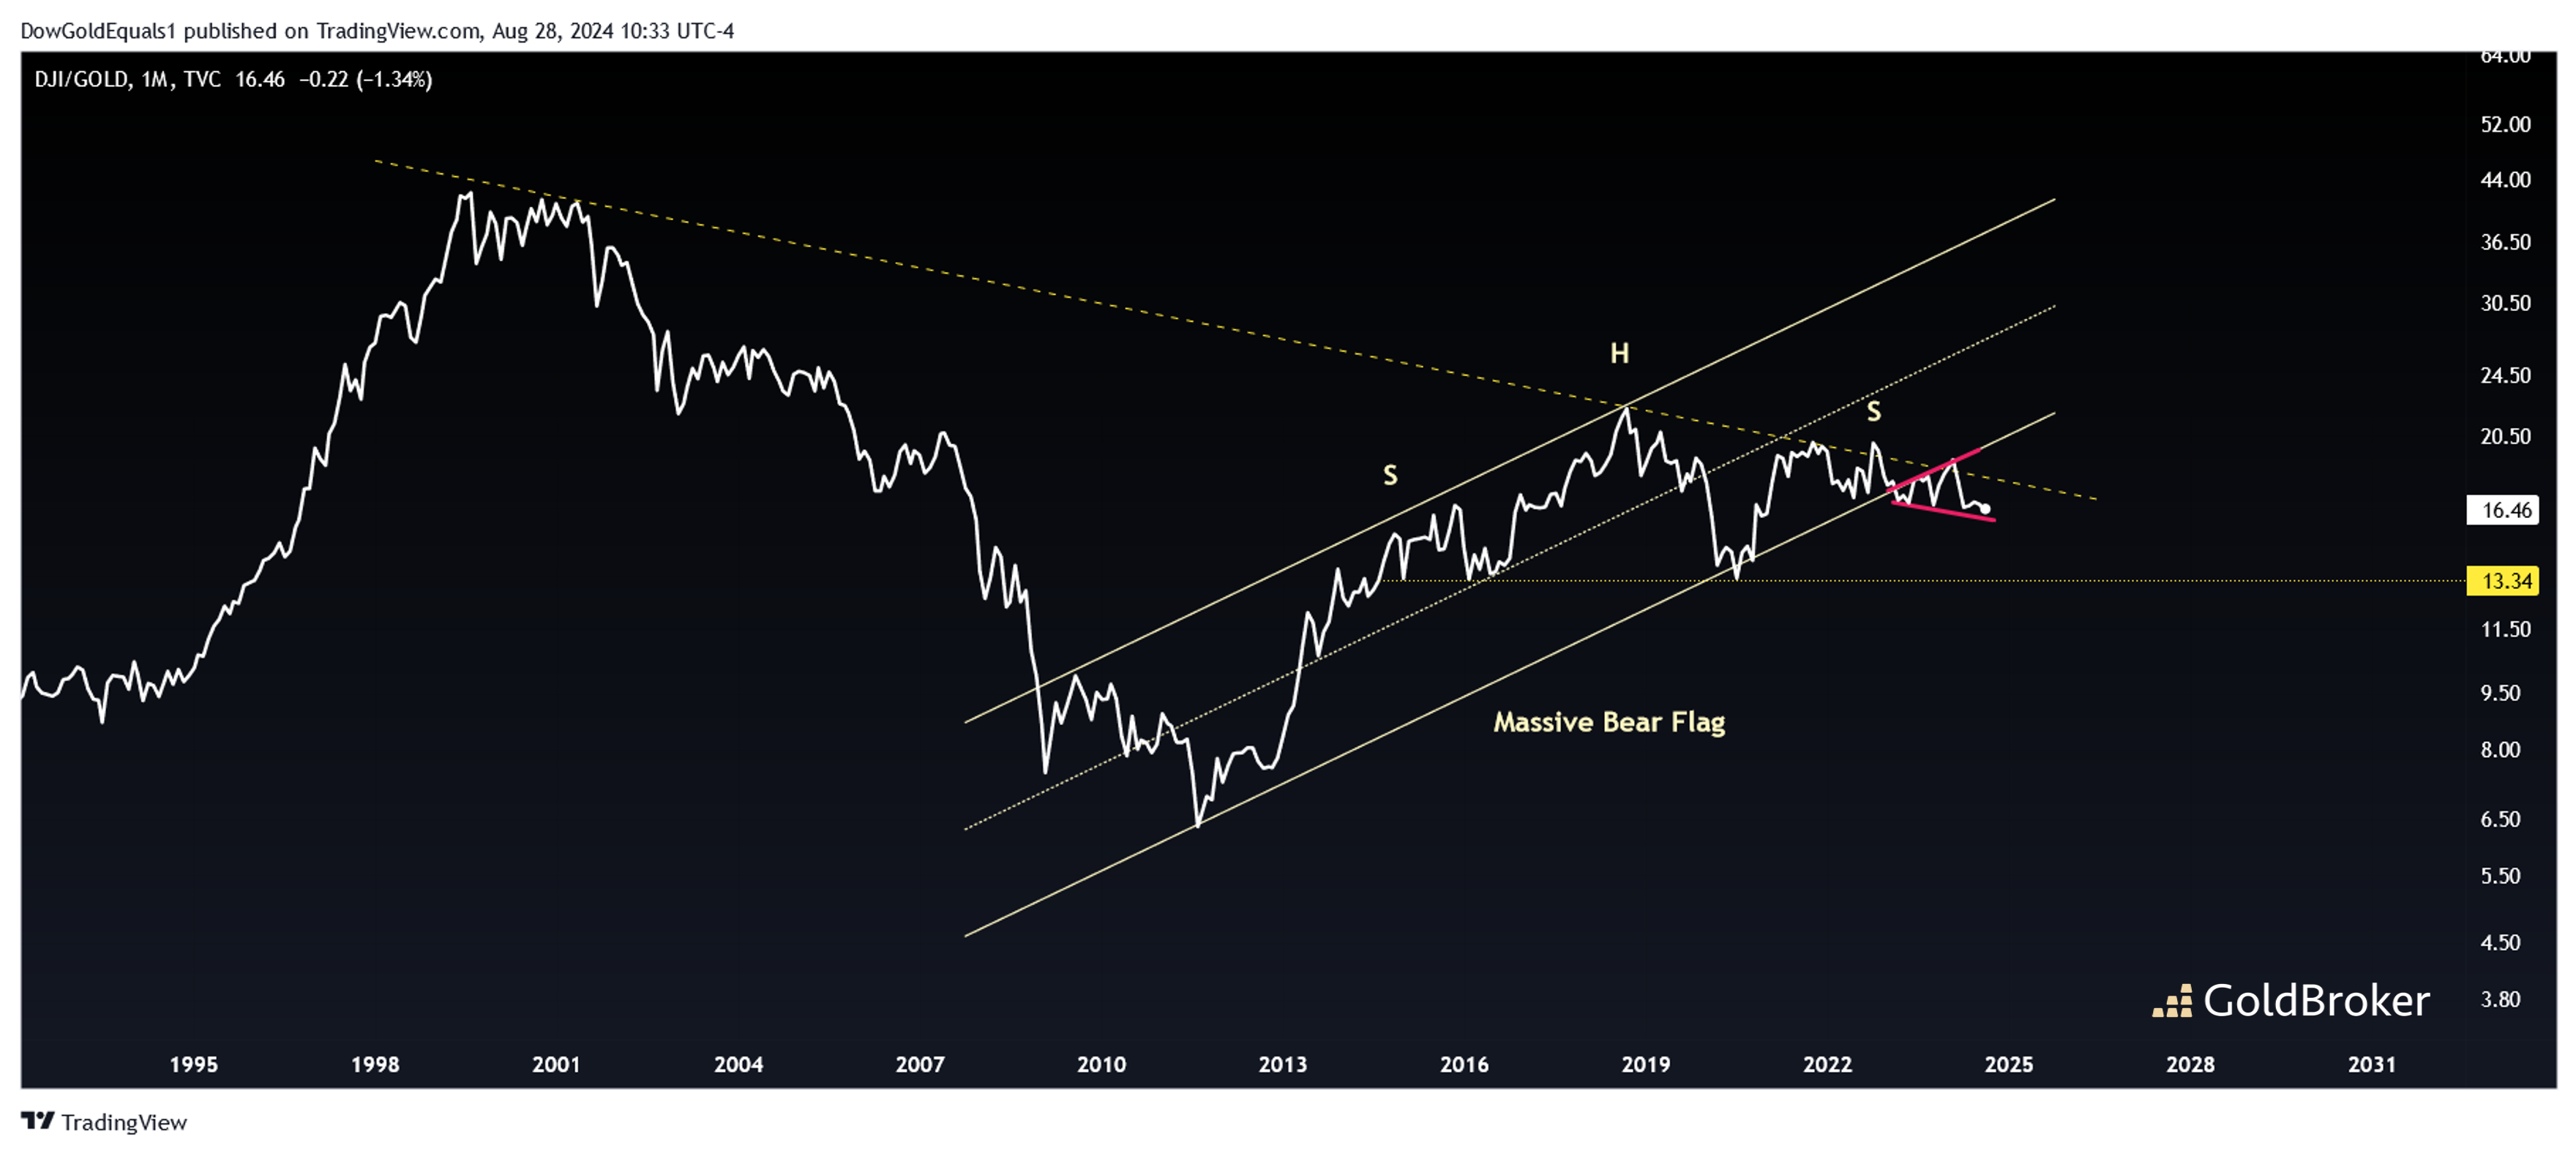
The first chart is a weekly line chart that clearly shows a breakdown from an ascending parallel channel that we identified last year as a potential bear flag. Note the pink consolidation below the channel that shows price was rejected twice as it attempted to re-enter and failed, classic bear action. A break below the pink expanding wedge will likely lead to a test of the Head & Shoulders neckline around 13.34. If the Dow were to stay around its current level near 41,000, gold would be over $3,000 at the Dow/Gold neckline. At 2,500 gold, the dow would drop to near 33,000. Likely, we will see something in between.
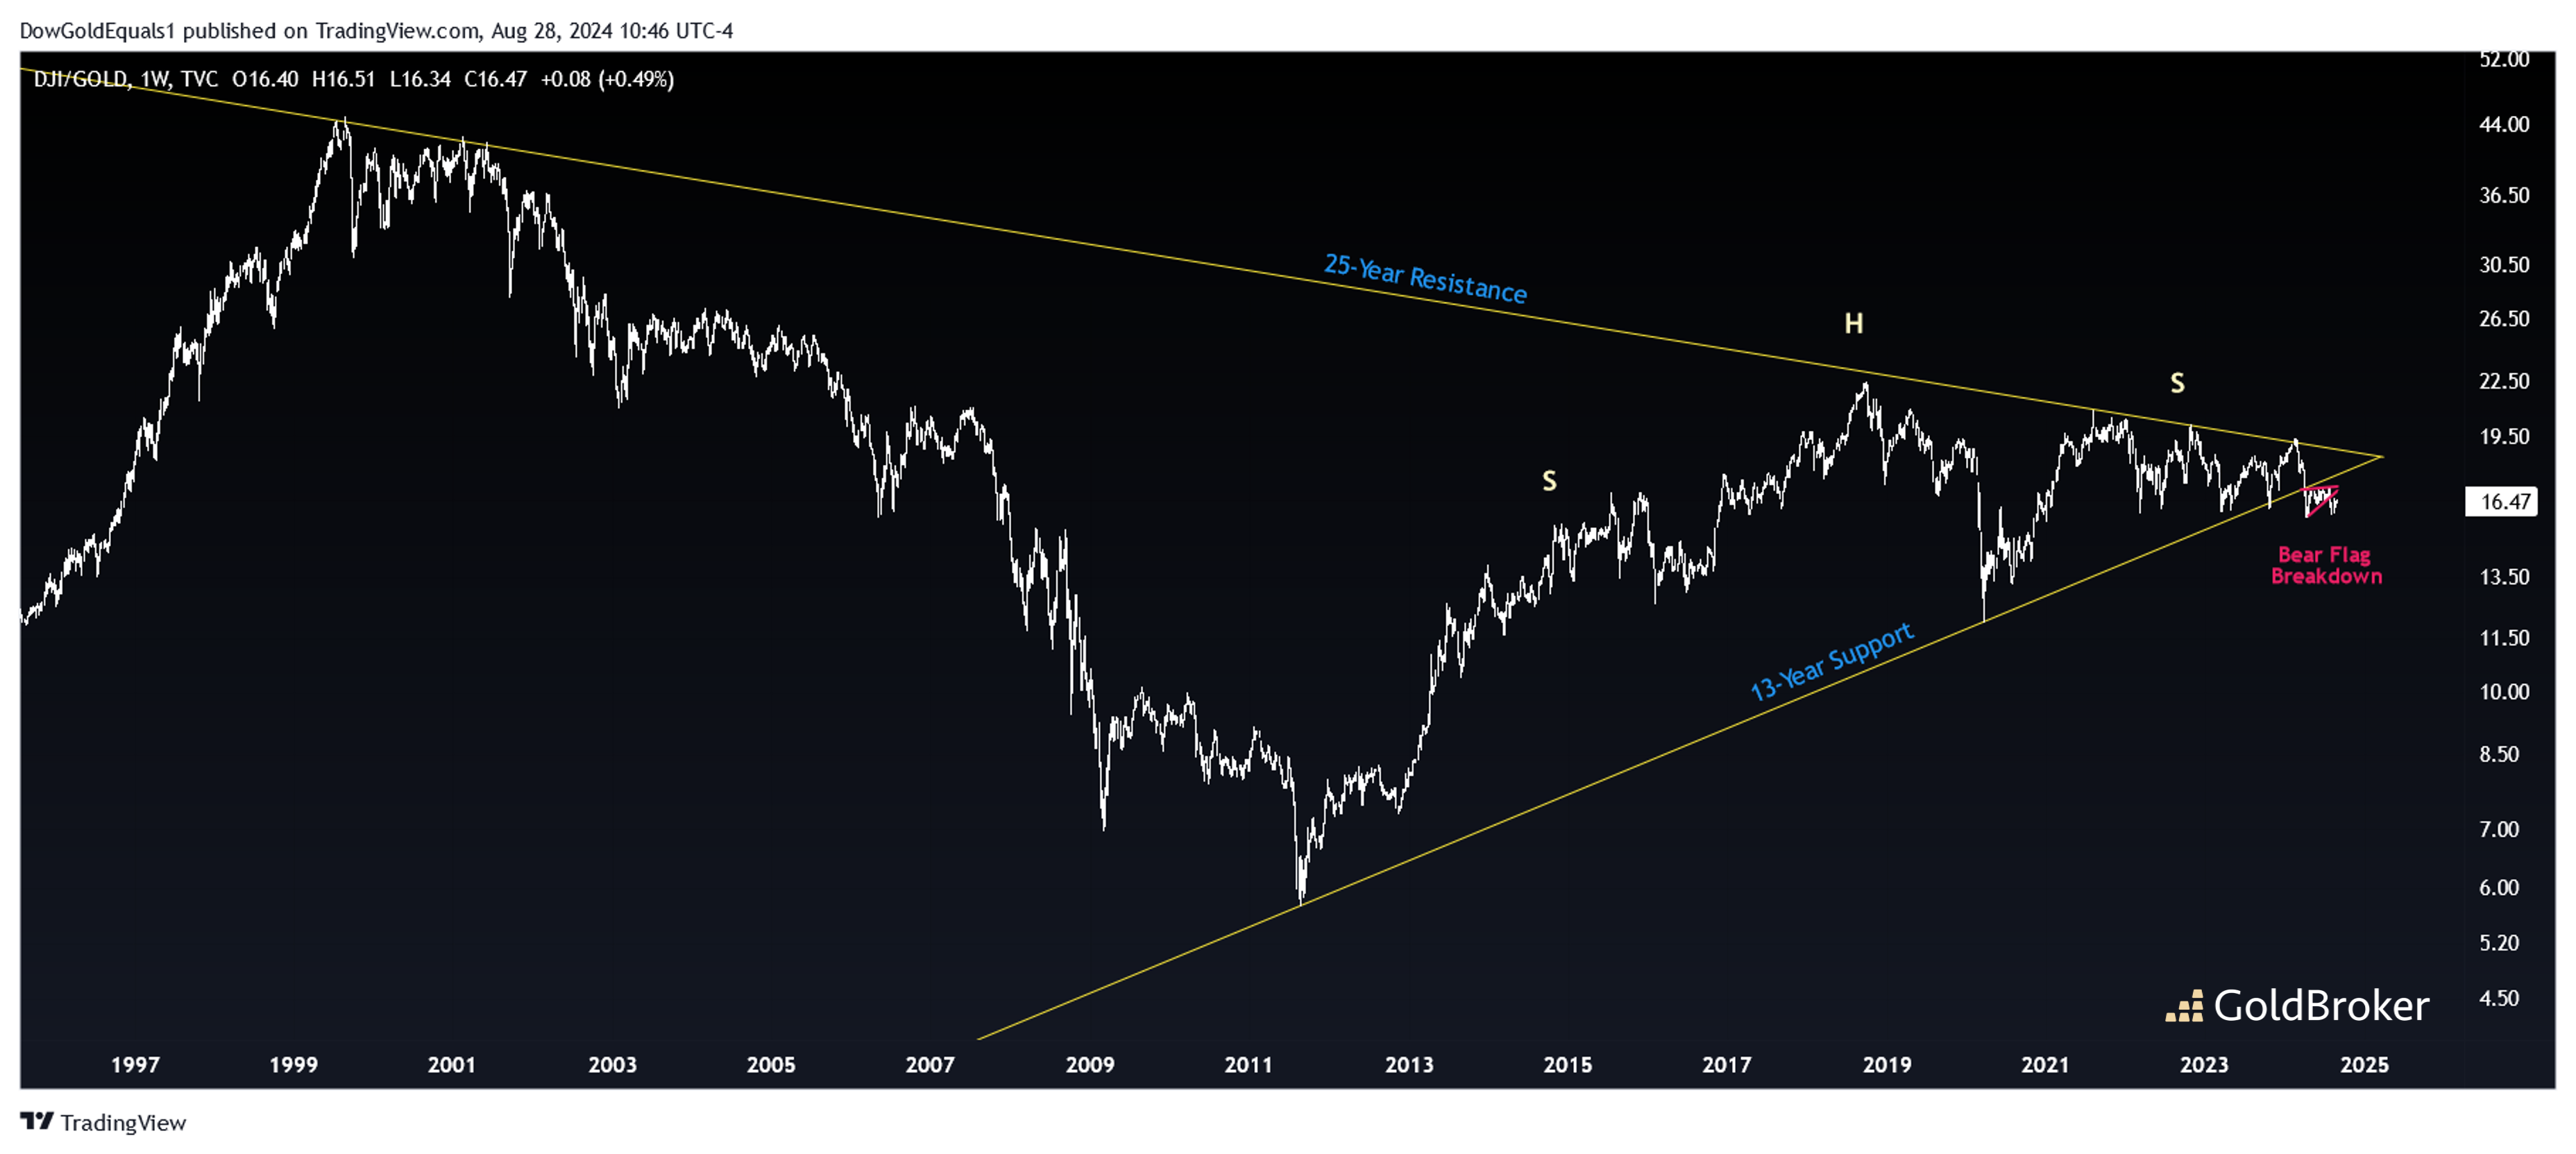
The second chart is a longer range look that highlights just how significant the recent breakdown is. This weekly candlestick chart shows that the breakdown, shown by a tiny pink wedge, has already started to break down. This is happening near the convergence of 25-year support and 13-year resistance! For stock bulls to prevail, the breakdown needs to prove false and rapidly ascend around the apex of this massive wedge. The path of least resistance, however, is down - and given just how much energy has built up since this wedge began forming 25 years ago, the drop is likely to be swift and very deep. For those looking to eventually see Dow/Gold in the single digits, this is exactly the kind of pattern you want to see playing out.
Reproduction, in whole or in part, is authorized as long as it includes all the text hyperlinks and a link back to the original source.
The information contained in this article is for information purposes only and does not constitute investment advice or a recommendation to buy or sell.


