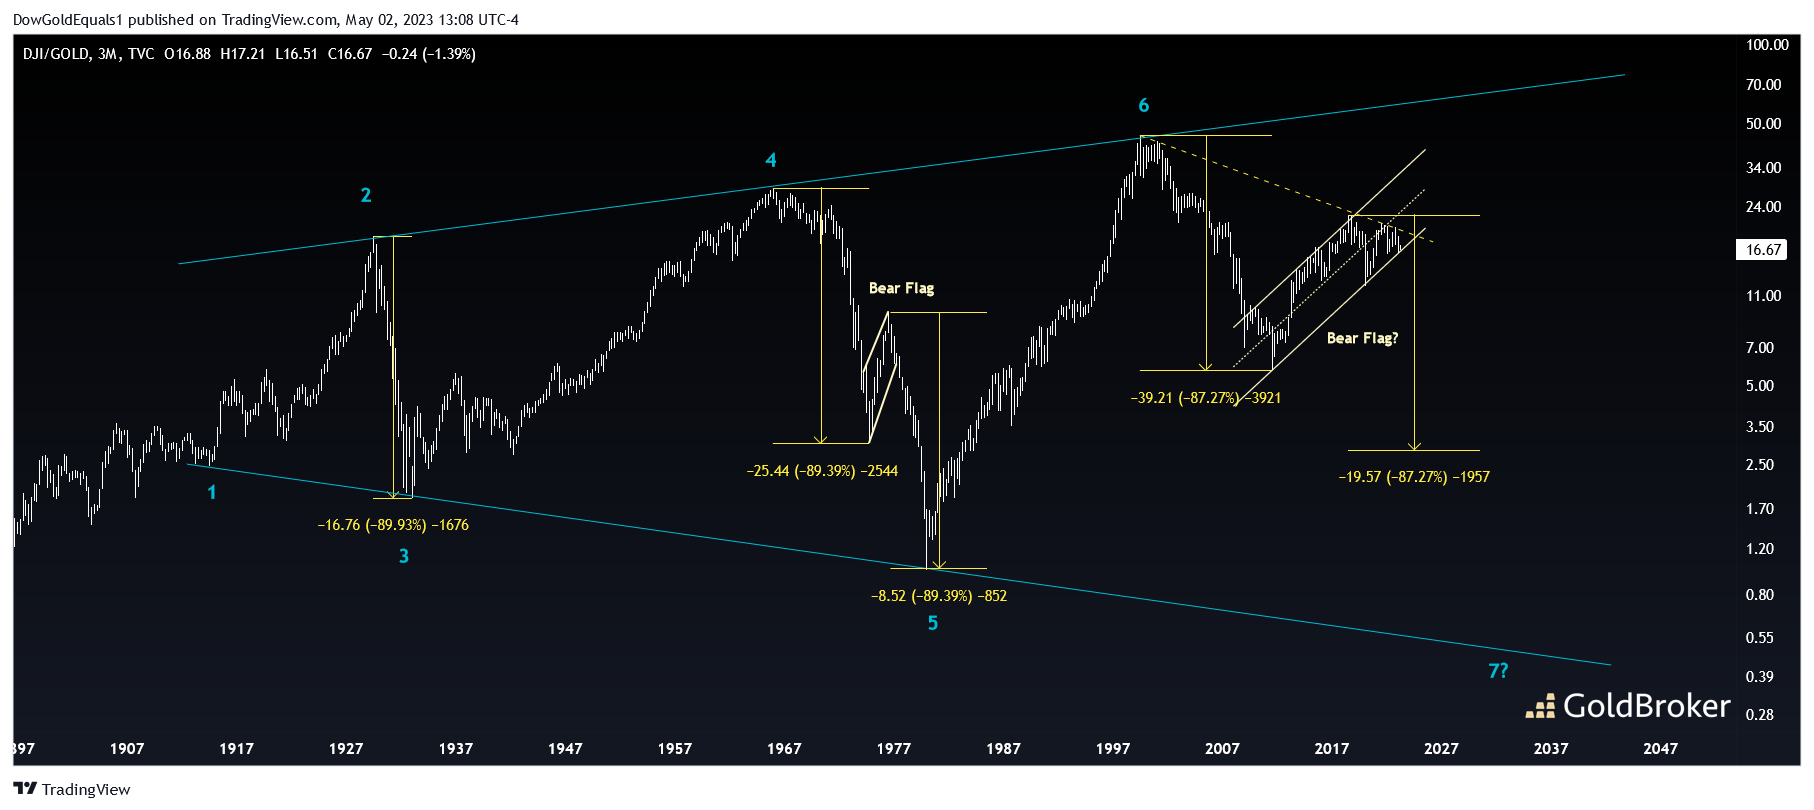
Can the Dow/Gold ratio fall nearly 90% from its top in 2018? The 100-year chart says, "yes!" Dow/Gold has formed a 6-point broadening wedge over the past 100+ years, and within that wedge, the ratio has seen drops of near 90% four other times. The first occurred during the stock market crash of 1929, a time when the price of gold was fixed but the Dow crashed 90%. The second and third occurred between 1965 and 1980, separated by a bear halfway flag. During this time, it was Gold that made the big move - rising from $35 to $875 while the Dow stayed relatively flat. The most recent big crash occurred between 1999 and 2011, as the tech bubble pop and GFC conspired against the Dow while Gold rose from $250 to nearly $2,000.
Dow/Gold currently finds itself testing the lower rail of what may be a large bear flag. If it is a halfway flag, similar to that of the 1970s, the resulting measured move from a breakdown would be below 3. 30,000 Dow/$10,000 Gold? 6,000 Dow/$2,000 Gold? 90,000 Dow/$30,000 Gold? The answer will be determined by what inflation does over the coming years, but one thing seems clear - we are in for some interesting times.
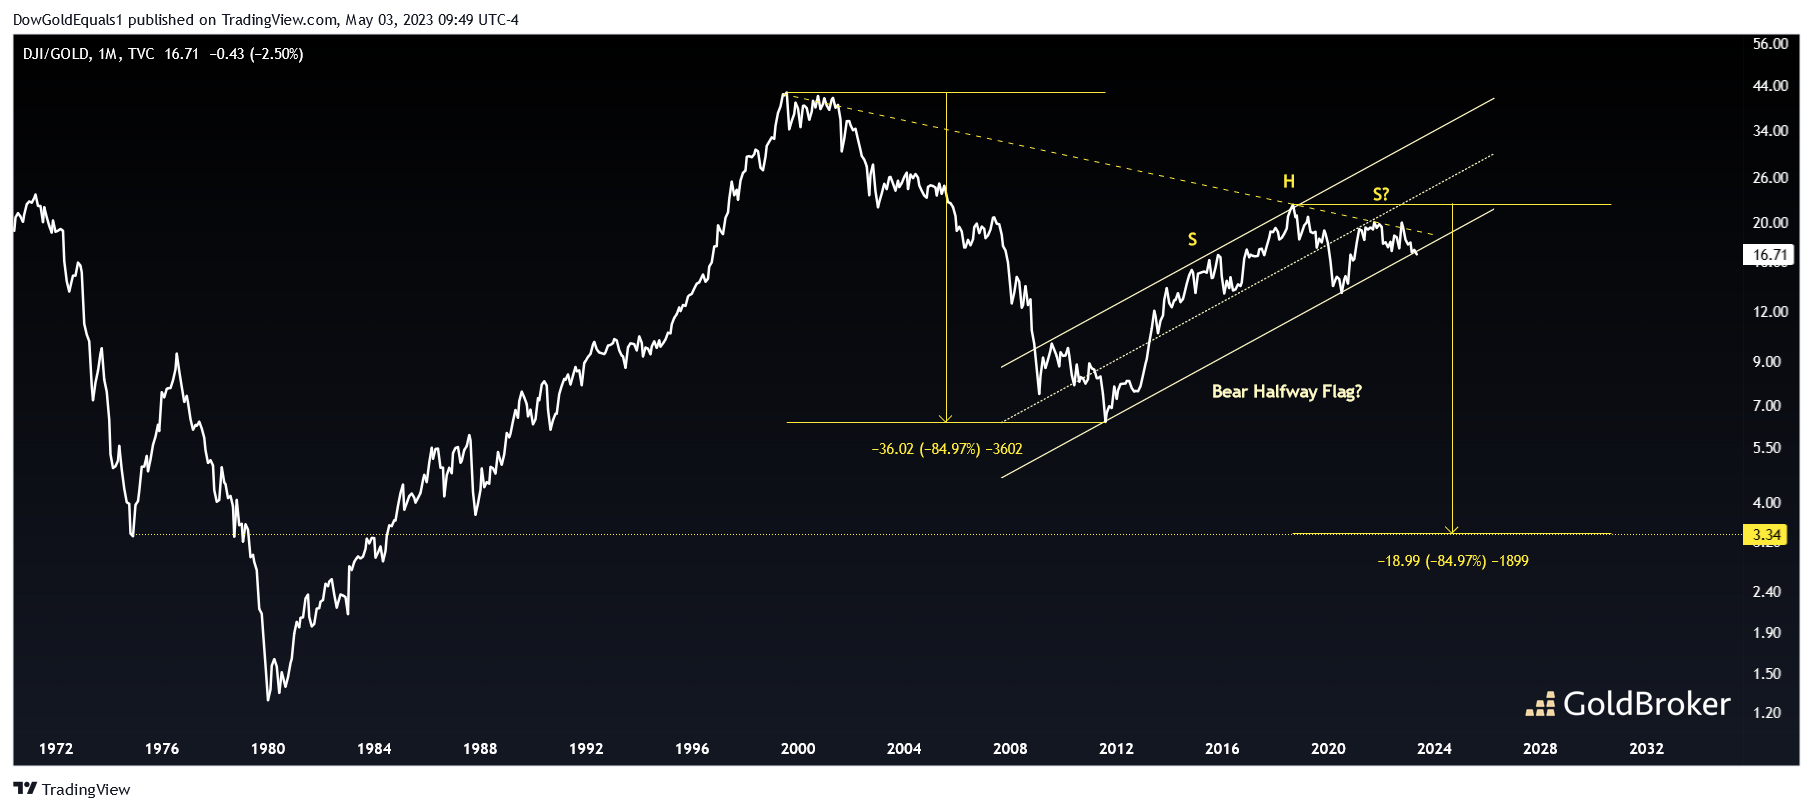
The line chart of Dow/Gold shows us that we're close to confirming a bear flag breakdown on a monthly closing basis. The potential H&S forming within the flag add support to a potential breakdown to come. Keep in mind that this bear flag is more than a decade long, so a breakdown and backtest, if one occurs, could take months to unfold. However, the measured move to around 3 on a closing basis provides a very interesting target - an historically important low set in 1974.
Reproduction, in whole or in part, is authorized as long as it includes all the text hyperlinks and a link back to the original source.
The information contained in this article is for information purposes only and does not constitute investment advice or a recommendation to buy or sell.


