Just last month, on January 6, I showed you a chart of Dow/Gold that suggested we would soon see the ratio begin to plummet. At that time, the ratio was valued at 16.20. Today, that value has dropped below 15!
The first chart we'll look at this week is another view of the Dow/Gold ratio. Note that the ratio has now broken below and successfully backtested an enormous wedge while also putting together a pretty compelling Head & Shoulder topping pattern. We are now seeing a continuation move off of the backtest, which I believe will lead to a waterfall decline into the single digits over the coming years.

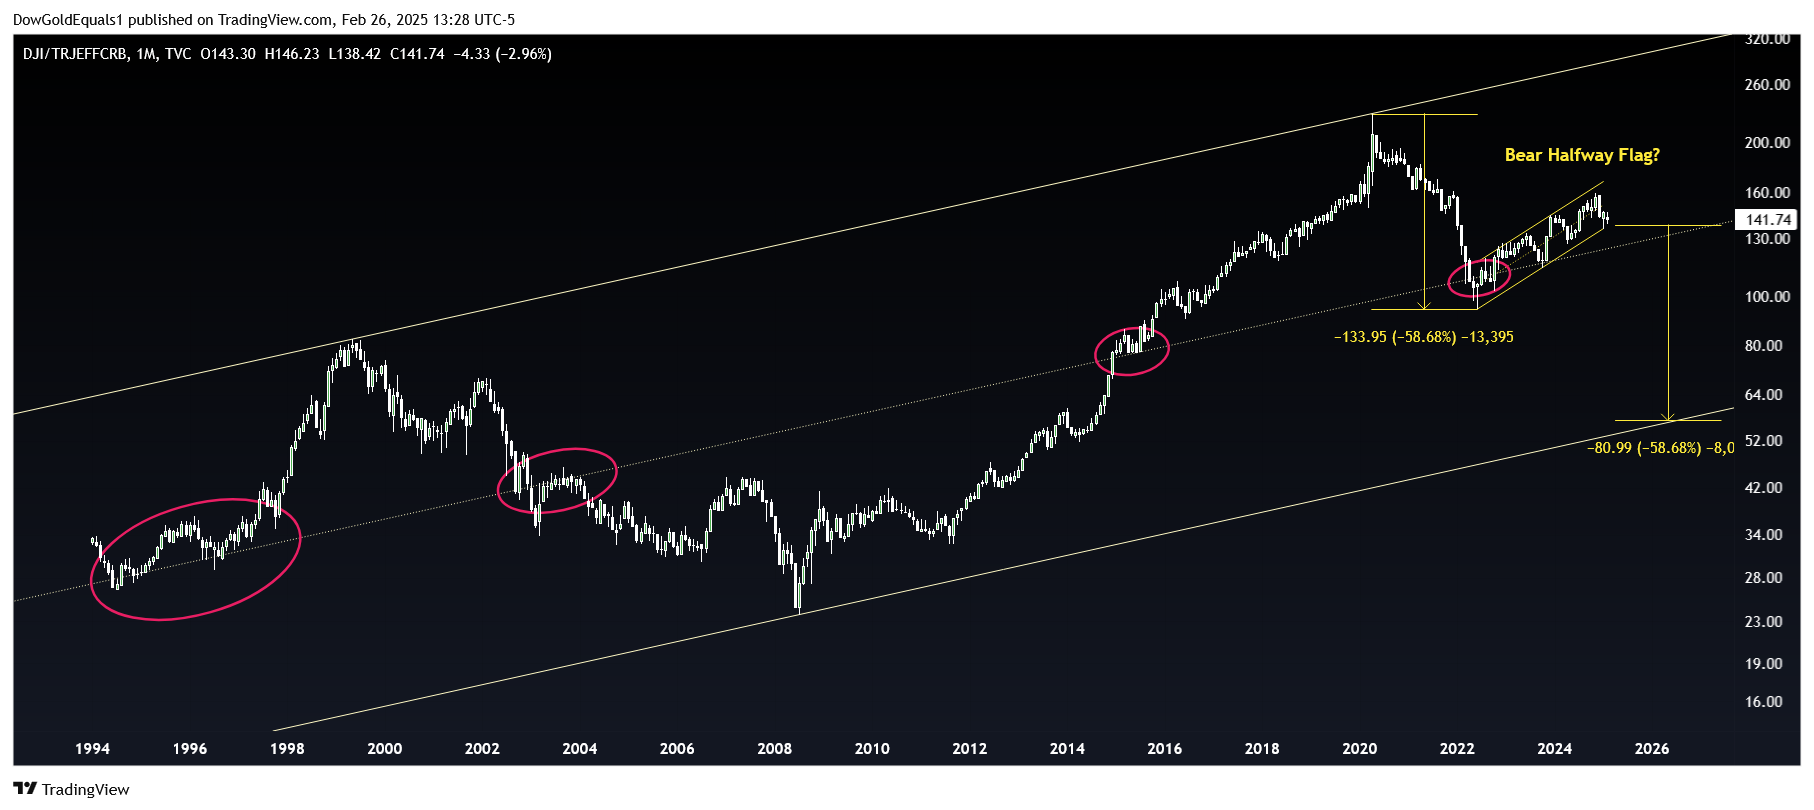
The second chart is a ratio of the Dow/CRB, where CRB is a basket of commodities. This chart will give us a sense of how the Dow performs against real stuff. I have defined this chart as a large ascending channel. While traditional chartists may disagree with that assessment due to the lack of a second touch point along the lower rail, I believe that the midline action shown in pink ovals can help you see a channel coming before you get all the extreme rail touchpoints. The ratio appears to be building out a bear flag, and if it ends up being a halfway flag, we could see a precipitous decline that could indeed give us that second lower rail touch point over the coming years.
Any way you stack it up, it appears that the run in the Dow Jones is out of steam and it is now time to rotate into commodities - namely, gold and silver.
Reproduction, in whole or in part, is authorized as long as it includes all the text hyperlinks and a link back to the original source.
The information contained in this article is for information purposes only and does not constitute investment advice or a recommendation to buy or sell.


