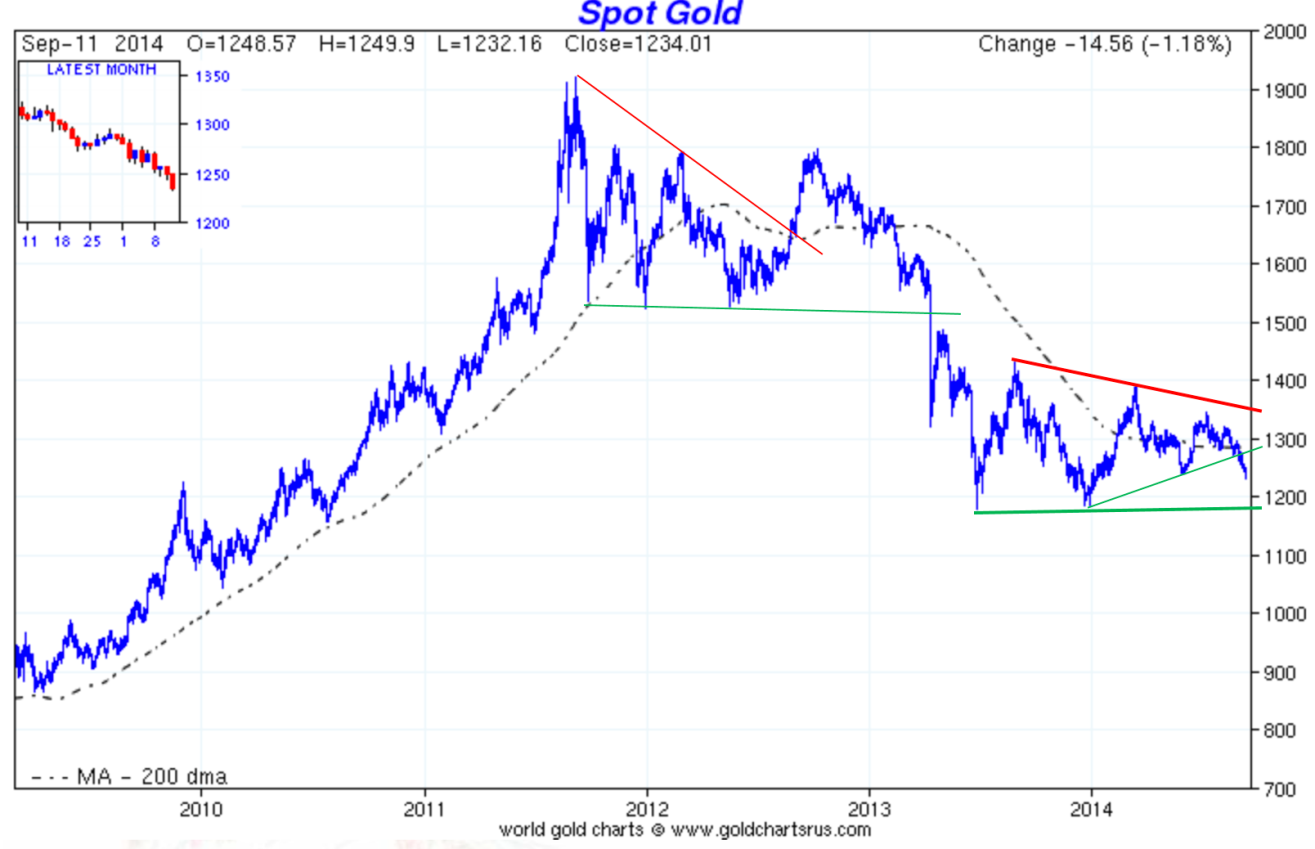
After the original drop in gold price from the top of $1,920 per ounce in 2011 to $1,180 per ounce in 2013, gold has started a sideways consolidation triangle pattern. Is this a correction, or is it just a pause within a move that will retrace the whole move since 2009? What does sentiment tell us?
The gold market is a very opaque one and very hard to analyse. The amount of gold exchanging hands outside the markets is enormous. China seems to continue buying in a very discrete way and shows regularly, through speaches but also actions, that it considers gold at the core of its currency war, mainly with the United States. It’s interesting to notice that, recently, on every attack on the gold price to push it down, once the original move stops, almost every time momentum fails to take gold lower. This pattern doesn’t look to me as a correction into a bear market but more as a bottoming formation.
Chart #1 : Spot Gold
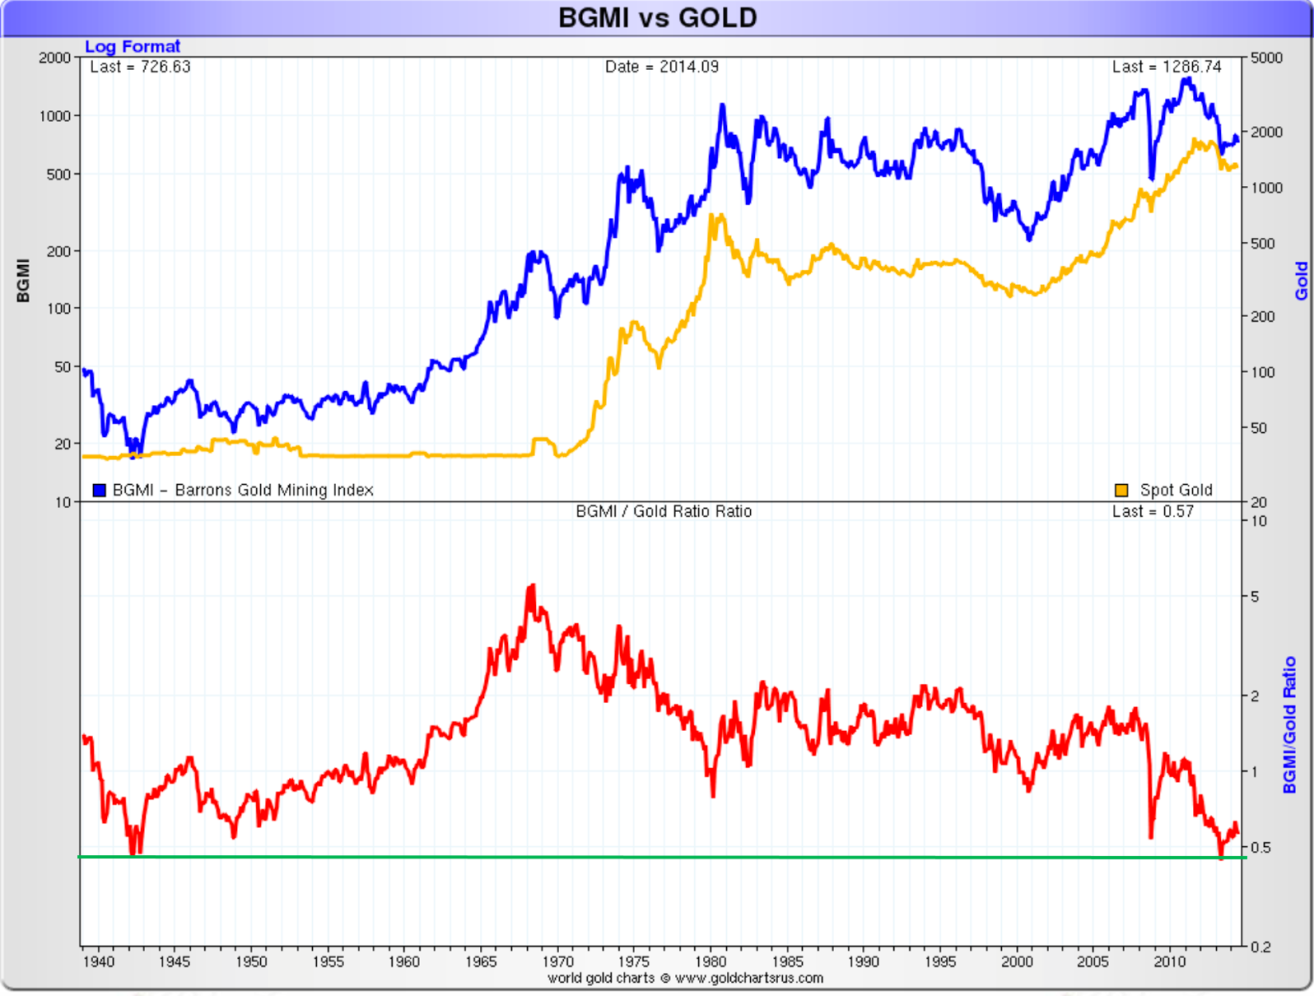
If we also look at the sentiment in the gold mining stocks we can observe that the price of gold mining stocks measured in hard money (gold) has hit a 71-year low (chart #2). Today, you can’t even mention gold stocks to portfolio managers or investors, even less tell them to buy. The only thing missing is those ready to predict that gold is valueless and its price will go to zero, as some predicted when gold hit $250 in the ‘90s. A recent Reuters article was even indicating a possible end to India's historical love affair with gold.
Chart #2 : Barron's Gold Mining Index BGMI vs Gold
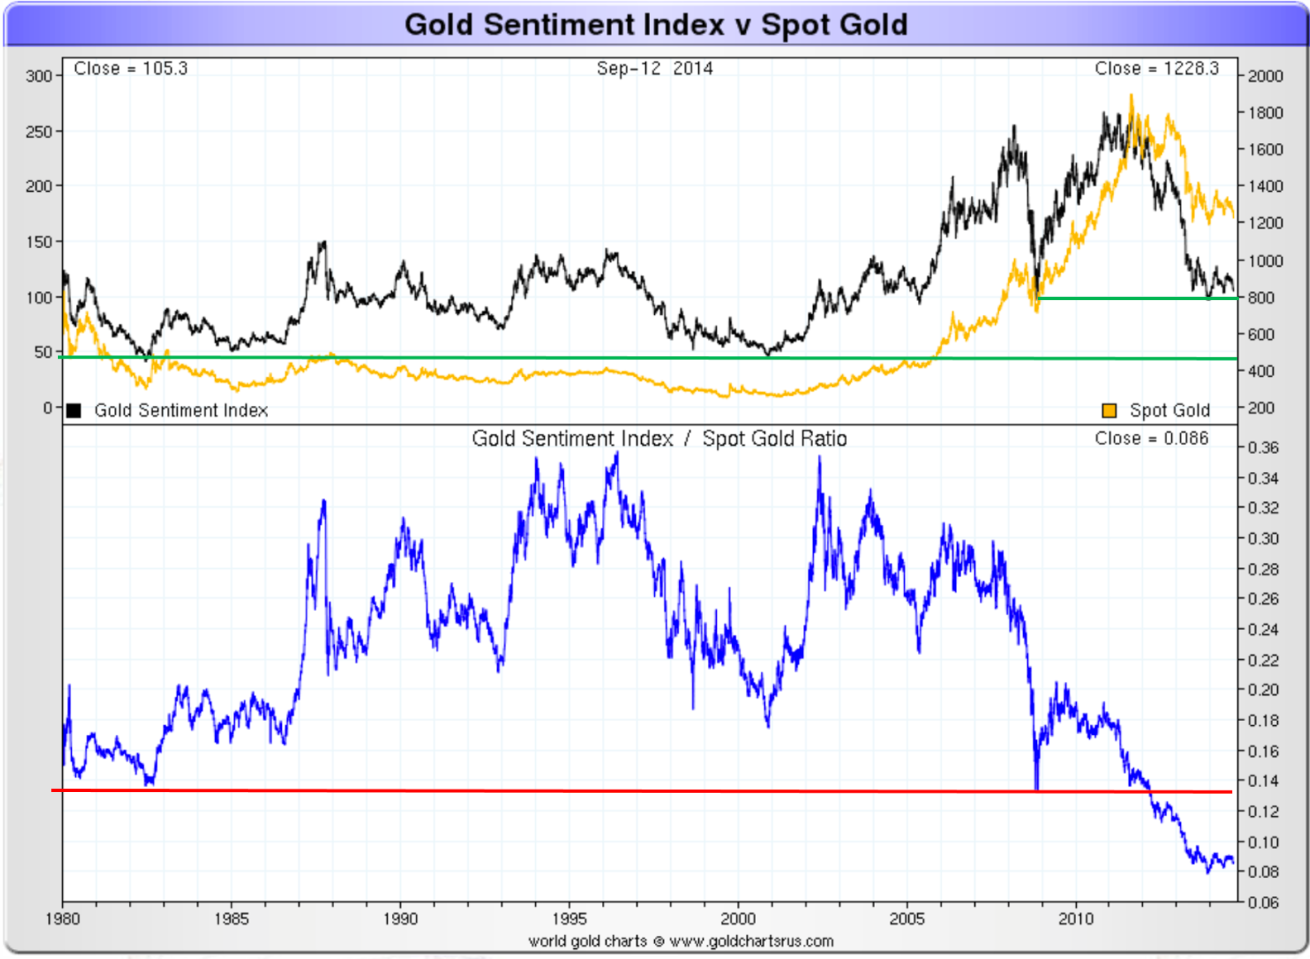
If we also look at the gold sentiment composite index (chart #3) as calculated by Nick Laird, we can also see it has hit the low reached in 2009, and is bottoming out. The index is compiled from datasets of precious metals, gold indices, gold stocks and gold mutual funds and these datasets have been collated from four primary gold producing regions: America, Australia, Canada and South Africa.
Chart #3: Gold Sentiment Index vs Spot Gold
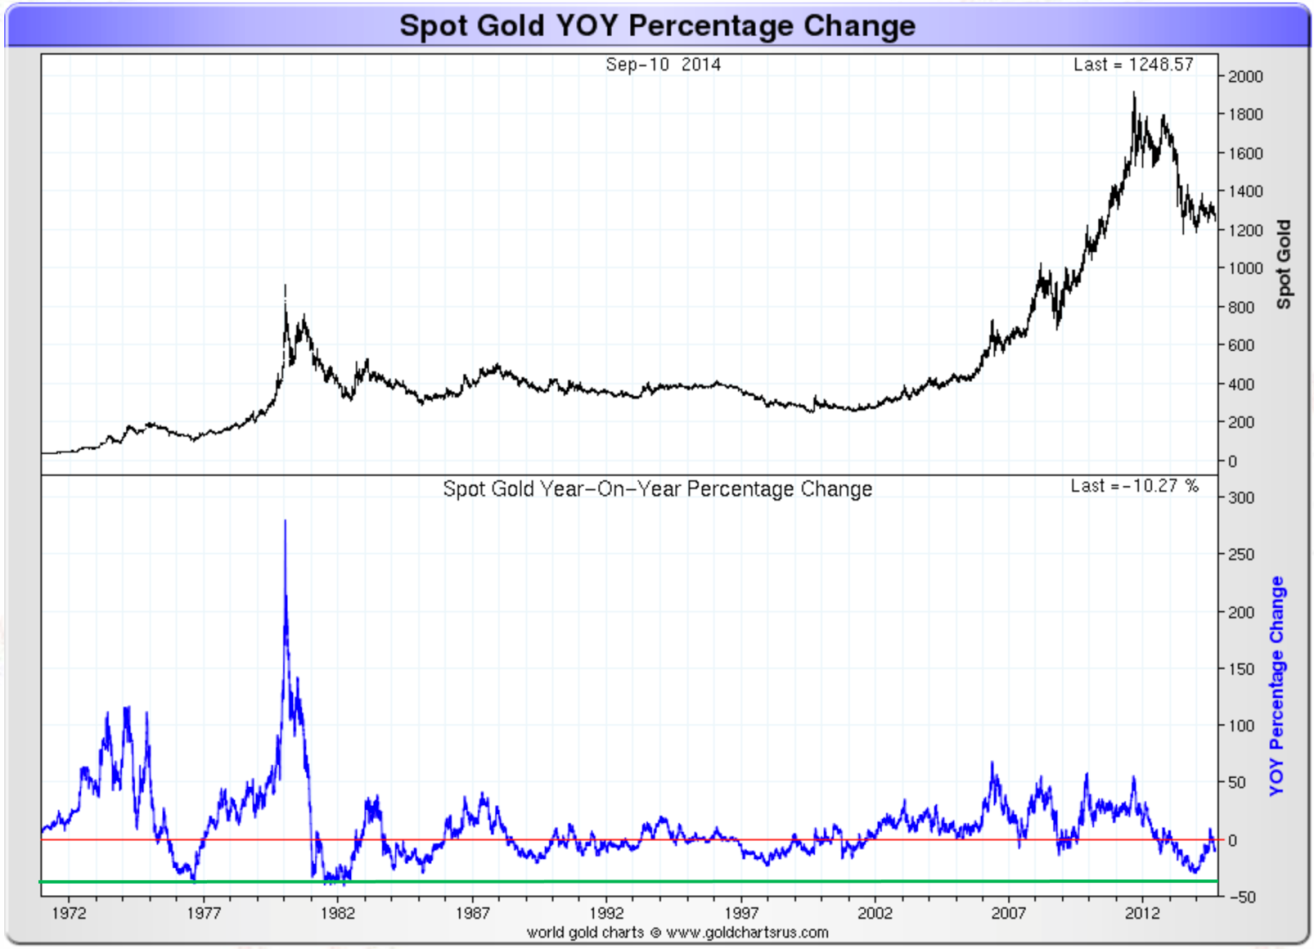
I also like to look at the price acceleration (chart #4) and especially compare it with acceleration during the last currency crisis that ended in the collapse of the Bretton Woods gold exchange standard. As you can see, price acceleration hit a low close to the 35-year low recently and reversed, even moving in positive territory. This comparison with the ‘70s is important for me because I strongly believe we will have an international monetary reset and gold will be part of the new system.
Chart #4: Spot Gold Year-on-Year Percentage Change
With tensions rising in the world and the beginning of a new Cold War, I suspect this triangle pattern is more of a bottoming formation than just a correction within a bear market. The new Cold War is pushing the world more and more, if not into a military World war at least into a trade war. We are already into a currency and gold war. We already see it with the trade and travel restrictions imposed on Russia and the counter actions taken. I expect the sanctions against Russia to fail just as the US sanctions against Cuba have failed, but they will have a major impact on the world economy.
In a recent article in the London Financial Times, John Dizard mentioned that gold’s “popularity as a medium of exchange for international transactions has been soaring, particularly in the past few months, as the impact of US government sanctions on non-compliant banks has become severe.” And that is despite gold being “the most expensive and least convenient of all of the monetary alternatives to the dollar.” I am surprised this article has not attracted more attention, as I think it deserves. Smart money worldwide is already taking action, just as sovereigns like Russia and China are, by slowly, but also very discreetly, accumulating gold.
All this makes me believe we are not in a corrective triangle within a bear market but rather in a bottoming formation. Gold sentiment is not just negative, it is extremely negative, while all the bears in US stocks and the dollar have capitulated. However the breakout from this triangle formation has to be watched very closely. Any move below US$1,200 and, more specifically, $1,180, to which I give a low probability, would require a new look. I have to caution you that a false breakout from a triangle formation to the downside is still possible, as it happened in 2012 (see chart #1) at the top, followed by a reversal. In manipulated markets, traditional instruments, either technical or fundamental, have to be looked at with caution and gold is, in my view, one of the most manipulated.
You can also read an addendum by Acting Man > "More on Gold Sentiment"
Reproduction, in whole or in part, is authorized as long as it includes all the text hyperlinks and a link back to the original source.
The information contained in this article is for information purposes only and does not constitute investment advice or a recommendation to buy or sell.


