Roy W. Jastram, in his book, The Golden Constant, says, “When we go so far back into price history as I do here we are like the archeologist. We nurse together the evidence that has survived with as much test of its validity as is available to us. Statistics, like archeology, is an inexact science when practiced on numbers that are remote and fragmentary.”(1) This should always be kept in mind when analyzing economic data of any kind.
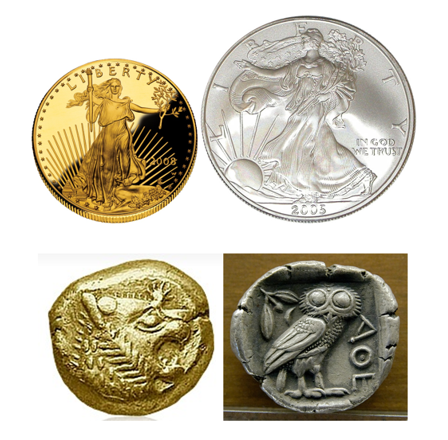
Just when they announced the end of gold and silver in 2000, both started shining again. It seems that it is not the death of gold and silver as money that will happen, but rather the death of fiat money. For more than 2,000 years, gold and silver have been used as money under different forms and have outlived any other form of currency (graph #1). We should not ignore also Dr. Copper. Gold and silver are called the eternal monetary couple, but I would also add copper and call it the eternal monetary trio.
Chart #1: International Reserve Currencies since 1400
In his book, The Power of Gold, Peter L. Bernstein says, “Gold may again serve as the ultimate hedge in chaotic conditions. Its return to its traditional role as universal money is unlikely, however, unless the time should come when the dollar, the euro, and the yen have all failed to function as acceptable means of payment across international borders.”(2) He wrote the book in the late ‘90s and published it in 2000, when the US dollar was at its apogee. It seems that what he did not expect but cautioned against is happening now. The whole international monetary system is barely kept alive and is on the verge of a total collapse, followed by a reset. Now, that is not the end of the world no more than the collapse of the pound Sterling was in the ‘40s. The collapse of the US dollar standard is only the beginning of a reset, whatever the form the new system will take. Until then gold and silver will outperform.
I cannot stop looking at the next two charts and ask myself how this parabolic move of inflation can go on for much longer. This is not natural. Maybe it can go to infinity in the imaginary world of economics that economists call “nominal”, but in the real world that we actually live in, it just cannot. Infinity in mathematics is not a real number, but rather an undefined large quantity. You cannot go to infinity in the real world. What is also striking in Jastram’s gold and silver charts since 1500 is the volatility in the real price of gold and silver that was introduced when paper money replaced hard money. Parabolic moves always end badly. It would actually be more correct to plot the pound Sterling in gold and silver. This would show a parabolic collapse of the paper British pound rather than an increase in the value of gold and silver.
Chart #2: Jastram’s UK Price of Gold, UK Wholesale Prices and the Purchasing Power of Gold
Chart #3: Jastram’s UK Price of Silver, UK Wholesale Prices and the Purchasing Power of Silver
In the next two charts, we can see that the price of gold and silver in nominal US dollars has surpassed the top of $850 for gold and $49 for silver reached in 1980. Gold’s price reached a top of $1,900 in 2011. However, silver has barely crossed its 1980 top, confirming gold’s breakout.
Chart #4: Price of Gold in Nominal US Dollars
Chart #5: Price of Silver in Nominal US Dollars
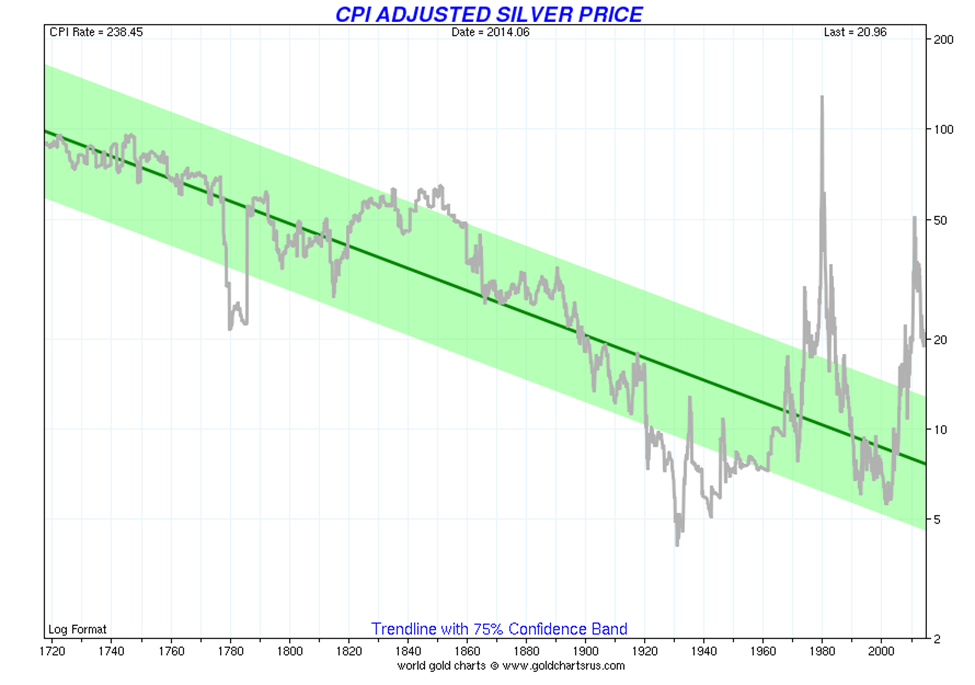
If we look now at the price of gold and silver adjusted for official inflation, as reported by the US government, we see that both gold and silver never reached the highs of the 1980s.
Chart #6: Price of Gold in Real US Dollars Adjusted for Official Inflation
Chart #7: Price of Silver in Real US Dollars Adjusted for Official Inflation
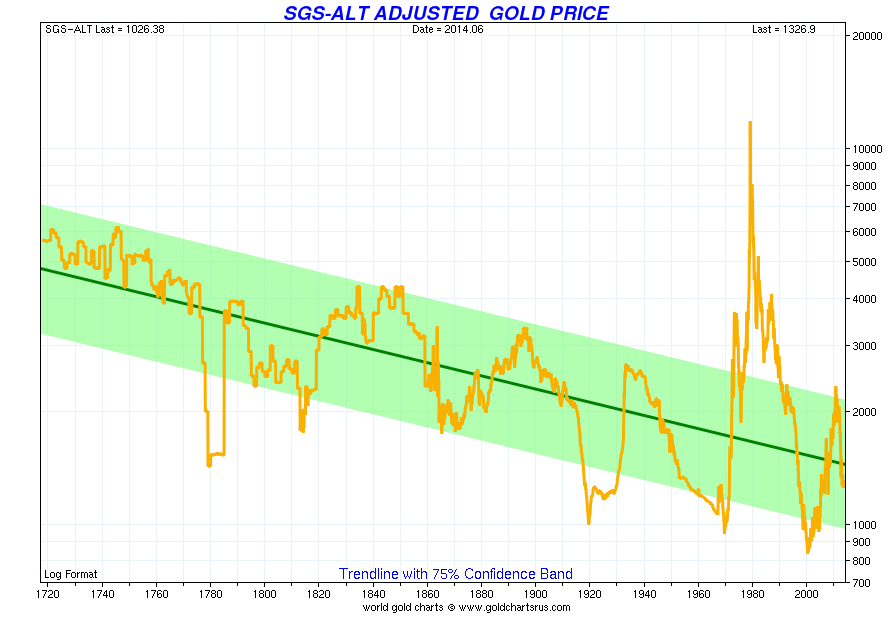
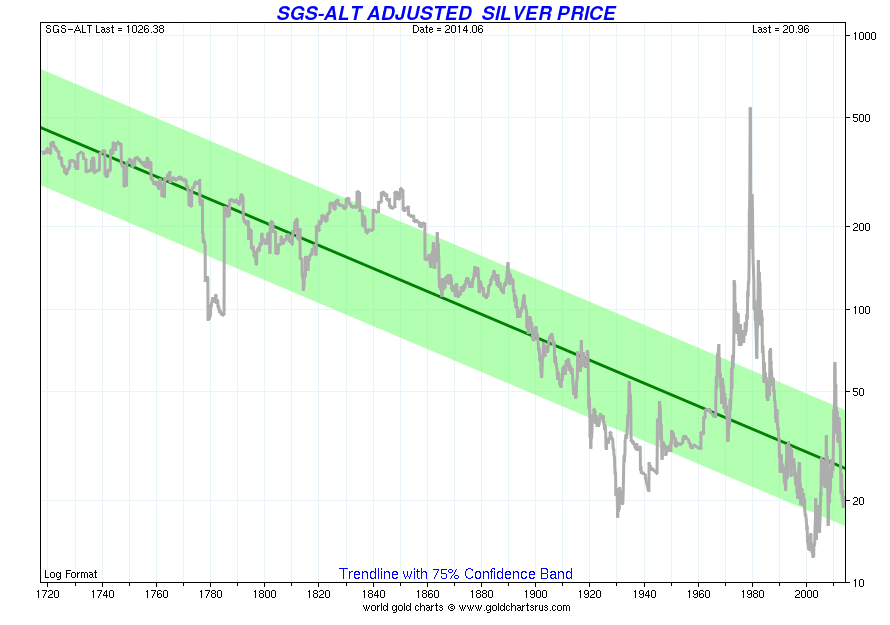
However, we must remember that the US government has modified the calculation of inflation so it will underestimate the actual inflation. John Williams of ShadowStats has recalculated inflation under the old formula, and we can observe in charts #8 and #9 that, under these adjustments, it is evident that, in 2011, gold and silver never reached the bubble levels of the 1980s.
Chart #8: Price of Gold in Real US Dollars Adjusted for ShadowStats Inflation
Chart #9: Price of Silver in Real US Dollars Adjusted for ShadowStats Inflation
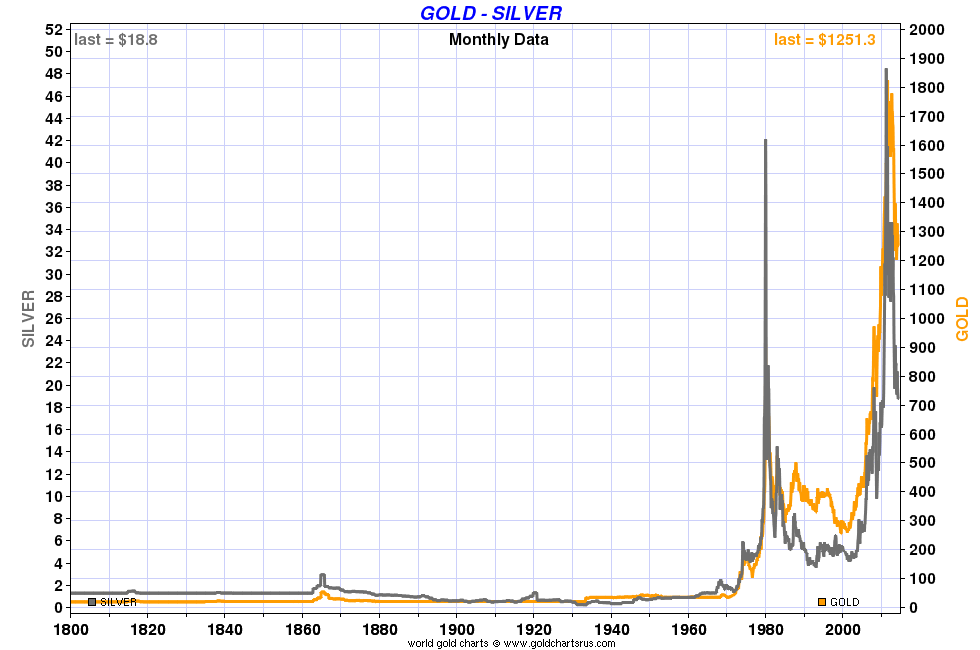
By every calculation, it seems silver is undervalued with respect to gold; but will it remain undervalued? Is gold going to give the signal of the new leg up in this secular bull market, or is silver? I always believed that what would trigger the next leg up in both gold and silver is the collapse of the US dollar and a major international currency crisis and that, irrespective of deflation or hyperinflation. In such an environment, I expect gold to lead since it is still money in extremis, but silver will outperform. Gold has remained, after all the efforts to eliminate its more than 2000-year role as money, the ultimate money. Alan Greenspan, past Chairman of the US Fed, said gold is ‘money in extremis’. Silver, as poor man’s gold, will follow gold. Yes, silver today is no more a monetary metal but rather mostly an industrial metal, but the recent monetary crisis in 2008 showed that silver, like gold, has not lost its historical role of real money and poor man’s gold. More recently in India, when the government introduced restrictions on gold, the demand for silver exploded. Graph #10 also shows a very close correlation between gold and silver priced in US dollars that continued after being demonetized. However, I expect its industrial demand to fall as its price accelerates. Which will dominate? Is the demand for its monetary role increase more than its decrease in industrial demand? That is the question. I personally think its monetary aspect will largely exceed its fall in industrial demand.
Graph #10: Gold and Silver Prices Since 1800
I always like to measure the value of everything in gold because this takes out most, but not all, of the distortion created by inflation. Since silver was demonetized, it makes sense to me to price silver in gold terms. If we do this, then we can see that since silver was demonetized it has dropped quite a bit when priced in gold. In The Power of Gold, Peter L. Bernstein says, “Gold may again serve as the ultimate hedge in chaotic conditions. Its return to its traditional role as universal money is unlikely, however, unless the time should come when the dollar, the euro, and the yen have all failed to function as acceptable means of payment across international borders.”(2) One of the greatest fundamentals I believe for gold and silver, and it is coming fast, is the eventual collapse of the US dollar. The demise of the dollar started in the ‘60s and forced President Nixon to end the convertibility of the dollar into gold. The linking of the price of oil to the US dollar bought some time for the dollar but what we will witness in the very near future is the conclusion of the crisis started in the ‘60s. Unfortunately, the United States did not use this extra time to clean up its finances but, on the contrary, worsened them. Not only did the US debt exploded, but also the world’s debt. This is unsustainable and we are getting very loud signals that we are very close to the end.
Graph #11: Silver Priced in Gold
Will the gold/silver ratio return to the historical level of 15? I doubt it. However, in the latest Gold and Silver Basis report from Fekete Research (4), Sandeep Jaitly believes that the recent outperformance of silver against gold is likely to continue.
Graph #12: Gold / Silver Ratio
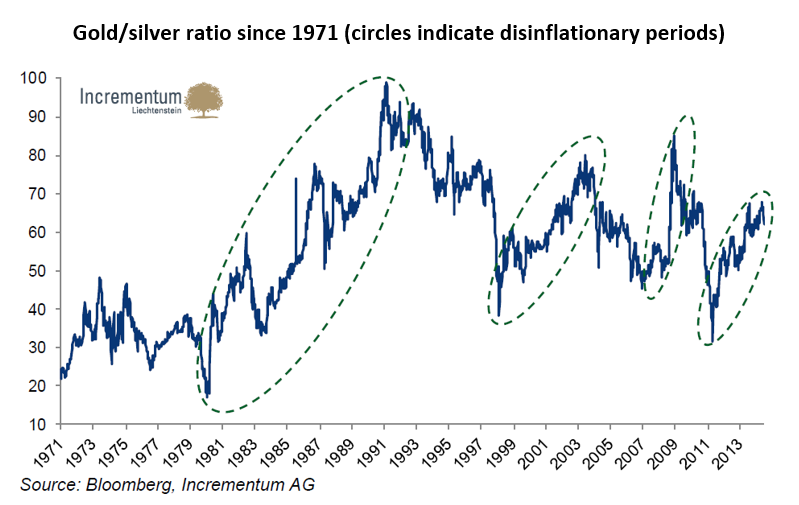
In an excellent annual report on gold, In Gold We Trust 2014, 8th ed. (3), Ronald-Peter Stoeferle and Mark J. Valek describe the gold/silver ratio as an excellent indicator for the interaction between inflation and deflation. The authors believe you can even refer to the gold/silver ratio as the “deflation/reflation” ratio. With silver being mostly an industrial metal today and gold mostly a monetary metal, this makes a lot of sense. This works only since 1971 because, before that, both gold and silver prices in fiat currency have been fixed. In the US, gold was fixed until 1971, and silver until 1973.
Graph #13: Gold/Silver Ratio Since 1971
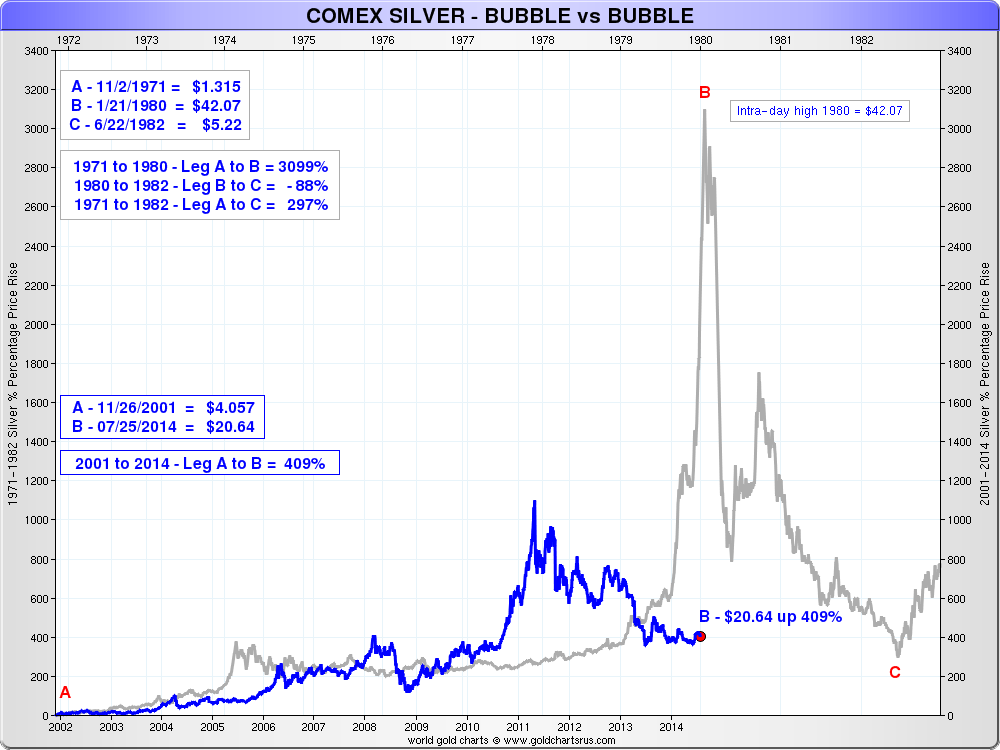
A repeat of the ‘70s would look much like graph #14. In the ‘70s, both gold and silver followed the bubble pattern perfectly. I expect to see a repeat of the ‘70s but I do not expect a retracement as big as in the ‘80s because if we have an international monetary collapse and a reset, then a floor under the price of gold will be set. The blow-off phase will stop much higher than it did in the ‘80s.
Graph #14: Gold and Silver – Gold and Silver Bubble 1980
Graph #15 shows where we are with respect to a typical bubble model. It looks like we are at the end of the awareness phase and just before the start of the mania phase. My expectation is that the blow-off phase will take gold to around US$5,000, with a similar move by silver. It would correspond with the reset of the international monetary system and a return, in some form, of gold in the official monetary system.
Graph #15: Gold and Silver – Future Potential Gold and Silver Bubble
As Roy Jastram says it in my introduction, we have to be cautious when extrapolating the past into the future using statistical analysis based on incomplete information, but we can certainly look at it as a guideline. History does repeat. Ignore history at your own perils. The current international monetary system is flawed, and the question is not if, but when and how soon it will collapse. I believe we are very close (within maybe five years at the most) to the end.
If we dare to speculate and assume a repeat of the bubble of the ‘70s in gold and silver, and if we extrapolate it to the current gold and silver bull markets, we can then see, in charts #16 and #17, that the bubble phase is still to come. In that case, a possible price of $5,000 for gold and $150 for silver are not that far-fetched.
Graph #16: Gold – 1980 Bubble vs Potential Bubble
Graph #17: Silver – 1980 Bubble vs Potential Bubble
Bibliography:
-
The Golden Constant, Roy W. Jastram
-
The Power of Gold, Peter L. Bernstein
-
In Gold we Trust 2014, Ronald-Peter Stoeferle & Mark J. Valek
-
Silver: The Restless Metal, Roy W. Jastram
Reproduction, in whole or in part, is authorized as long as it includes all the text hyperlinks and a link back to the original source.
The information contained in this article is for information purposes only and does not constitute investment advice or a recommendation to buy or sell.
