Below is a technical analysis of gold. Please don’t shoot the analyst.
As you know, several factors could counter this trend that seems to have started, and I may be wrong. I would even say I’d be glad to be wrong.
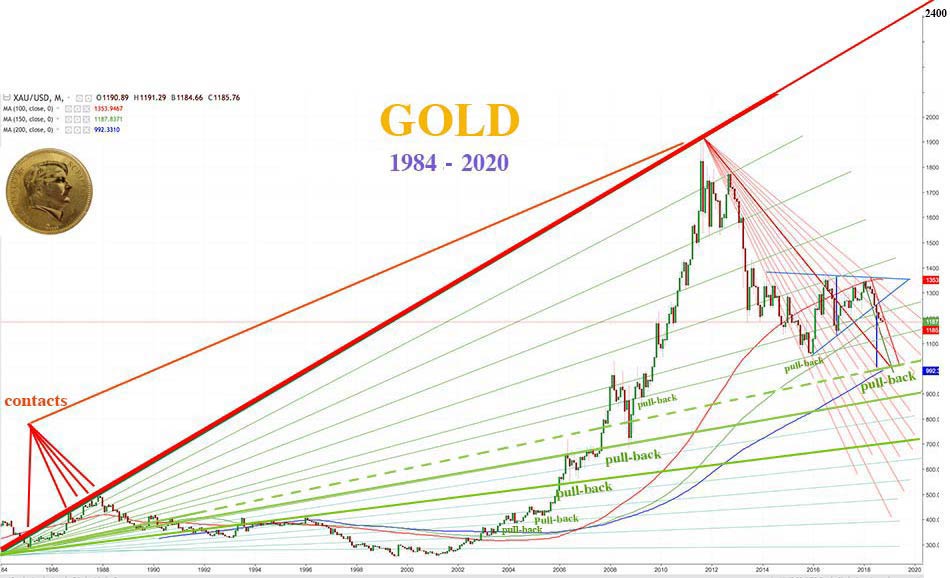
First, here is a big picture of the gold chart in US dollars, on which we can see Fibonacci fans radiating since the start of the bull market.
Curiously, we can see on this chart that the bull market started in 1984. There has been an upward push of gold, along with resistance that stopped its rise five times between 1984 and 1988, and that was tested again in 2011. The other Fibonacci fans of this rise initiated in 1984, have also been usedsince then.
If you look at the bullish rally that followed the severe decline in price in 2008, there is a fan (dotted line) on which there has been no pullback in 2008.
I think we’re going to get this pullback in the leg of decline to come, in order to better consolidate the rise that will follow.
The big resistance should probably be tested in the coming months, in 2019 or 2020, around $ 2,400.
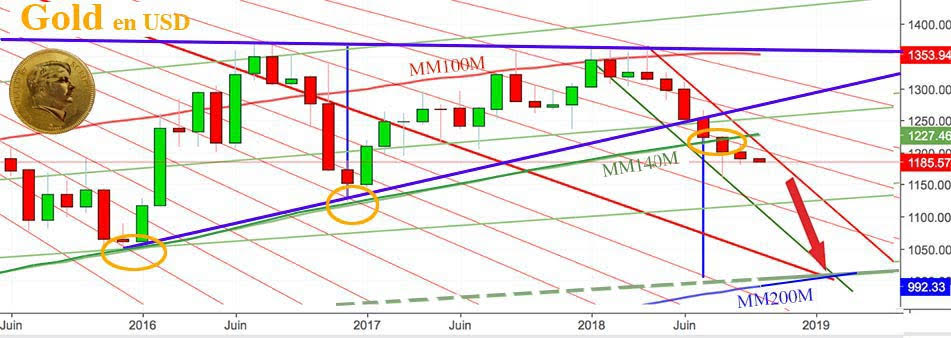
On the graph below, we can see the 100-months moving average (100mMA) has acted as resistance six times since August, 2017.
The 140mMA has acted as support in December, 2016 and November, 2017, but it has been broken last July.
We have to admit that the 200mMA, at the end of the year, will be superimposed with this Fibonacci fan, on which there has been no pullback in 2008 and 2009.
The 200mMA and the fan will be exactly at the same level that the one pointed by the height of the triangle, from which we got out downward.
There are thus three good reasons to think that gold will decline toward $1,000 at the end of 2018 or in the early weeks of 2019.
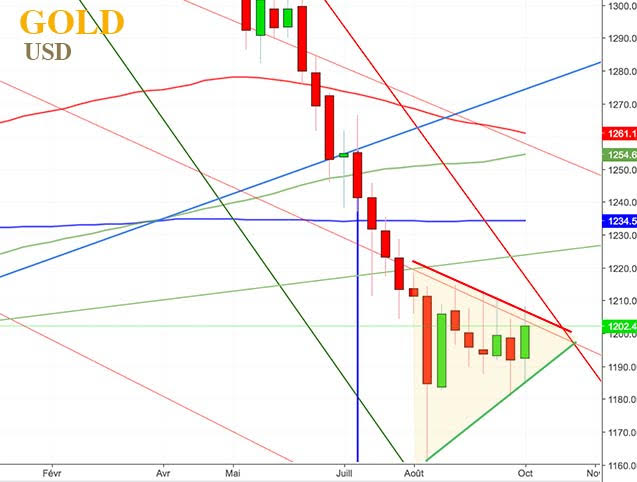
If we take a look at the weekly gold chart, we can see the obvious formation of a pennant flag.
Fourth good reason...
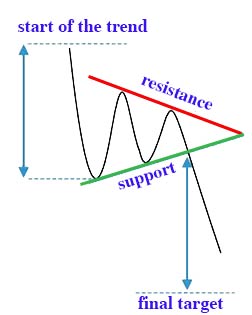
You will find the definition of a pennant flag here.
Since gold started declining from $1,335 on April 23, the spot price lost $174 until August 13.
The exit from this pennant flag will probably happen around $1,190 at the end of October, and it should lead us lower by $174, toward $1,019.
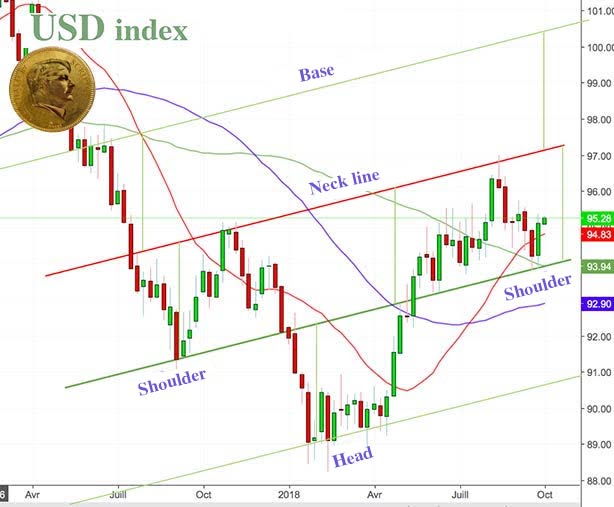
The fifth reason is the expected rise of the Dollar Index, which is drawing a reverse head-and-shoulders pattern and is going back up to its neckline, around 97.5.
With the possibility of it going back up to its baseline.
If gold falls to $1,000, silver will fall to $11.95, as I’ve demonstrated before.
And this is despite the corner of physical silver still going on and despite the constant buying of physical gold, that dry the market.
As the euro will fall against the dollar, it doesn’t make sense to want to buy silver at the lowest price. We should see rising premiums on physical silver.
Will oil be drawn lower all along? If that were to happen, Wall Street would go down as well.
MONETARY GEOPOLITICS
The Yuan, seeming to be pegged on gold since April, should also fall against the dollar, which will make American tariffs totally useless.
The more the dollar will rise, the more the debt crisis will get bigger. Defaults will abound and banks will suffer.
And finally, Trump will have to abruptly devaluate the dollar for American industry to remain competitive with its exports and to calm down the international debt crisis.
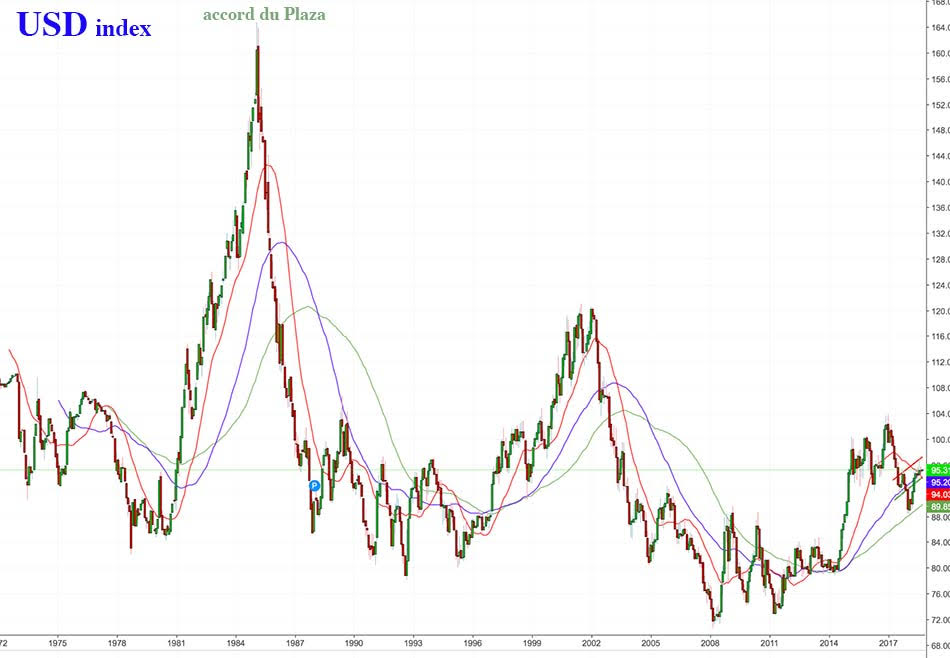
Remember that at the end of August, 2018, China refused the imposition of a new Plaza Accord, according to XinhuaNet, the eldest of the two Chinese press agencies, and Zerohedge. China considers that Japan has been the main victim of the Plaza Accord and that the Japanese economy had never recovered since. At that time, the exchange rate between the dollar and the yen had gone down by 51% in two years, thus erasing half of Japan’s monetary reserves’ value.
If China can boast publicly having refused these new accords, it’s because it’s been put forward by Donald Trump and the Federal Reserve. Thus there is, behind the scenes of monetary geopolitics, a will to make the dollar drop. Americans have to learn to negotiate with diplomacy, which they can’t do when they’re not in a position of strength. The Yang-Tse Gunboat policy is outdated. Neither the Chinese nor the Russians are impressed by the American aircraft carriers anymore; and, more than anything, those constituted the ultimate argument for imposing the violent devaluation of 1985.
The present crisis almost seems inexistent by comparison with the soaring prices of the dollar from 1983 to 1985. The following fall was just as violent as the preceding rise.
This dollar fall ended January 1st, 1988, on the exact same day as the top in gold from 1984 to 1988. The smart money that bought gold during the Plaza Accord negotiations made a bundle.
At that time, they had played gold against the dollar, but they hadn’t played silver. I believe I know that the oligarchs will play both precious metals against the dollar in the months to come.
Is such an enormous crisis avoidable?
Well, of course, since this is a technical analysis of charts, showing one scenario among several possible ones.
Monetary or military geopolitics could derail this scenario.

All things being equal, you’ll understand why the whole of NATO’s armada is moving toward the Russian ships in the Eastern Mediterranean, Russia being less powerful than China...
You’ll understand why Chinese, Russian and Iranian diplomats have accelerated – since last week – negotiations to admit Iran into the SCO (Shanghai Cooperation Organisation), a Eurasian defence treaty with the aim of countering NATO.
And you’ll understand why China has refused entry in Hong Kong to an American military ship (NY Times).
This commercial war is a monetary war, in reality, and military pressures are actually at a maximum.
To be continued...
Reproduction, in whole or in part, is authorized as long as it includes all the text hyperlinks and a link back to the original source.
The information contained in this article is for information purposes only and does not constitute investment advice or a recommendation to buy or sell.


