The comeback of inflation can no longer be ignored.
Monday morning, in Shanghai, the futures contract for iron ore, which is historically the most exchanged contract in China, closed 5.6% higher, at 1134 yuan per ton. Coal closed with an increase of 6%, following a suspension of trading when continued price increases triggered a market circuit breaker.
The cost of chartering a container ship from China to Europe increased to $8,000, four times what it was last year!
In the United States, construction lumber increased to historic rates. Another spectacular increase without historic parallel. One picture epitomizes this boom:

With such price increases, one has to expect an avalanche of cancellations of new home constructions in the United States.
In the United States, over one year, construction lumber has increased by 115%, soybeans by 59%, silver by 55%, copper by 46%, corn by 45%, cotton by 30%, coffee by 25%, the SP500 by 54%, gold by 17%, oil by 16%, real estate by 10%, etc. On the basis of these figures, it’s no coincidence that the balance sheet of the U.S. central bank, for its part, increased by 87% since last year.
The Consumer Price Index, which the Fed uses for its forecasts, has only increased by 1.6%, which has allowed the central bank to talk about the measured and temporary effect of the increase in inflation.
But inflation is now a very sensitive issue in the minds of Americans: 77% even say that it has become a major problem, according to a poll by CivicScience:
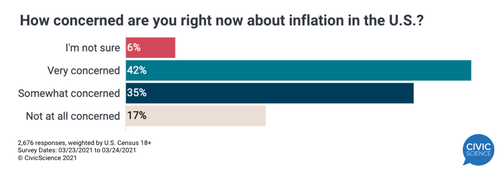
Inflation is, above all, a psychological phenomenon of perception, regardless of what the members of the Fed say about it.
The measures set in motion in 2010-2020 did not have the same perception as the measures decided upon since 2020: in fact, the measures taken during this period following 2010 could even have led to a boomerang effect on the perception of price levels for this new decade.
Every hyperinflationist event in history has resulted in a monetary collapse. It is not the increase in demand for goods and services or an aggressive rate policy that has caused these hyperinflations. These phenomena have always been due to poor monetary policies, involving currency devaluation. Hyperinflation occurs through a change in perception compared to the monetary policy of the central bank.
To combat this new perception on inflation, the Fed has no other choice than to raise rates, in order to regain credibility.
But in this case, they would totally topple the market in growth stocks, which is entirely dependent on low rates.
Moreover, for three weeks, the market has been testing the Fed in this area, with the full knowledge that the central bank must choose between the two alternatives: let uncontrollable inflation run, and risk its credibility, or tighten the screws and let the markets plunge.
On the other hand, one can legitimately ask how the Fed is going to succeed on its two current opposing mandates, in promising no rate increase until 2024, while avoiding an explosion in the technology sector.
The famous “technological stocks index that does not generate any revenues”, which we have talked about for quite a while in our articles, has begun its correction however, and entered a bear market last week.
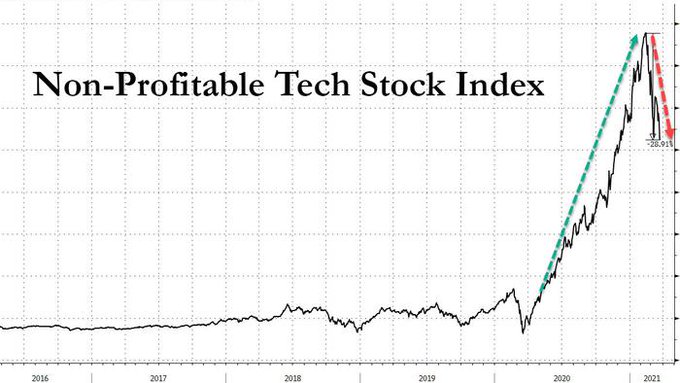
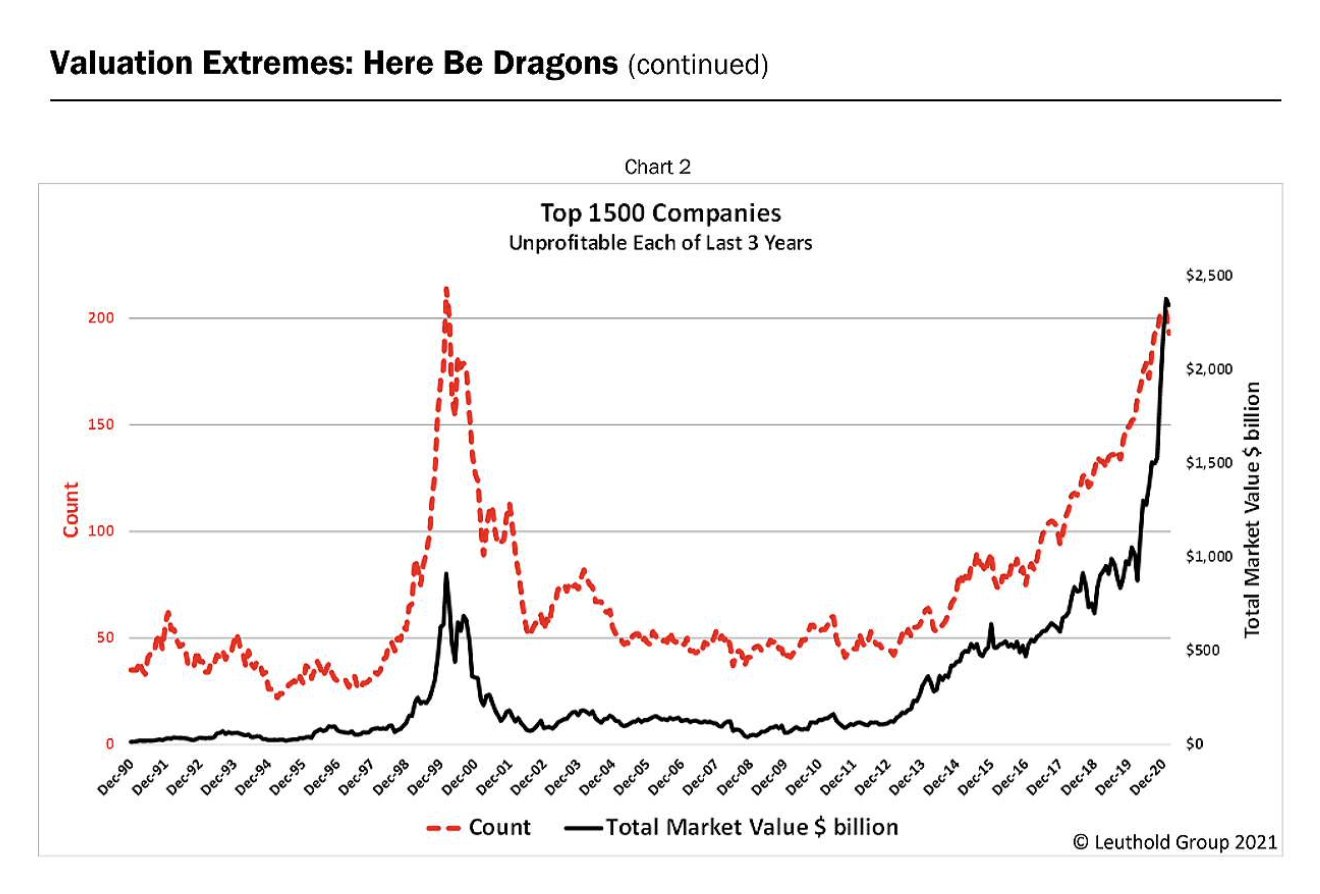
This correction is taking place at a time when the capitalization of these companies, which are not making any money, is at its highest.
The central banks are in an even more fragile position than in the last financial crisis, because there is even more leverage effect and more debt in the financial system.
And it is in this very fragile context that the collapse of the Archegos hedge fund occurred Friday evening: this event reminds us that the smallest margin call has a disastrous effect on markets that are becoming increasingly fragile, due to the fact that leverage effects are becoming greater and greater.
The central banks must take action by intervening more quickly and more massively to prevent the cascade effects of these types of bankruptcies.
In any case, this liquidation of funds accentuates the market slump; its cost is the largest bankruptcy of funds since the rout of LTCM in 1998.
It is not likely that the Fed will stand idly by during this massive liquidation.
Bloomberg reminds us what is at the origin of the failure of this fund: at the basis of the “mid-air” explosion of Archegos, you will find the CFDs, these very controversial derivative products (and, in any case, theoretically prohibited in the United States but authorized in Europe, Japan, the UK, etc.).
These products (supplied in this case by Credit Suisse) allow the fund that holds them to have positions in the equity of companies or indices, without physically declaring these positions.
These products are not negotiated on the markets, but in an opaque manner in adjacent markets. When everything goes as it should, everybody wins, including the banks, thanks to generous commissions; on the other hand, when the fund accumulates losses, as is currently the case with Archegos, the margin calls are made under conditions that put the issuers of these products in difficulty, since the CFDs concern positions that did not exist or that were unknown in the chain of brokers who were used!
How do you cover losses in a position that does not exist? It is a systemic risk that was registered immediately, even at the entry of these derivative products.
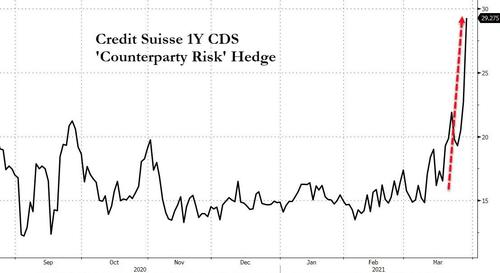
However, the risk spreads to the banking establishment that provided the derivative products, which shows the spectacular increase in the cost of insurance (CDS) of the banking establishment, Credit Suisse:
To prevent the crisis from becoming contagious, central banks must quickly intervene by once again providing the necessary liquidity to the market.
But this time, these same central banks are also gambling their credibility in relation to the consequences of these interventions on the actual value of the money that they issue. Any signal of additional intervention risks triggering a monetary crisis of a hyperinflationary nature, just at a time when the inflation perception is in the process of changing.
In the bond market, the market that has been testing the Fed for 7 weeks, rates climbed quickly. Such upward movements are pretty rare in recent monetary history. The yield curve has also widened, short term rates exploding upwards compared to long term rates, in a magnitude of increase not seen since 2008.
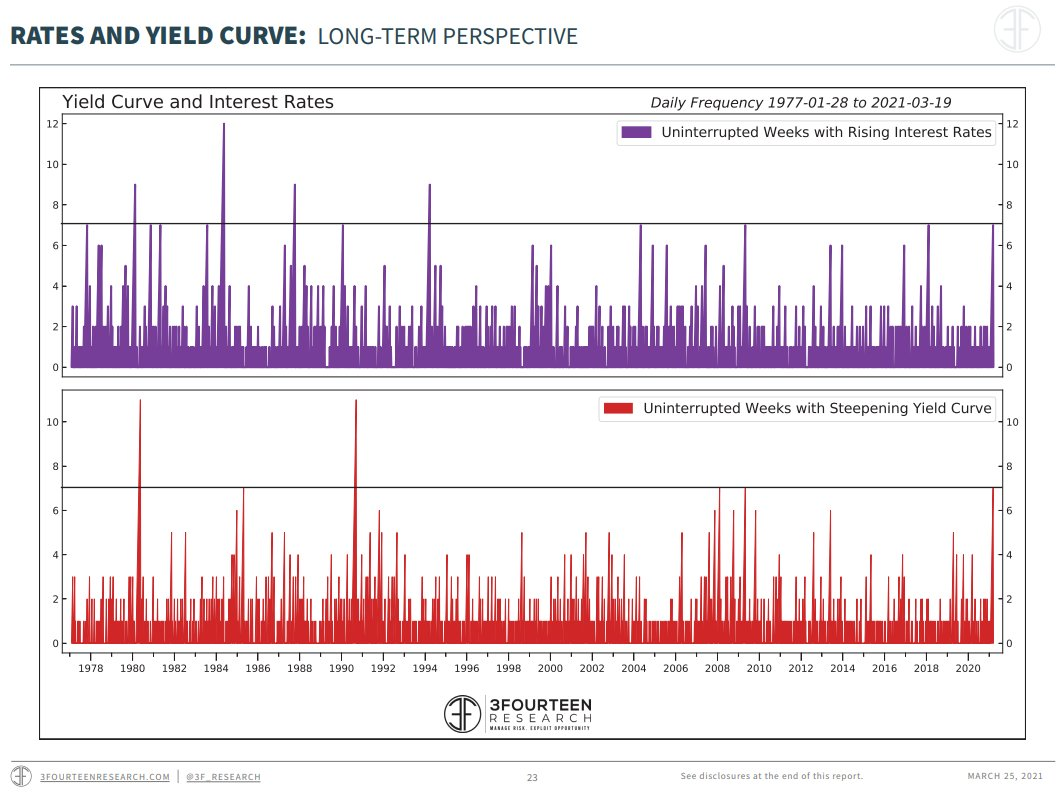
It is this differentiated movement on the rates that is forcing operators to sell long rates, anticipating the next intervention of the Fed on the control of this rate curve.
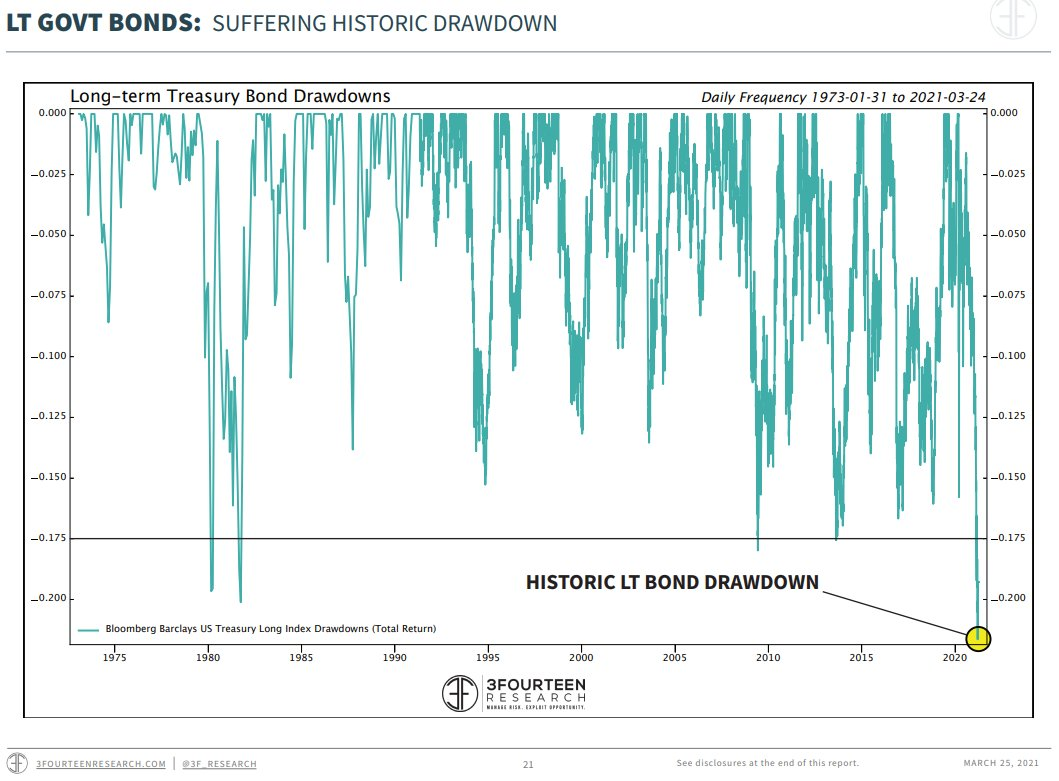
The liquidation of U.S. Treasury bonds also reached a record level last week:
This liquidation came at a time when the 10 year reached a downtrend started at the beginning of the interventionist period of the Fed. This trend is represented by the line in the following chart:
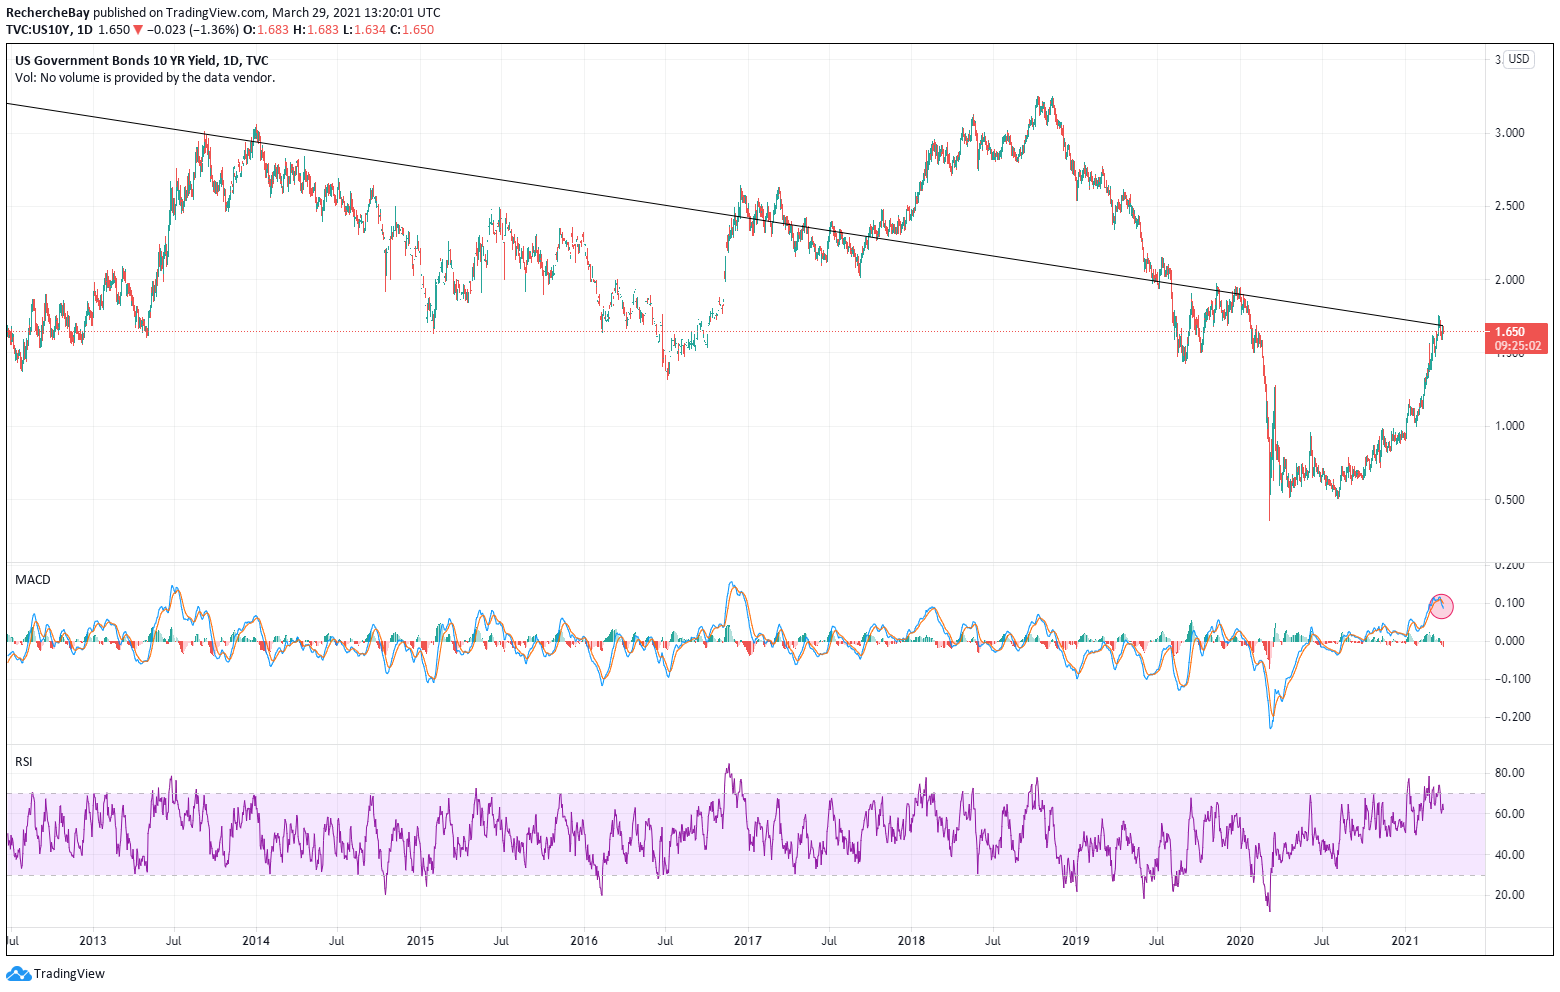
When the Fed let the rate rise during the phase of QT (Quantitative tightening or monetary tightening in 2018), the situation quickly deteriorated and led, in 2019, to stronger intervention by the Fed. This trend is the main thrust for the Fed; the economy needs a constant lowering of interest rates to compensate for growth in debt and a leverage effect on financial instruments that is becoming larger and larger. The attainment of this line is an intervention signal for the Fed. On the chart, we note moreover, a signal of a return to the MACD indicator.
This intervention will have a cost on the value of money, as we have seen. And as is often the case in this type of configuration, the true movement on Forex will not take place until after all of the “shorts” have been liquidated in one of the biggest short squeeze movements on the U.S. currency in recent history. This short squeeze on the dollar is continuing this week; the net short position of speculators on the dollar has returned to its low level of June 2020.
Gold is confronting this upward movement of the dollar with a barrage of technical funds that use their algorithms to sell gold at each increase of the dollar DXY index. Gold is also sold in the liquidation moves of the stocks of the Archegos funds.
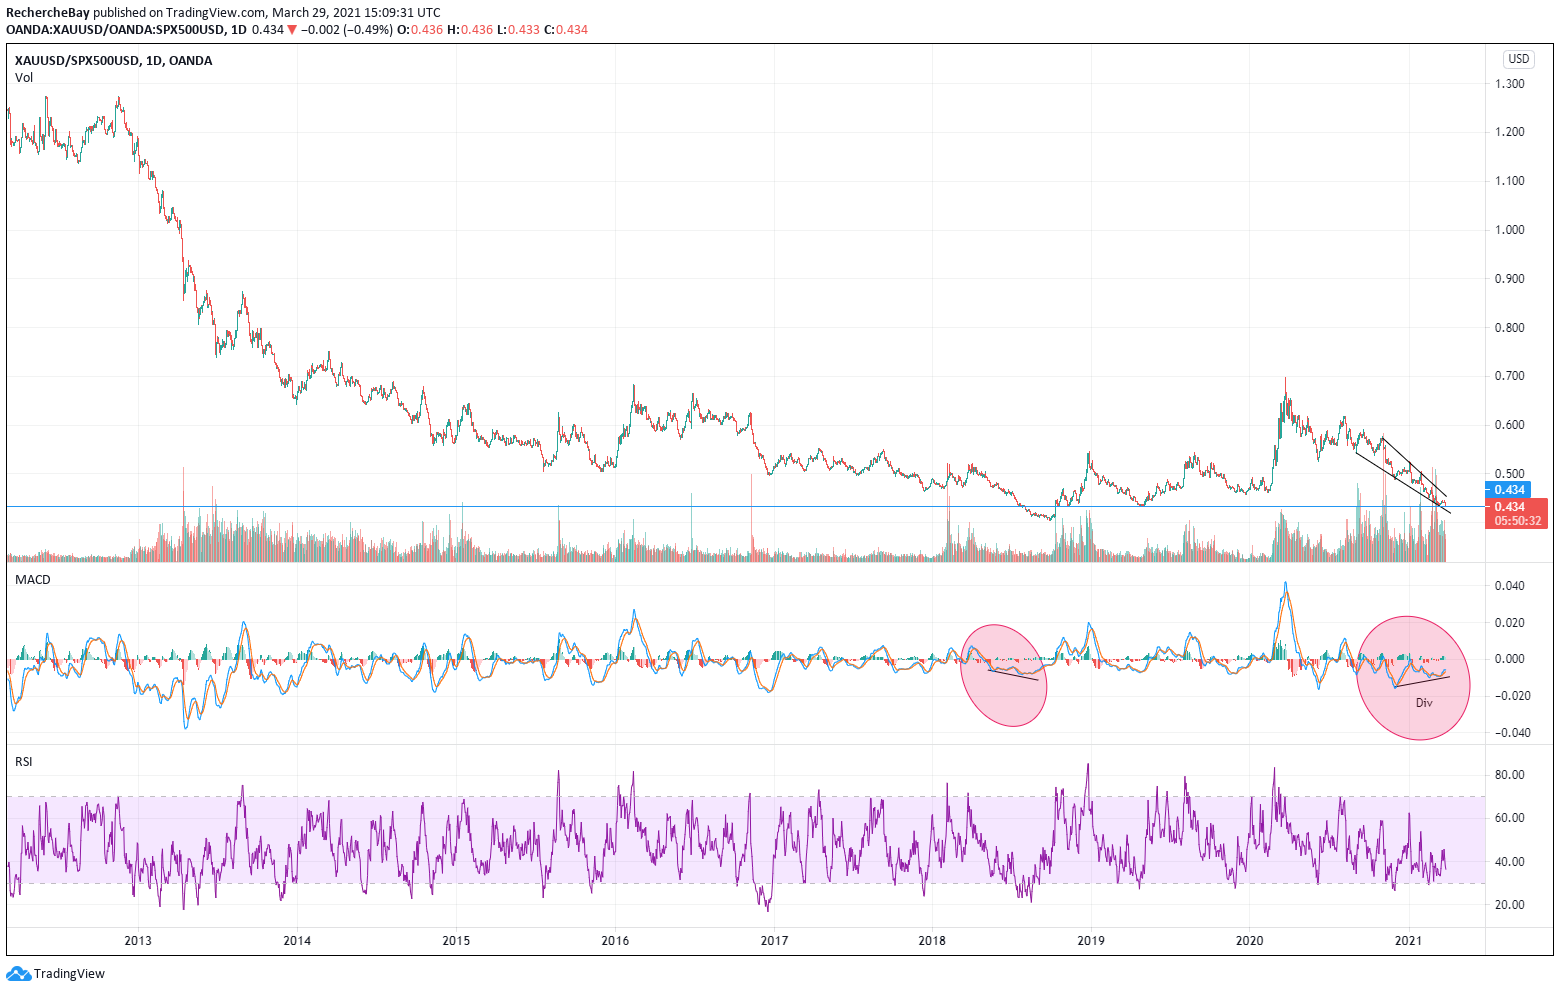
It should be noted that this liquidation of gold positions gives the relationship between the index for gold and that of the markets (GOLD/SPX500) a support attained for the last time in 2018. Never has gold been so inexpensive compared to the stock market, and the last time this happened, the technical configuration was different. This time, the support test occurred on an upward divergence at the end of a very high “Wedge” shape. Gold risks outperforming the markets in the coming weeks.
And while the small speculators are selling their positions, while these technical funds speculate on lower gold prices, the market operators continue to cover their short positions in gold.
Reading the last statement of the COTS shows a more significant improvement compared to last week: short positions of swap dealers is at its lowest since 2019, when gold was under $1300; volatility on the metal also declined, which generally signifies mid-term bullishness.
The same algorithms continue to sell silver on the paper market, the disconnect between the paper markets and the physical markets reaching their peaks in this metal.
This week, it was Perth Mint’s turn to endure a campaign by WallStreetSilver, very active in Australia. The demands for delivery of allocated and non-allocated accounts continued. The logistical difficulties of such a target campaign also accelerated a veritable run on the deposits of the Australian Mint. Some members of the Reddit forum claimed that they were not able to be delivered on time, suspecting that the organization did not physically hold the metal that was entrusted to them. The Perth Mint is struggling at this time in a veritable storm that is being fed by the social networks. R/WallStreetSilver is trying to attack those that they assume to be among the weak links of the system by trying to provoke a delivery default on one of the affiliated bodies of the LBMA.
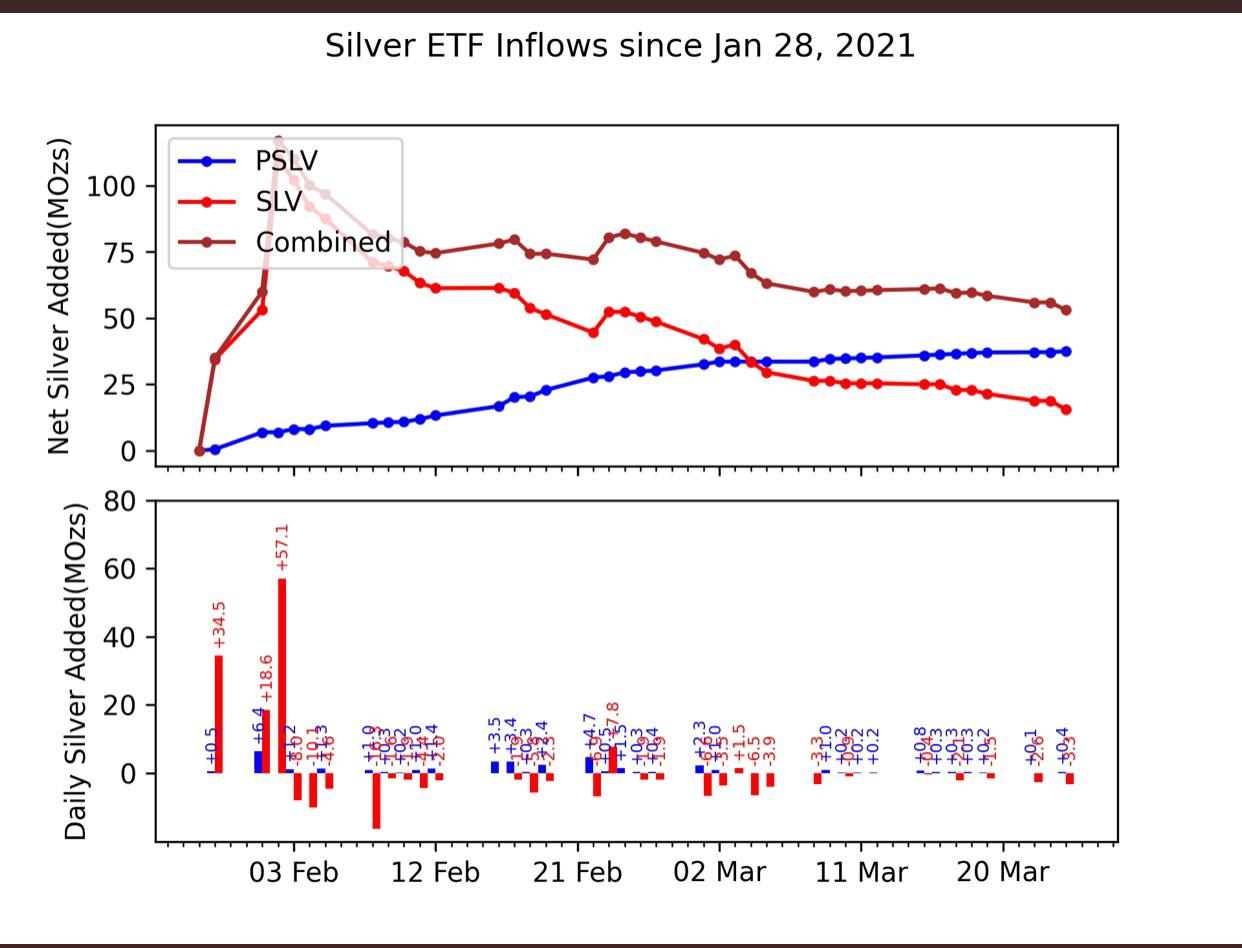
At the same time, the offensive against the ETFs continues with renewed vigor, the SLV positions continue to be liquidated to the profit of the ETF PSLV, allowing r/WallStreetSilver to increase the demand of the physical, while reducing the effect of the price control by JPM Morgan, the bank.
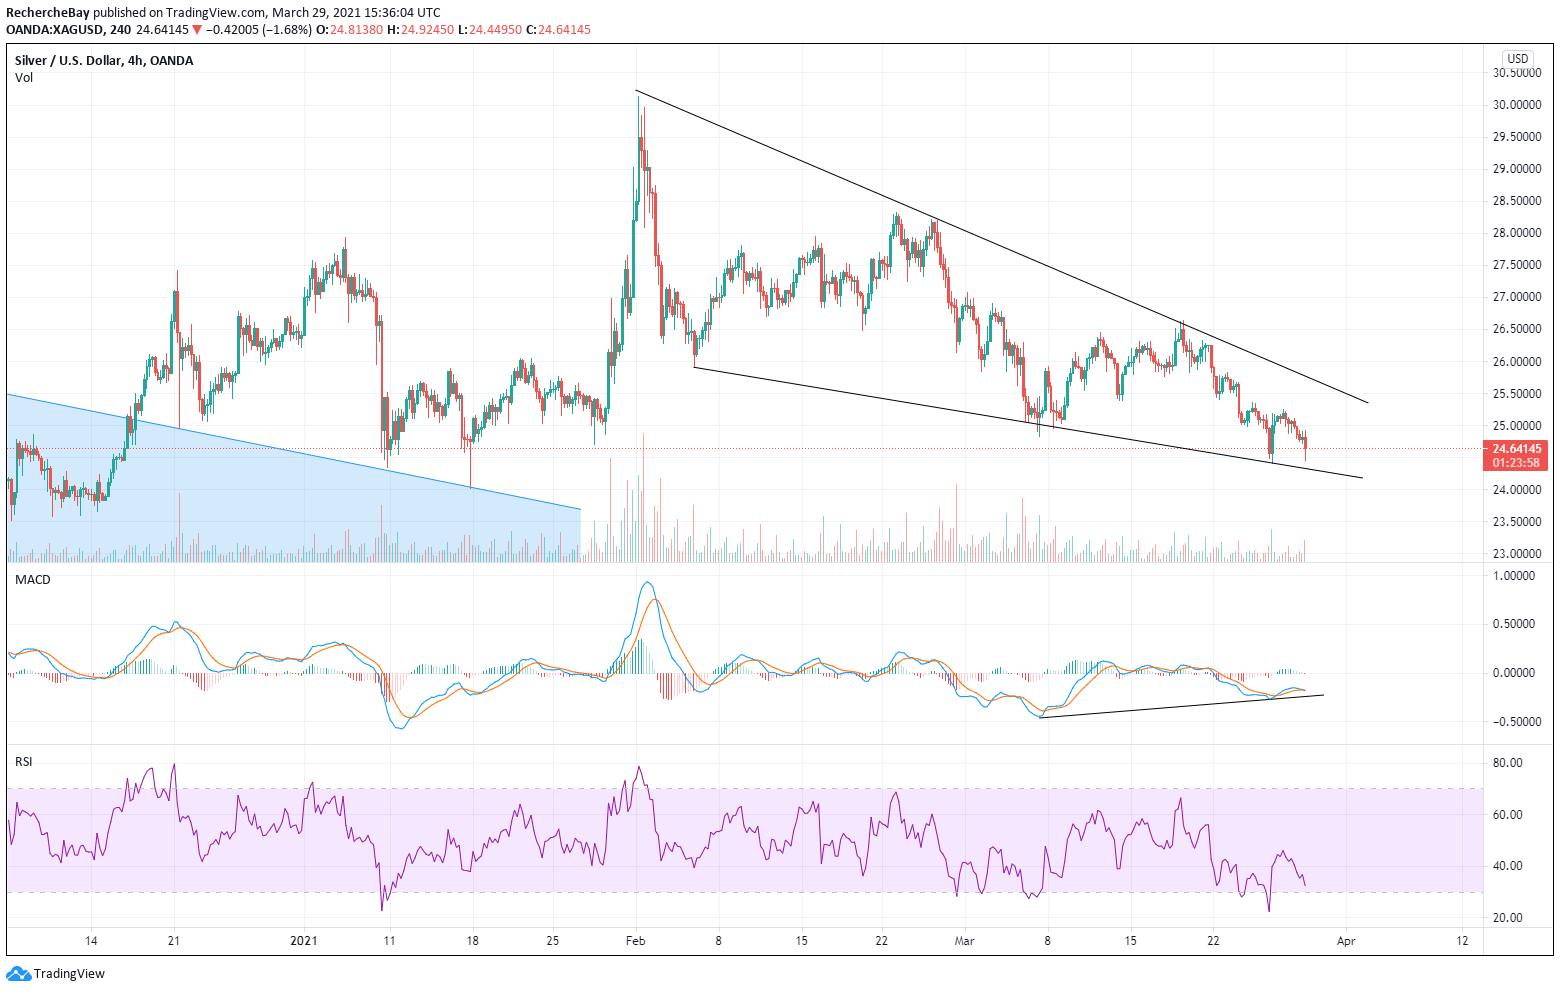
Shown on a chart, silver continues its consolidation “Wedge” begun in the month of March, with a significant upward divergence:
Sentiment on the mining stocks continues to reach the lowest levels since March 2020.
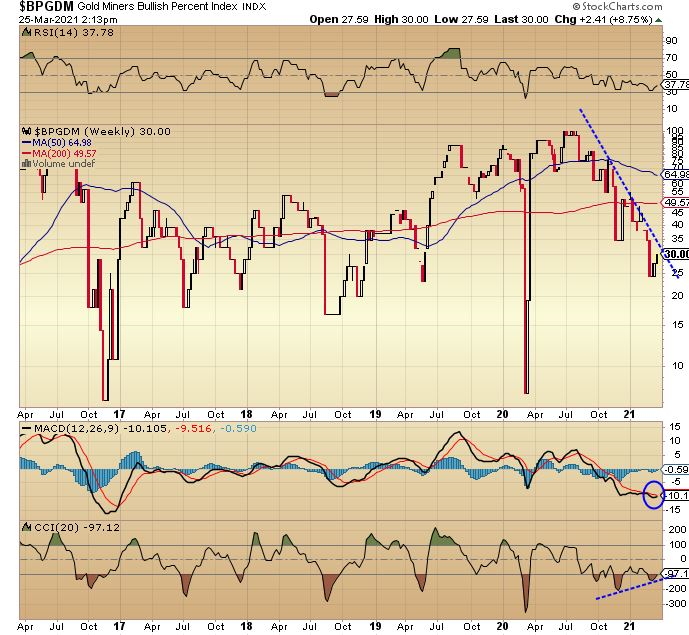
It should be noted that this last downward leg in sentiment took place on a divergence of the CCI indicator and that a MACD crosspoint appeared on this index, indicating an upcoming reversal.
The correction in gold took place at higher and higher levels of the GDX index, and in any case allowed a return one year after the buying opportunities on the mining stocks that I did not expect to see so soon.
The juniors, because they are further away from the current toxicity of the markets, remain at levels that are largely higher than the past year.
The mining stocks traded on the higher volumes corrected a great deal more than the small caps, and there is no doubt they that must first examine whether to decelerate at the first tangible sign of a return of the sector.
Original source: Recherche Bay
Reproduction, in whole or in part, is authorized as long as it includes all the text hyperlinks and a link back to the original source.
The information contained in this article is for information purposes only and does not constitute investment advice or a recommendation to buy or sell.


