Written by Jan Nieuwenhuijs for The Gold Observer
In general, the gold price in U.S. dollars is set by long-term inflation expectations and interest rates in the United States. The price of gold in other currencies depends on the exchange rate between a particular currency and the dollar.

In a previous series of articles we discussed how the international gold market functions, and how the price of gold is set by institutional supply and demand. In this series, we will examine what economic variables change supply and demand of gold, and thus the gold price. To save your precious time I will start this article with a summary and add a historical background, to subsequently expand on the details in forthcoming articles.
In my opinion it is important to understand the current framework, if only to question its longevity. Since 2006 the price of gold in U.S. dollars is inversely correlated to (expected) real interest rates derived from the 10-year U.S. Treasury Inflation Protected Security (TIPS), as you can see in the chart below. This correlation is what I refer to as the current framework.
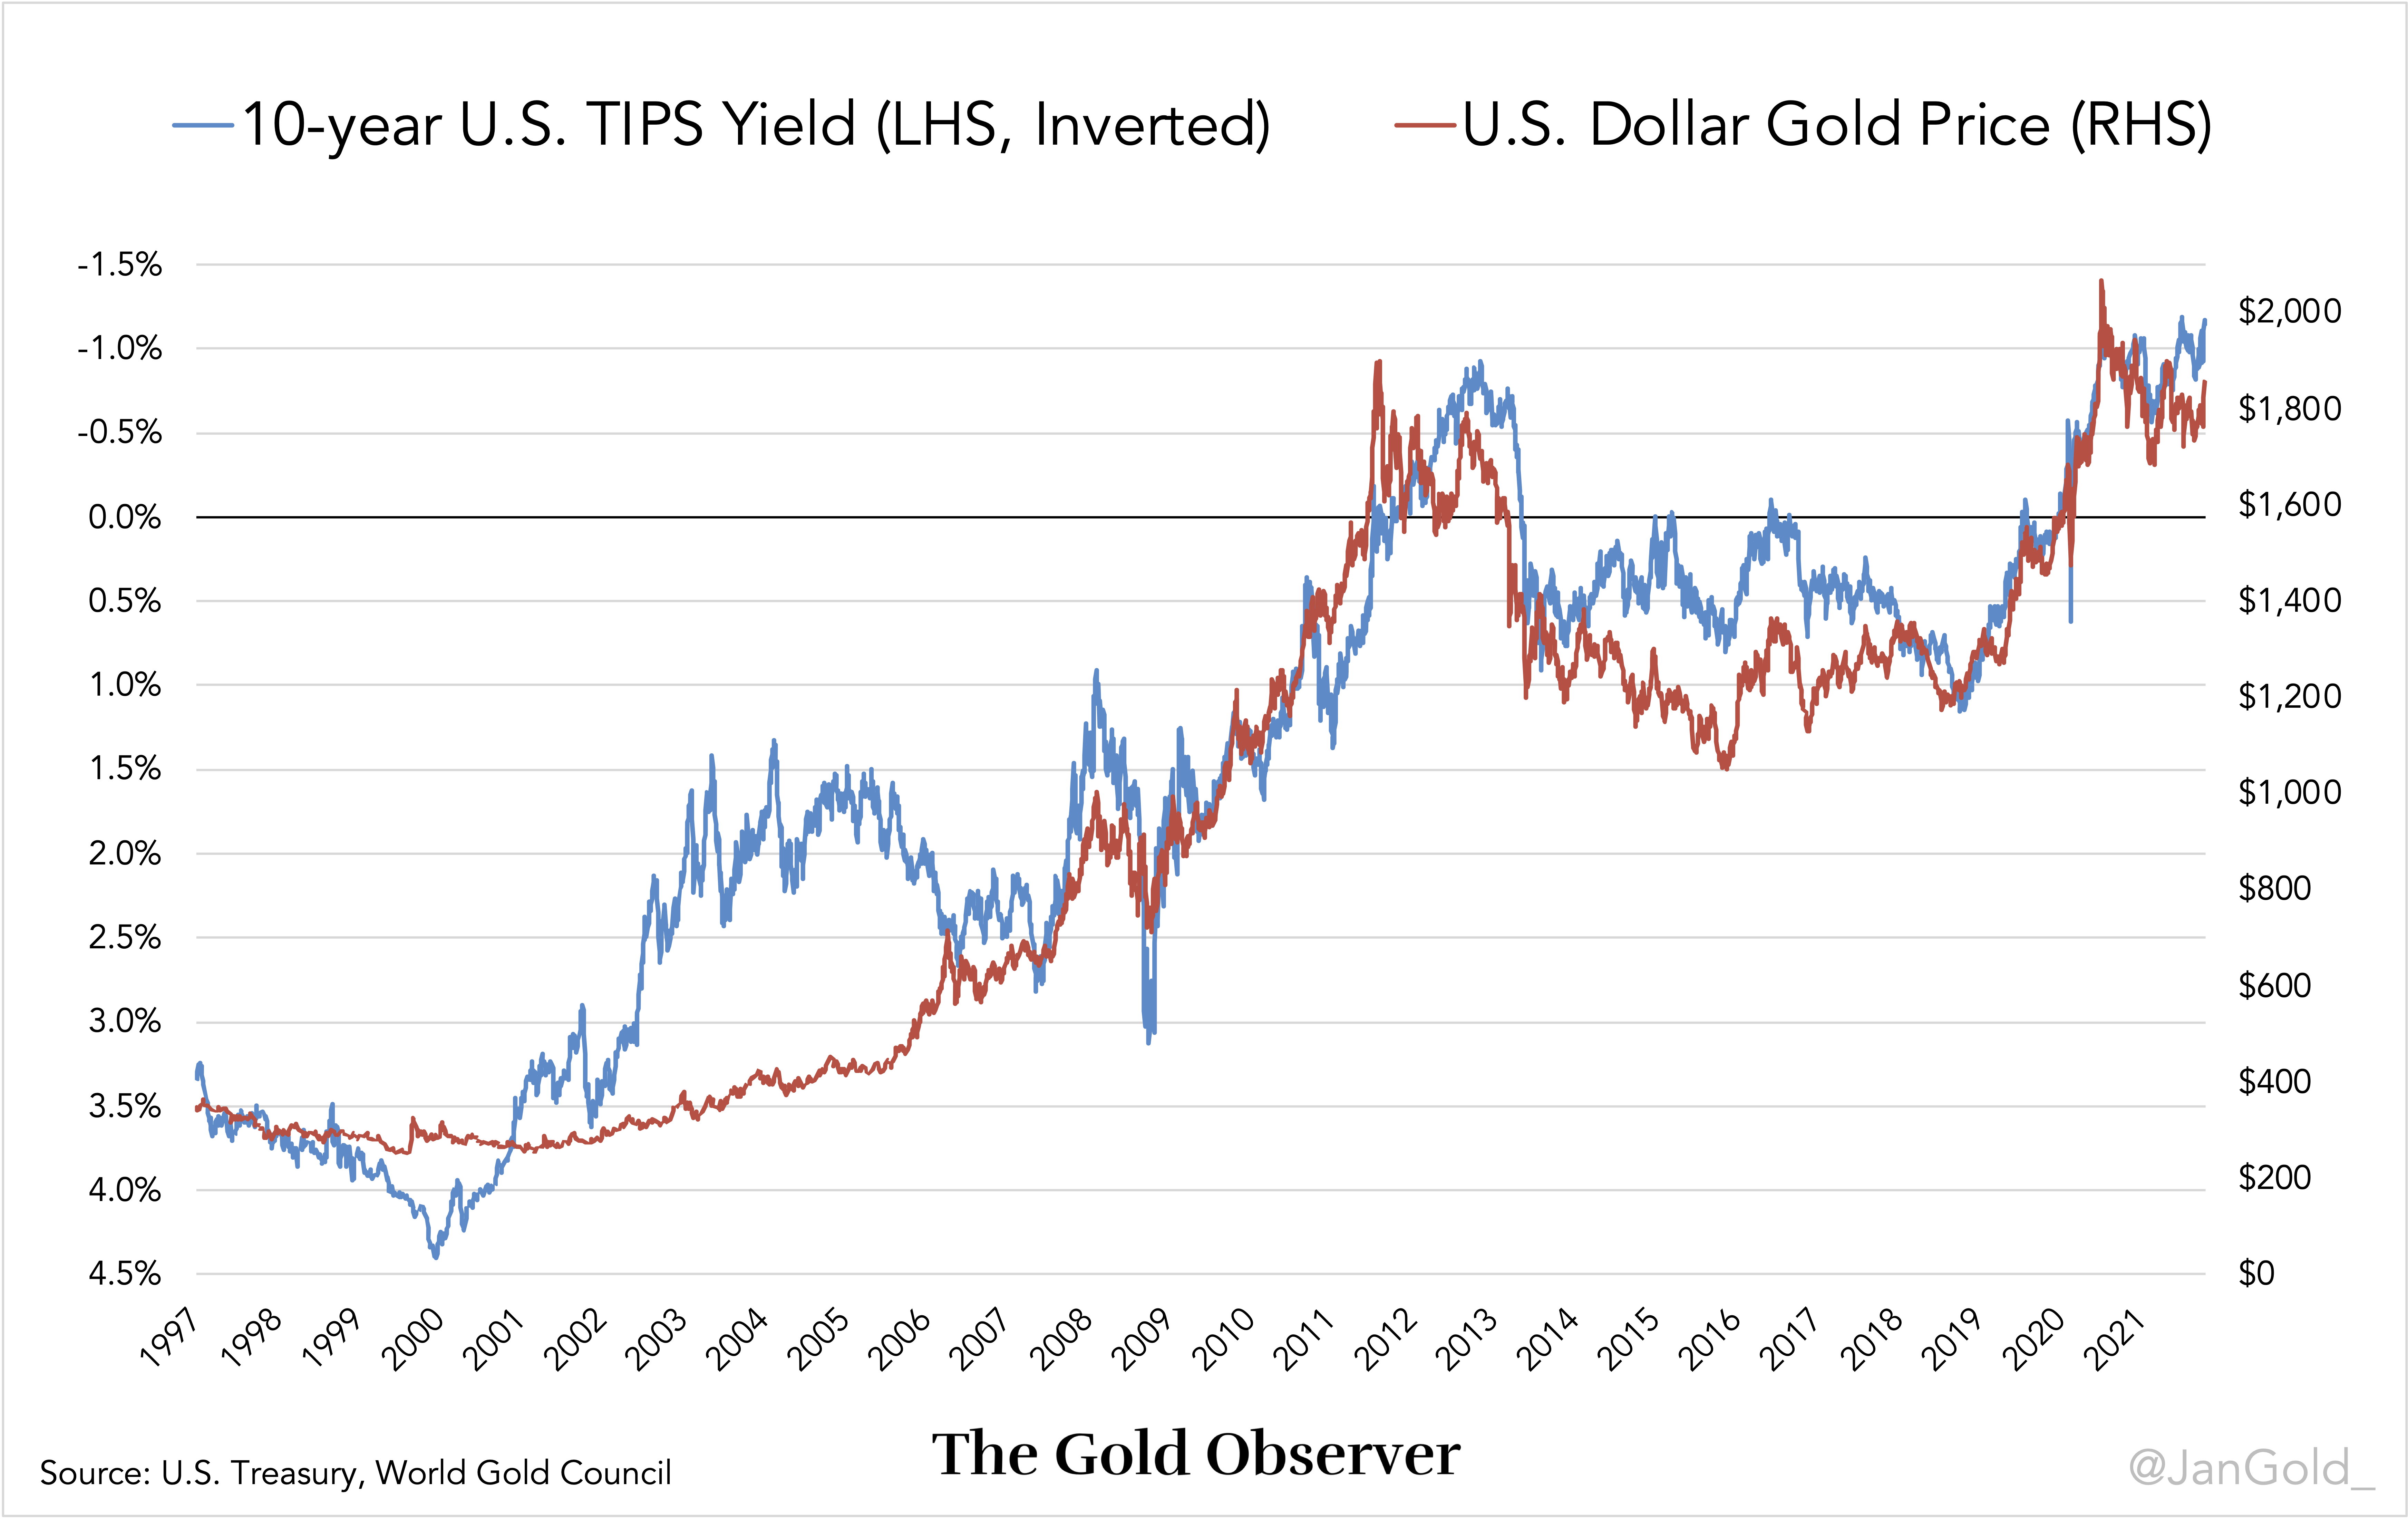
Note, in the chart above the axis of the TIPS rate is inverted, because when the TIPS rate falls, the gold price rises, and vice versa*. The reasoning is that when the real interest rate on government bonds falls, it becomes more attractive to own gold, because gold is the only international reserve asset without counterparty risk. When the real interest rate rises, it becomes less attractive to own gold, because gold doesn’t yield (if not lent out).
The 10-year TIPS bond is a U.S. government bond that compensates the owner for consumer price inflation (CPI). If, for example, the TIPS rate is 2% and annual inflation 3%, the owner of the bond receives 5% interest (2% + 3%). Because a correction is added when interest and the principal are paid, the market sets the TIPS yield lower than the yield on regular U.S. government bonds (nominal Treasuries). Basically, the market keeps buying TIPS bonds, driving down its yield, until the market is indifferent between holding TIPS bonds or nominal Treasuries, based on what they expect average inflation to be over the next 10 years.
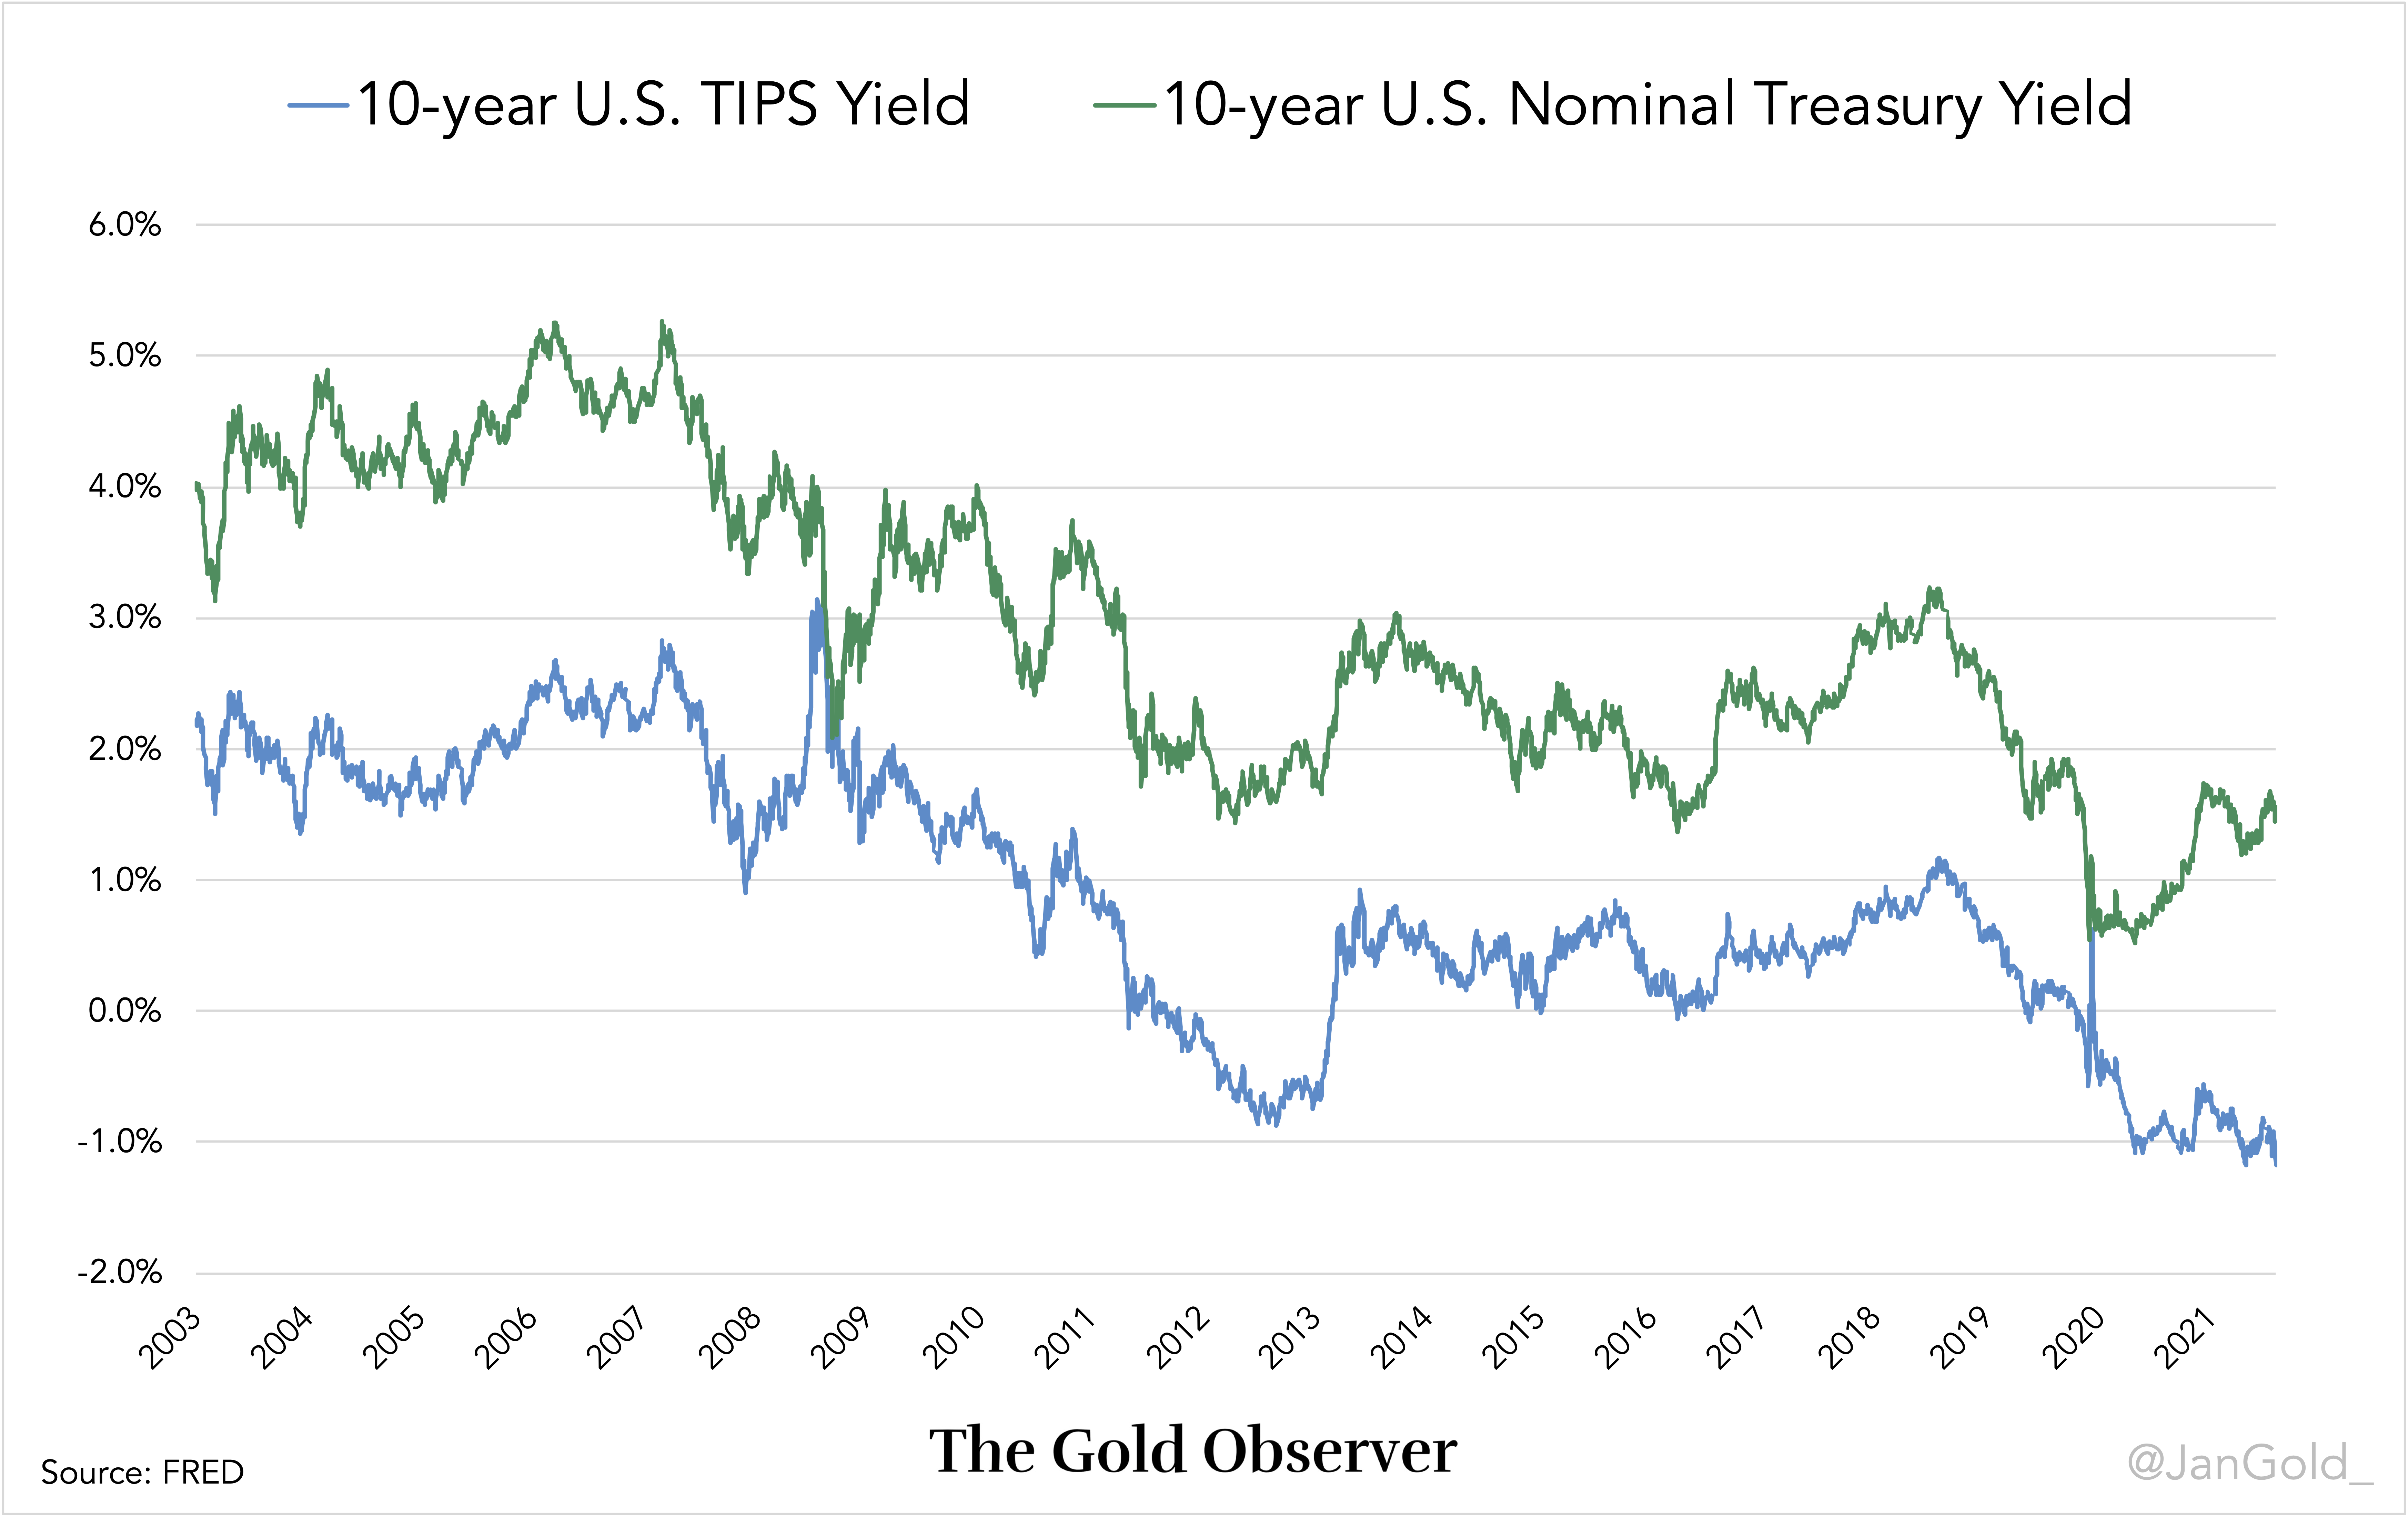
The difference between the 10-year TIPS rate and 10-year nominal Treasury rate is thus what the market expects average inflation to be in the next 10 years. This market-based inflation expectation is also called the breakeven rate.
In conclusion:
TIPS rate = Treasury rate – breakeven rate
Or, in other words:
Expected real interest rate = Treasury rate – inflation expectations
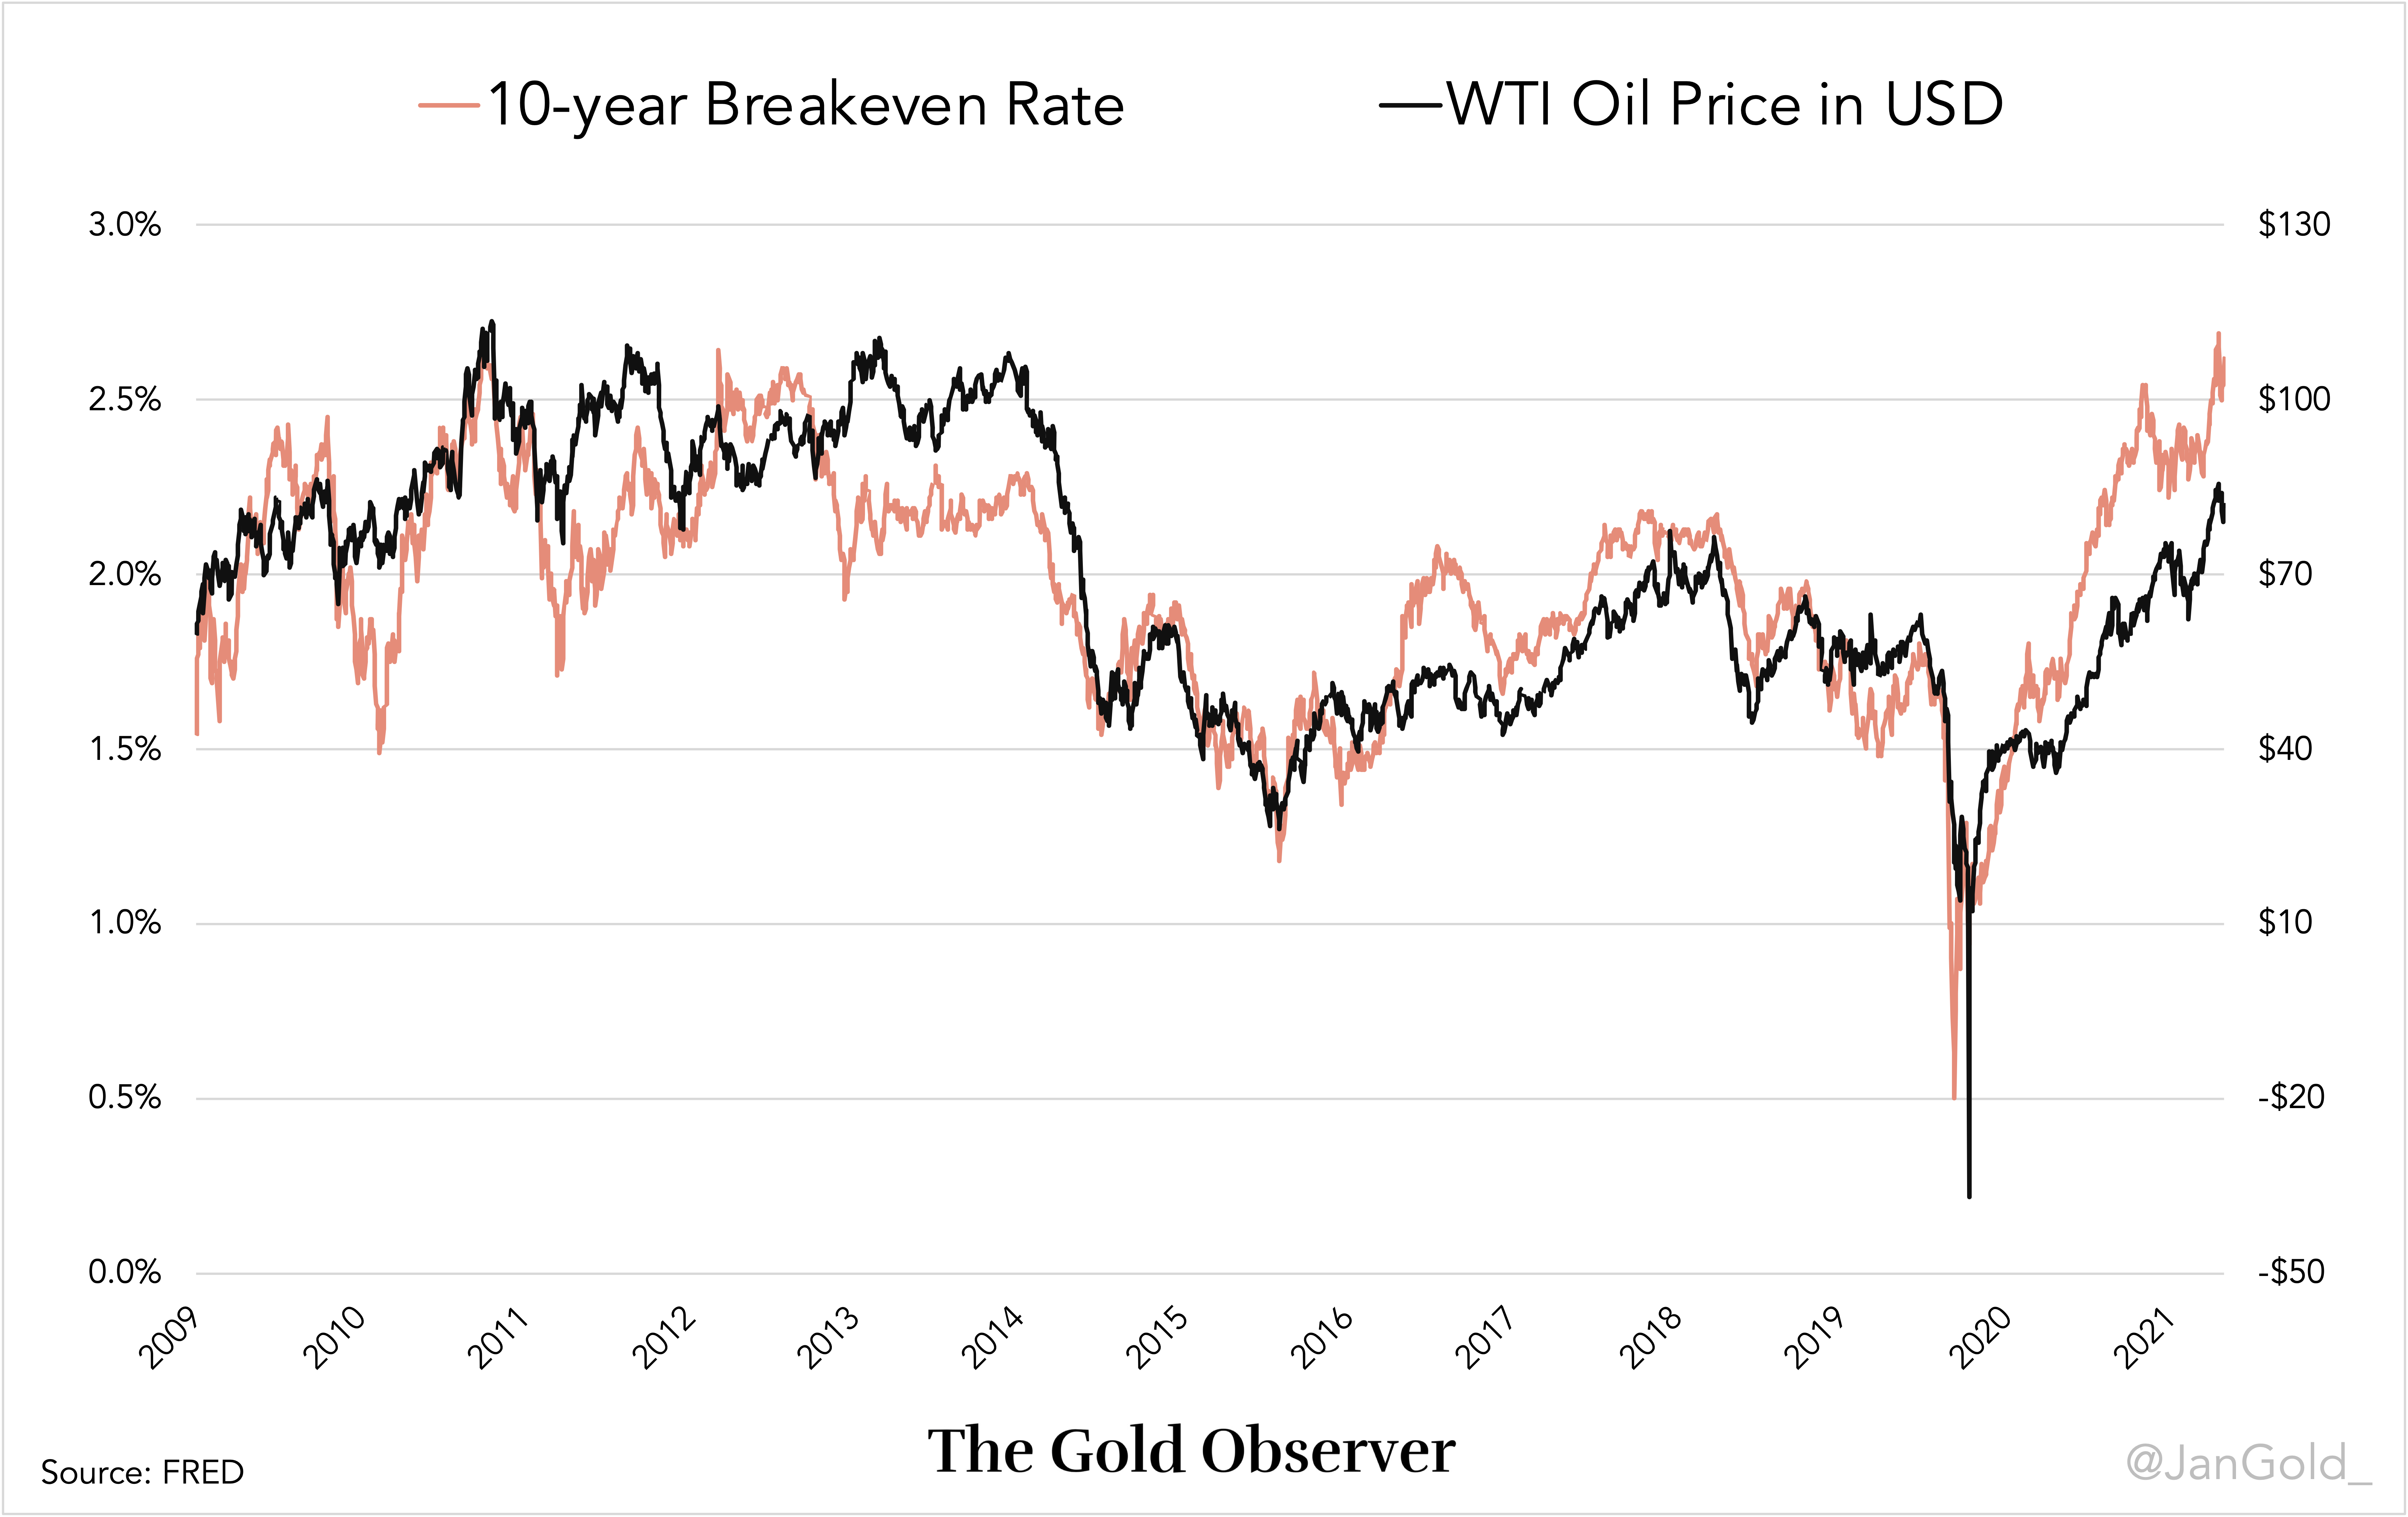
For those interested, after 2008 the 10-year breakeven rate became more tightly correlated to the price of oil. As energy is the lifeblood of the economy, a rise in energy prices will be translated in higher prices of consumer goods.
For those that like to access an interactive chart that includes the gold price and the 10 -year TIPS rate please click here. Click here if you want to access an interactive chart that includes the 10-year breakeven rate, 10-year TIPS rate, and 10-year nominal Treasury rate.
A Historic Perspective on Gold as a Store of Value
Gold has been an inflation hedge for thousands of years. Though gold is not a perfect constant, as such an asset doesn’t exist in economics.
People in the East are still accustomed to giving their peers gold at childbirth and marriage. This old tradition makes sure communities survive all monetary regimes by using gold as a store of value and share the metal when people reproduce. They had learned early on that government issued money eventually loses its purchasing power. For wealth to be passed on from one generation to the next a store of value is needed that is immutable and can’t printed: gold.
China has never been on an official gold standard, but as early ca. 475-221 B.C. gold circulated for large payments and was used as a store of value. On the picture below you can see what was called "cube money." pic.twitter.com/OzNP4Xwjlb
— Jan Nieuwenhuijs (@JanGold_) November 14, 2021
In developed economies people have lost their affinity with gold to a degree, because financialization started earlier in West, offering higher returns. Although Western central banks are holding on to their vast monetary gold reserves. Ironically, they are fully aware of their shortcomings and hold gold as their preferred back up currency.
Central bank of Italy:
— Jan Nieuwenhuijs (@JanGold_) October 27, 2020
“Gold is an excellent hedge against adversity and high inflation. Gold cannot depreciate or be devalued. Gold … is not an asset ‘issued’ by a government or a central bank and so does not depend on the issuer’s solvency.” https://t.co/9iwqAd3zdk
The chart below shows the depreciation of three fiat currencies against gold since 1900 without interest rates being calculated. After all, many people don’t have fiat savings that yield.
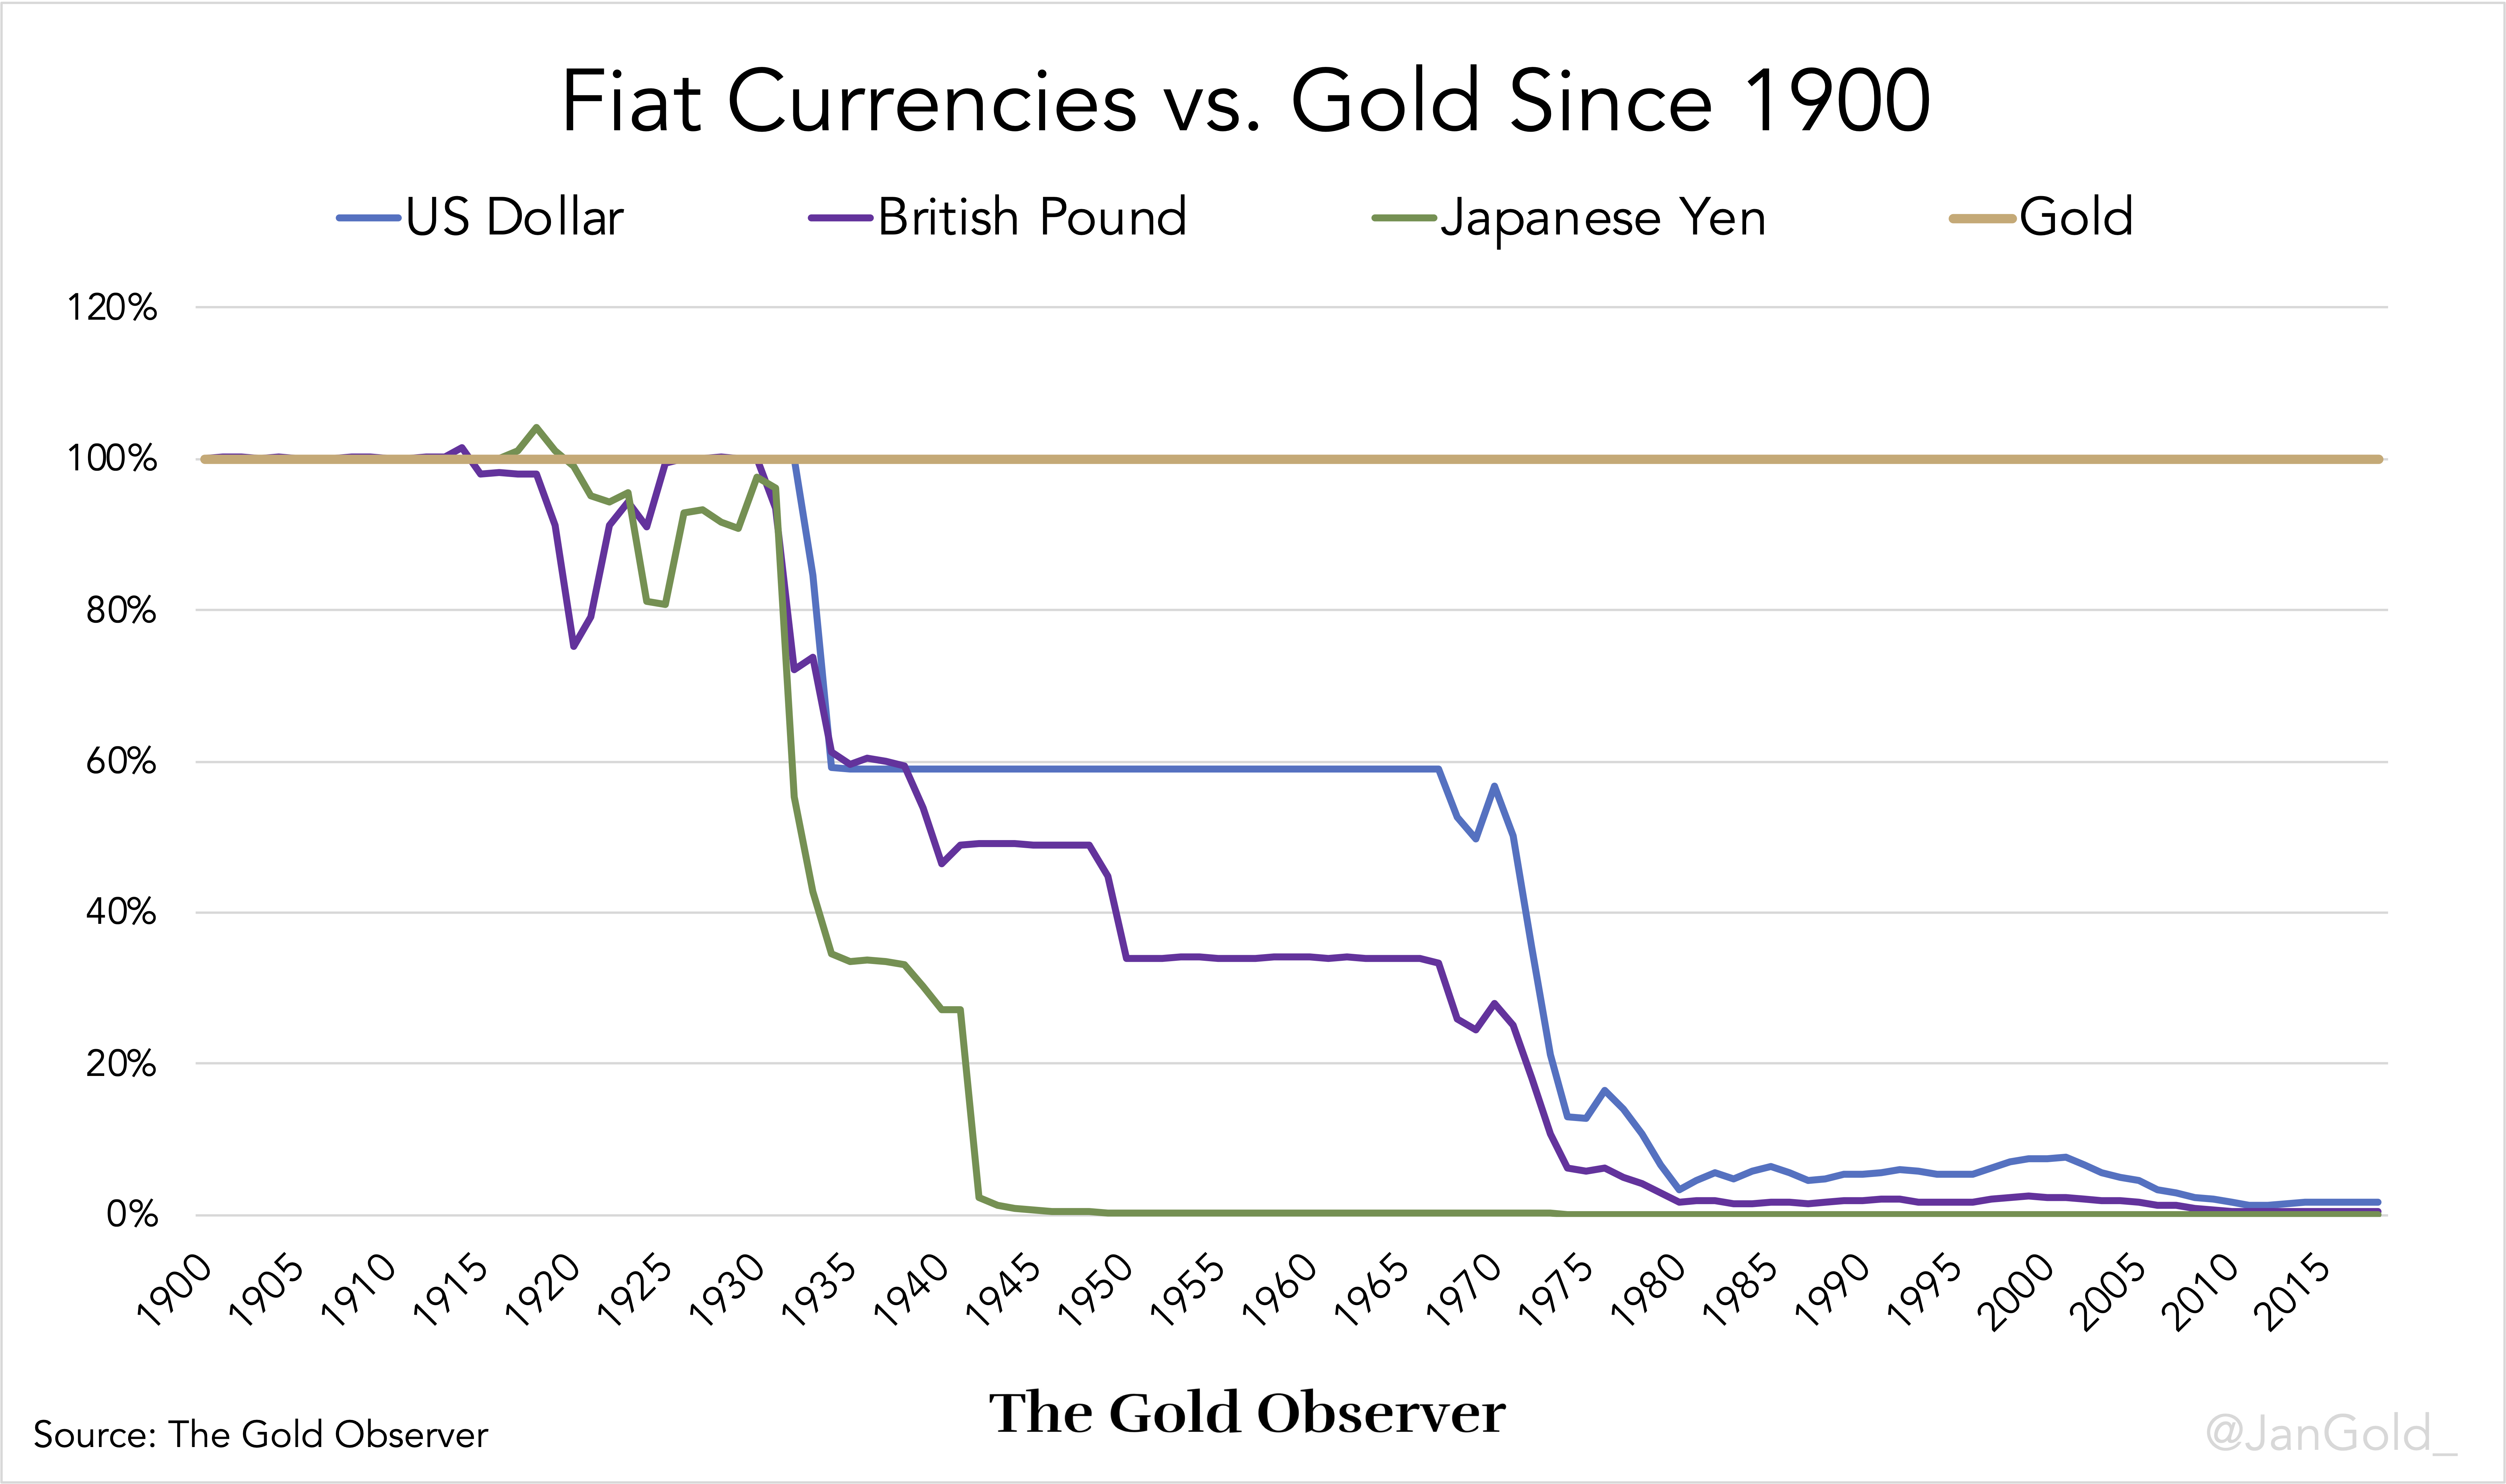
During the last form of a gold standard (Bretton Woods) the U.S. dollar was pegged to gold at a price of $35 per troy ounce, and all other major currencies were pegged to the dollar. Technically, Bretton Woods ended in 1968 when the United States allowed the gold price to float in the free market, after they had printed too many dollars and the gold peg was untenable. From that moment on the gold price started rising. Once again it was clear that no currency issued by a government can compete with gold.
Remarkably, the gold price would rise before consumer prices went up. If the market expected inflation to soar, investors would take shelter in gold and the gold price reacted accordingly. Gold became a proxy for inflation expectations. If the price of gold went up, consumer prices would follow within two years.
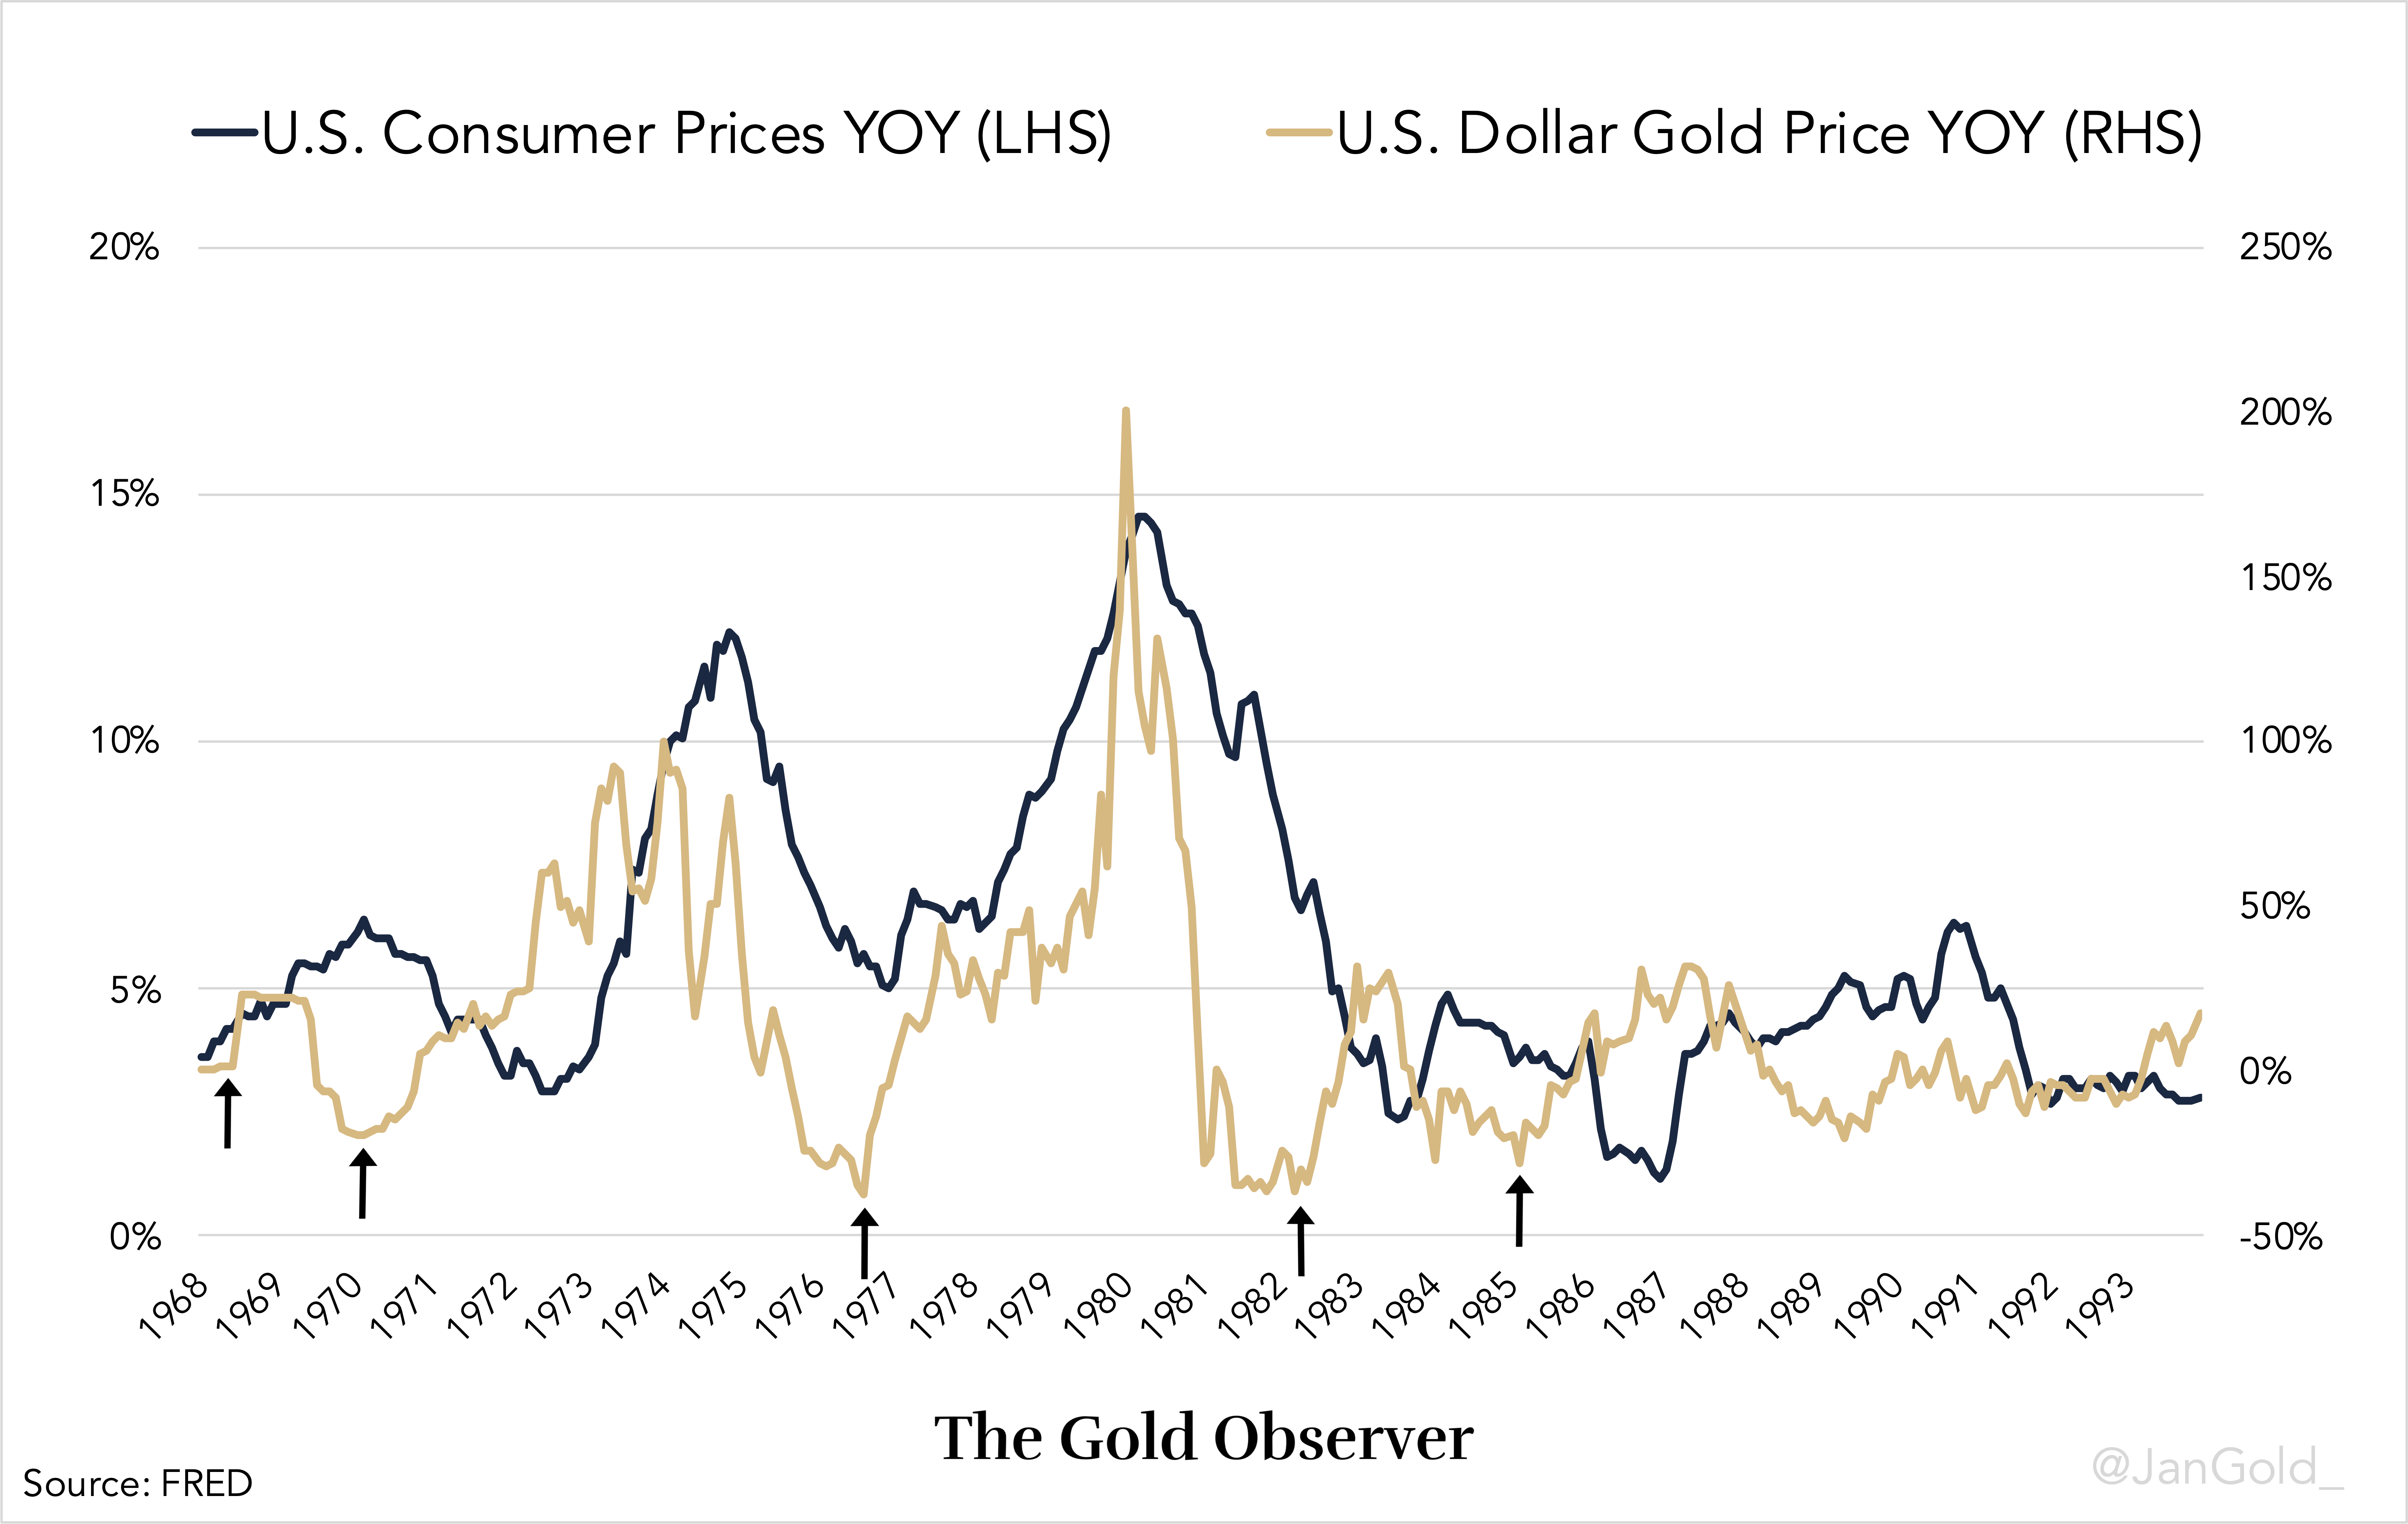
Chair of the Federal Reserve Alan Greenspan stated in 1994:
I think that what the price of gold reflects is a basic view of the desire to hold real hard assets versus currencies. … [Gold] is a store of value measure which has shown a fairly consistent lead on inflation expectations and has been over the years a reasonably good indicator, among others, of what inflation expectations are doing.
Greenspan even based his monetary policy partially on the price of gold.
The connection between inflation expectations and the gold price is still relevant as we saw in the introduction about TIPS bonds.
After double digit inflation numbers and deeply negative real rates in the 1970s, investors were lured out of gold by high positive real rates in the 1980s. Because prior to 1997 there were no TIPS bonds, real interest rates could only be calculated as the nominal interest rate minus the prevailing CPI print. Academics call this the ex-post real interest rate, while they call the TIPS rate the ex-ante real interest rate.
In the chart below you can see 10-year (ex-post) real rate, calculated as the 10-year nominal Treasury rate minus CPI in the United States from 1968 through 2021.
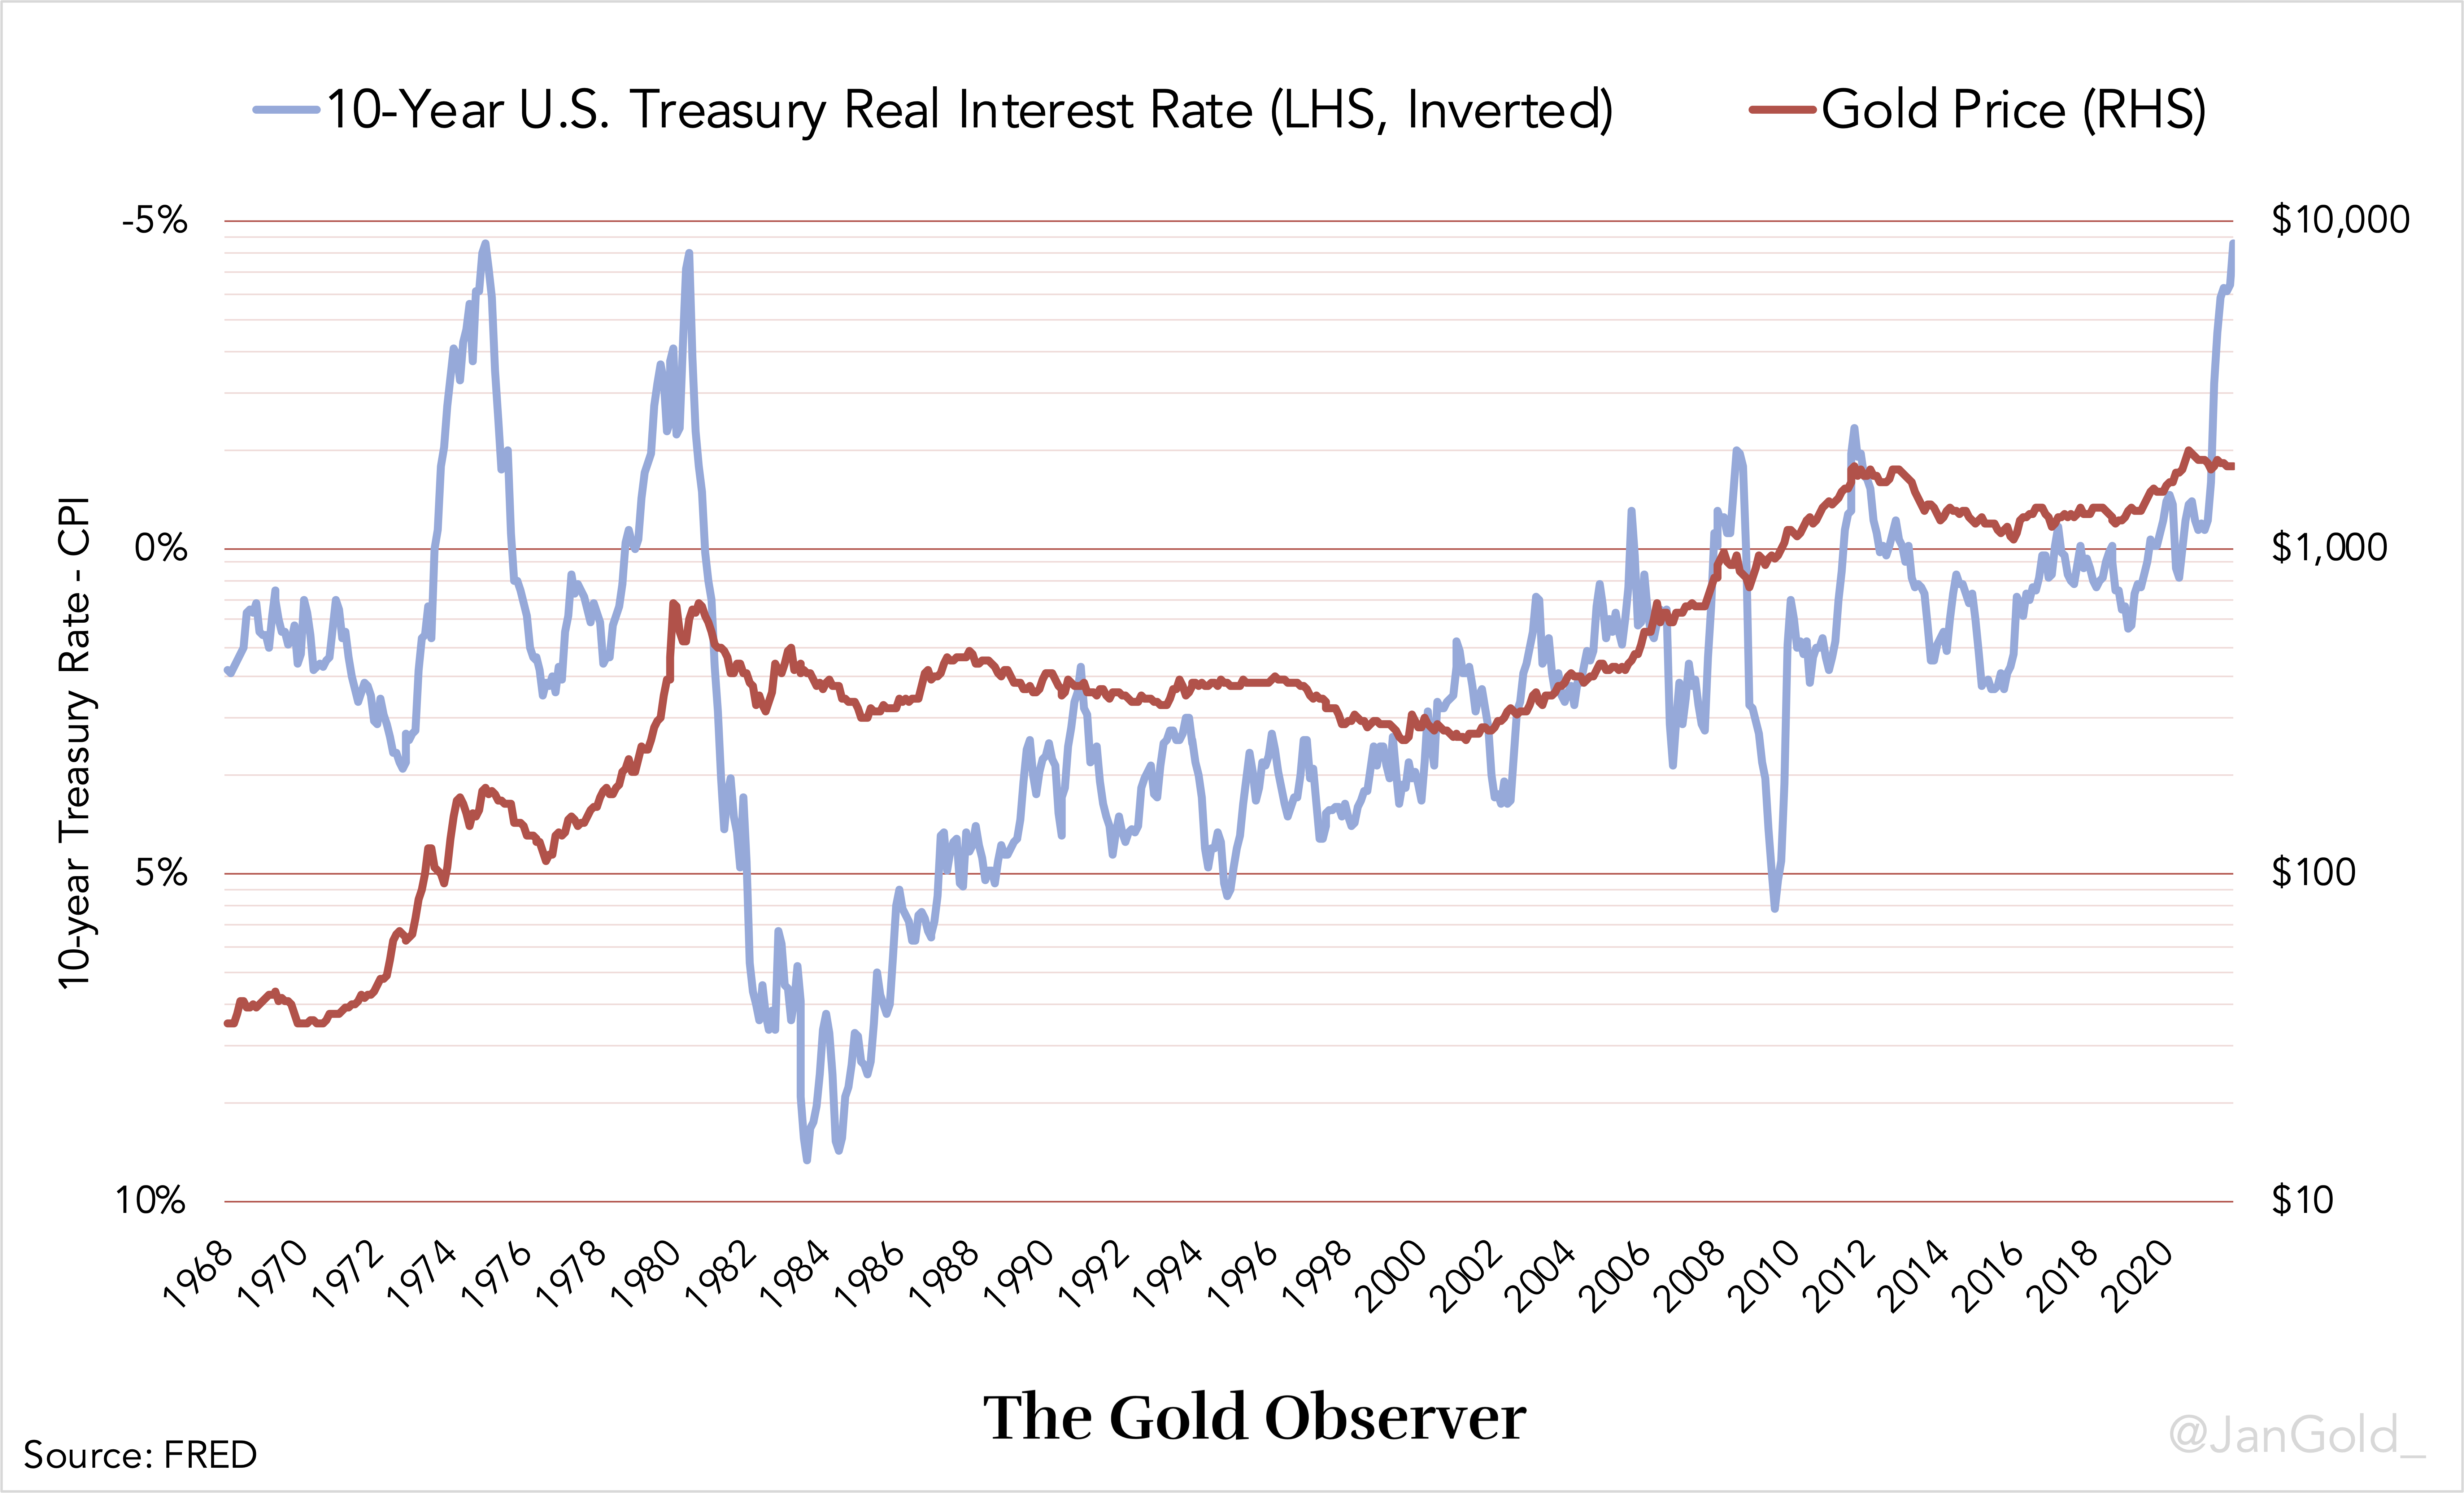
Obviously, (ex-post) real rates are very important to the gold price. In the 1970s gold skyrocketed when real rates for two times in a row hit -5%. Can it happen again if inflation proves not be transitory and real rates stay negative?
To find answers we will do a deep dive into TIPS bonds in part 2.
If you enjoyed reading this article please consider to support "The Gold Observer" and subscribe to the newsletter.
*Note, in this article I have addressed correlations without prove of causality.
Reproduction, in whole or in part, is authorized as long as it includes all the text hyperlinks and a link back to the original source.
The information contained in this article is for information purposes only and does not constitute investment advice or a recommendation to buy or sell.


