Written by Jan Nieuwenhuijs for The Gold Observer
A detailed analysis of the current gold pricing framework and why this framework is unsustainable.
In the current framework gold is priced based on the 10-year TIPS yield. In my view, the current framework becomes more nonsensical the longer the TIPS yield stays below zero. At the time of writing the TIPS yield is –0.74%.
Introduction
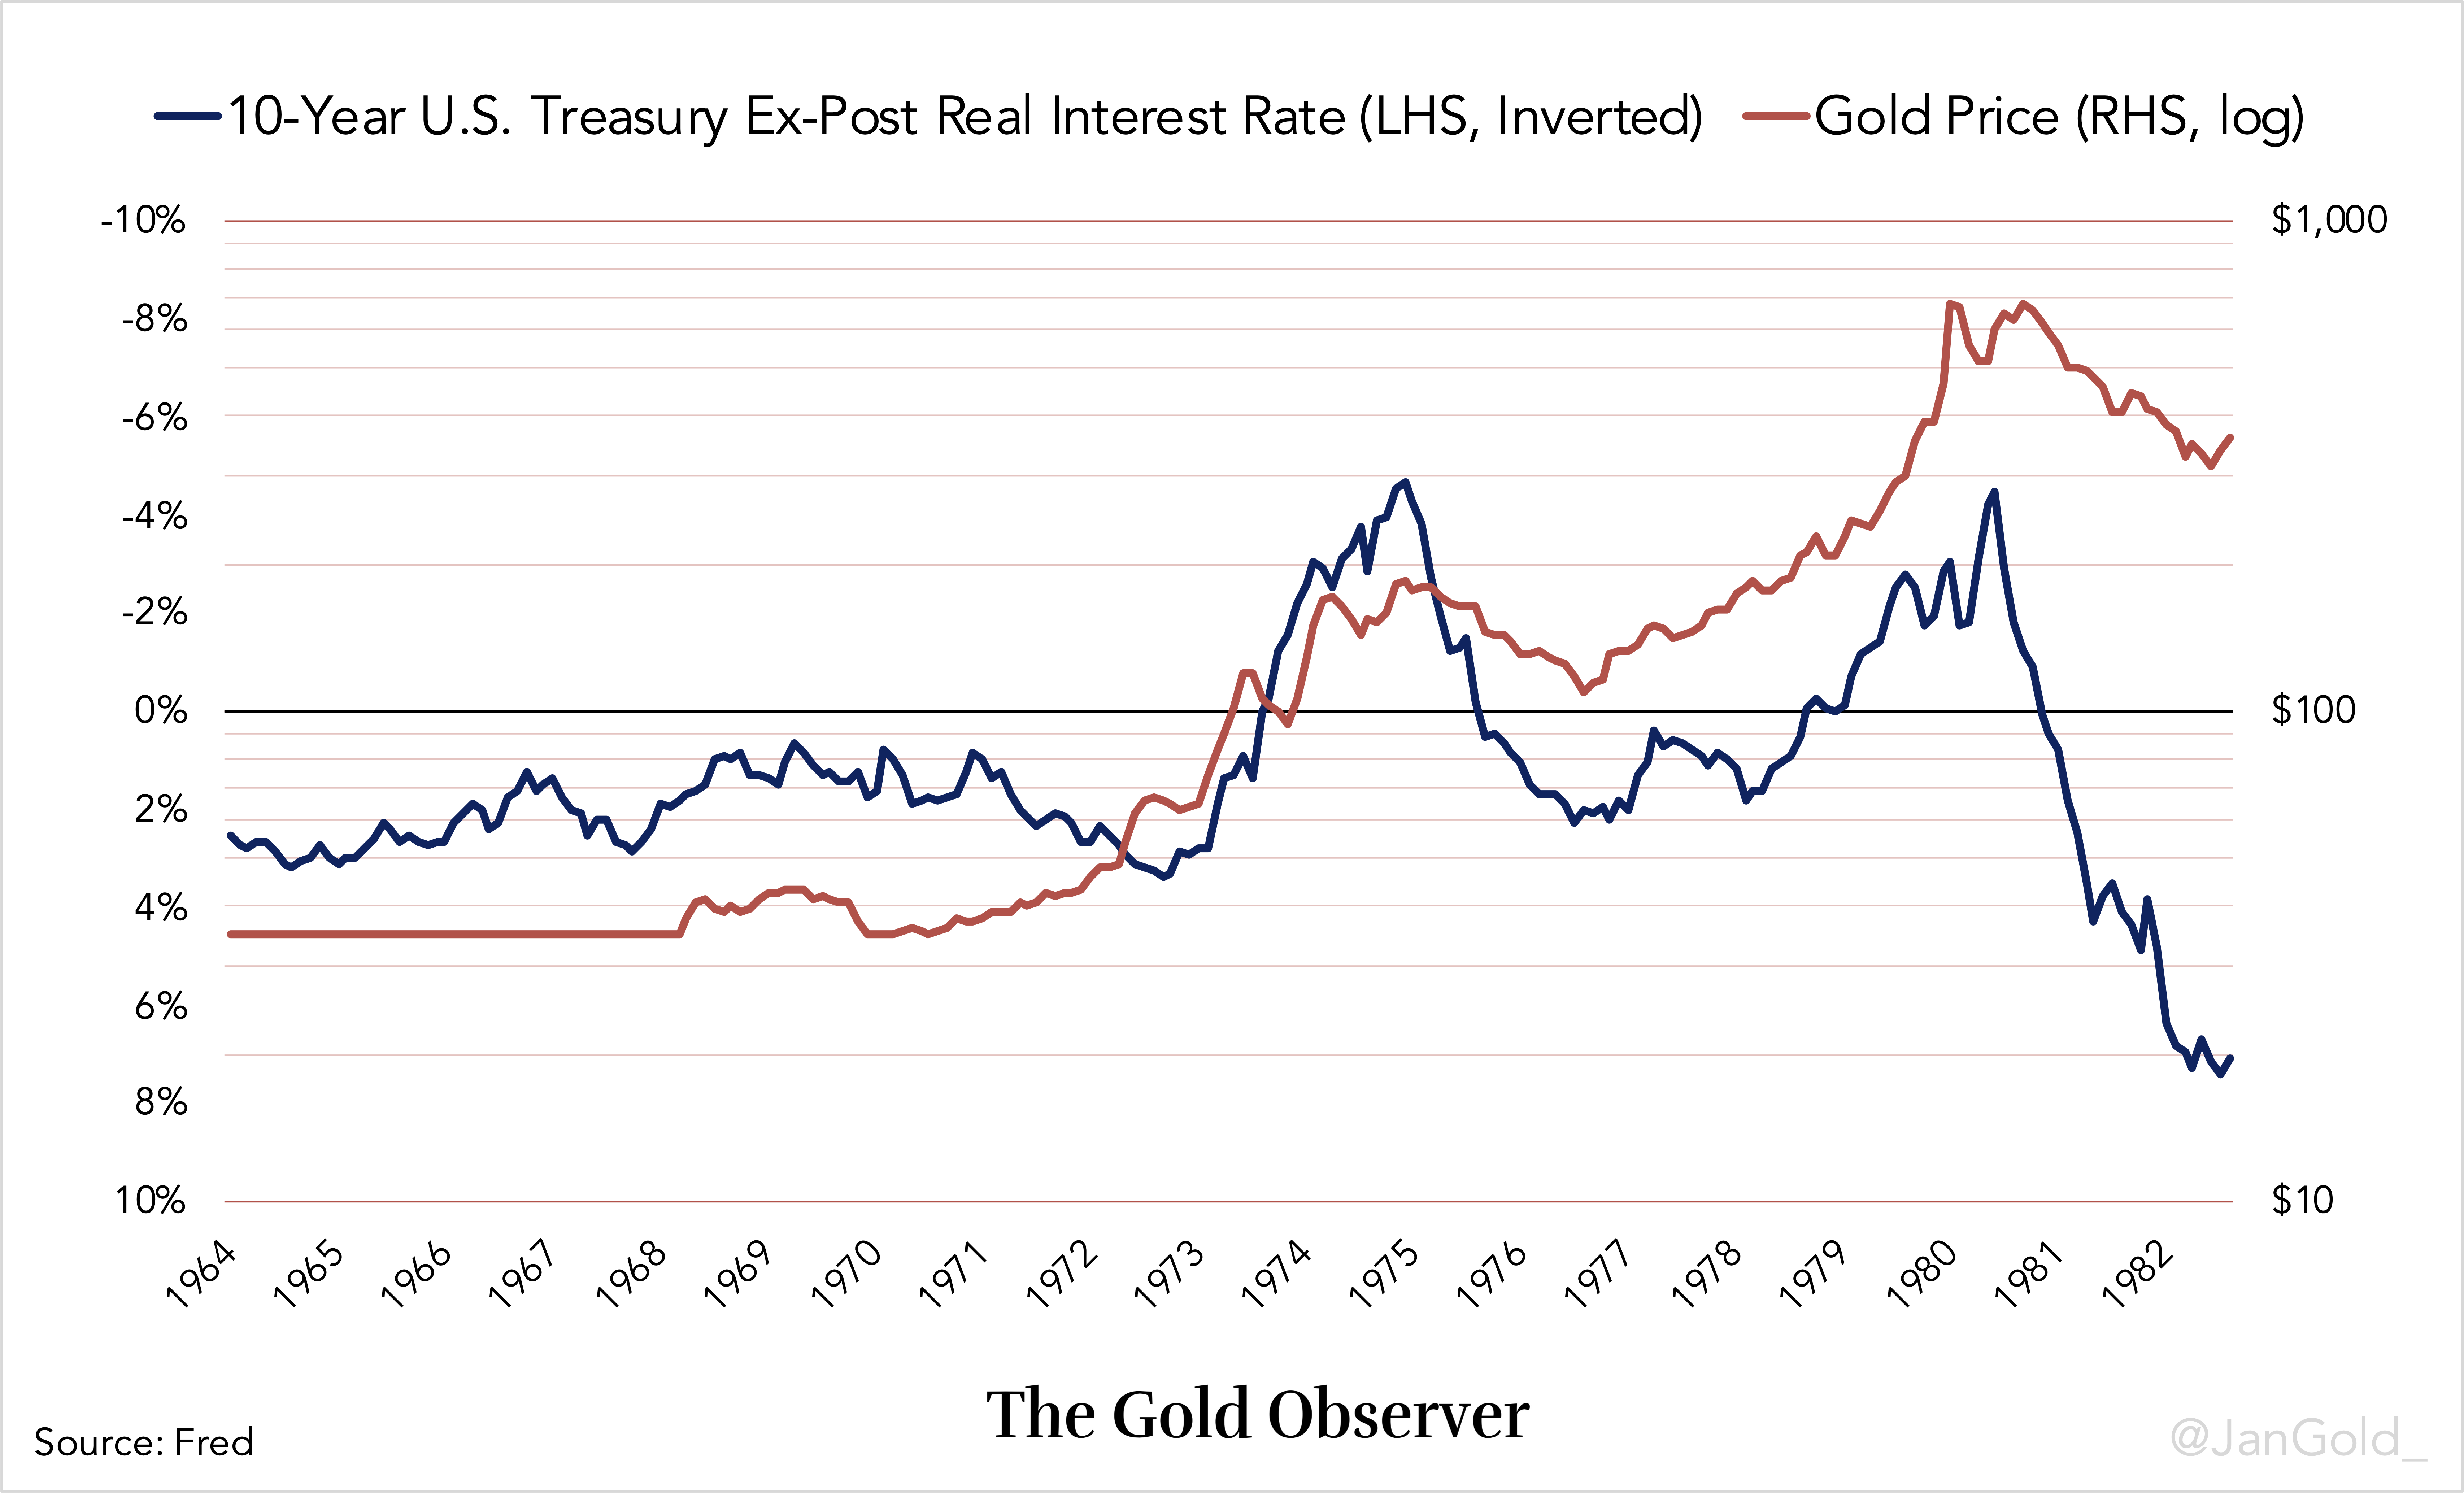
Part one was an introduction to the current gold pricing framework. We discussed that the gold price in U.S. dollar was inversely correlated to ex-post real interest rates (the nominal Treasury rate minus consumer price inflation) from 1968 until 2005, and since 2006 the gold price is inversely correlated to ex-ante real interest rates (the expected real rate measured by the 10-year TIPS yield).
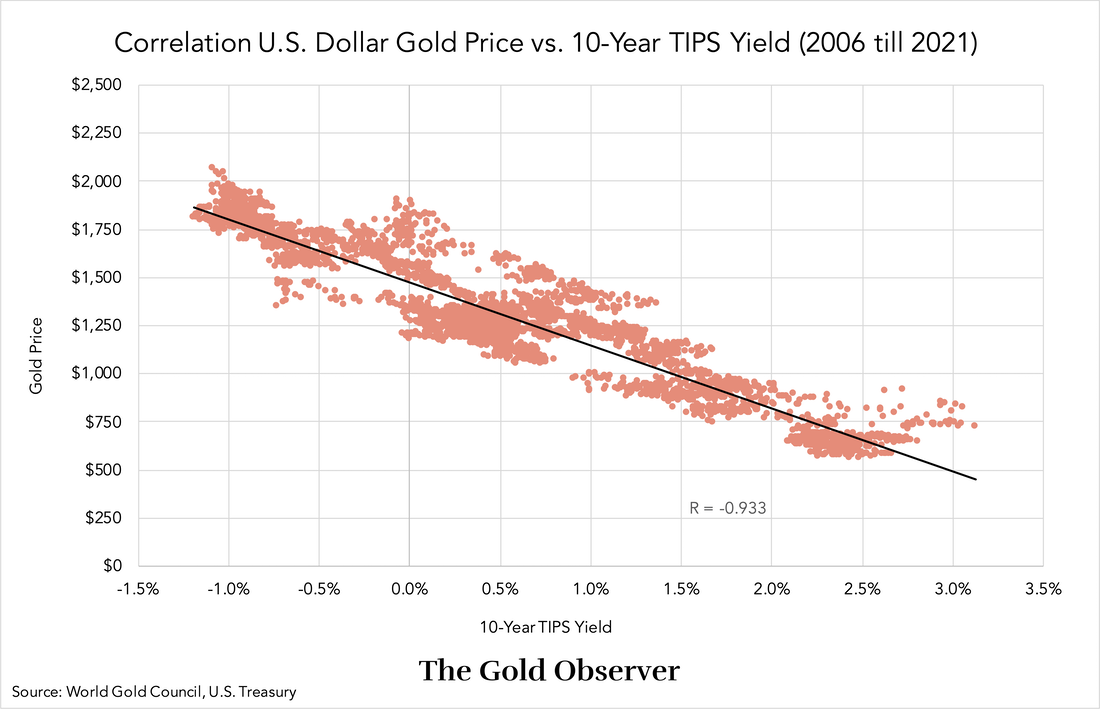
Causality between gold and the TIPS yield is hard to prove, but the correlation is very strong (correlation coefficient -0.933) and there is a “rational” narrative.

There are three stages worth addressing to understand the current framework. The first stage was during Bretton Woods when the dollar was said to be “as good as gold,” because it was pegged to gold at $35 per troy ounce. Shortly after the Second World War there was little doubt about the stability of the dollar. However, in the 1960s the market became worried about a devaluation of the dollar against gold, as the Americans printed too many dollars. There was a tradeoff for the market between holding gold—the only international reserve asset that can’t be arbitrarily devalued but didn’t yield—and holding U.S. government bonds (Treasuries), which did yield but were denominated in dollars. The Treasury interest rate and expectations of a dollar devaluation played a role in market’s decision to buy or sell gold.
The second stage began in 1968 when gold was allowed to float against the dollar in the free market. Investors fled to gold as a safe haven, driving up its price, when they expected consumer price inflation to rise (and ex-post real rates to decrease). When the Federal Reserve would raise rates and inflation declined (and ex-post real rates increased) investors sold gold, driving down its price. Hence, the inverse correlation between gold and ex-post real rates from 1968 until 2005. The Treasury rate and inflation expectations played a role in market’s decision to buy or sell gold.

After negative ex-post real rates in the 1970s the gold price didn’t fall back to levels when real rates were positive, which reflects the dollar’s debasement. For more charts see part one*.
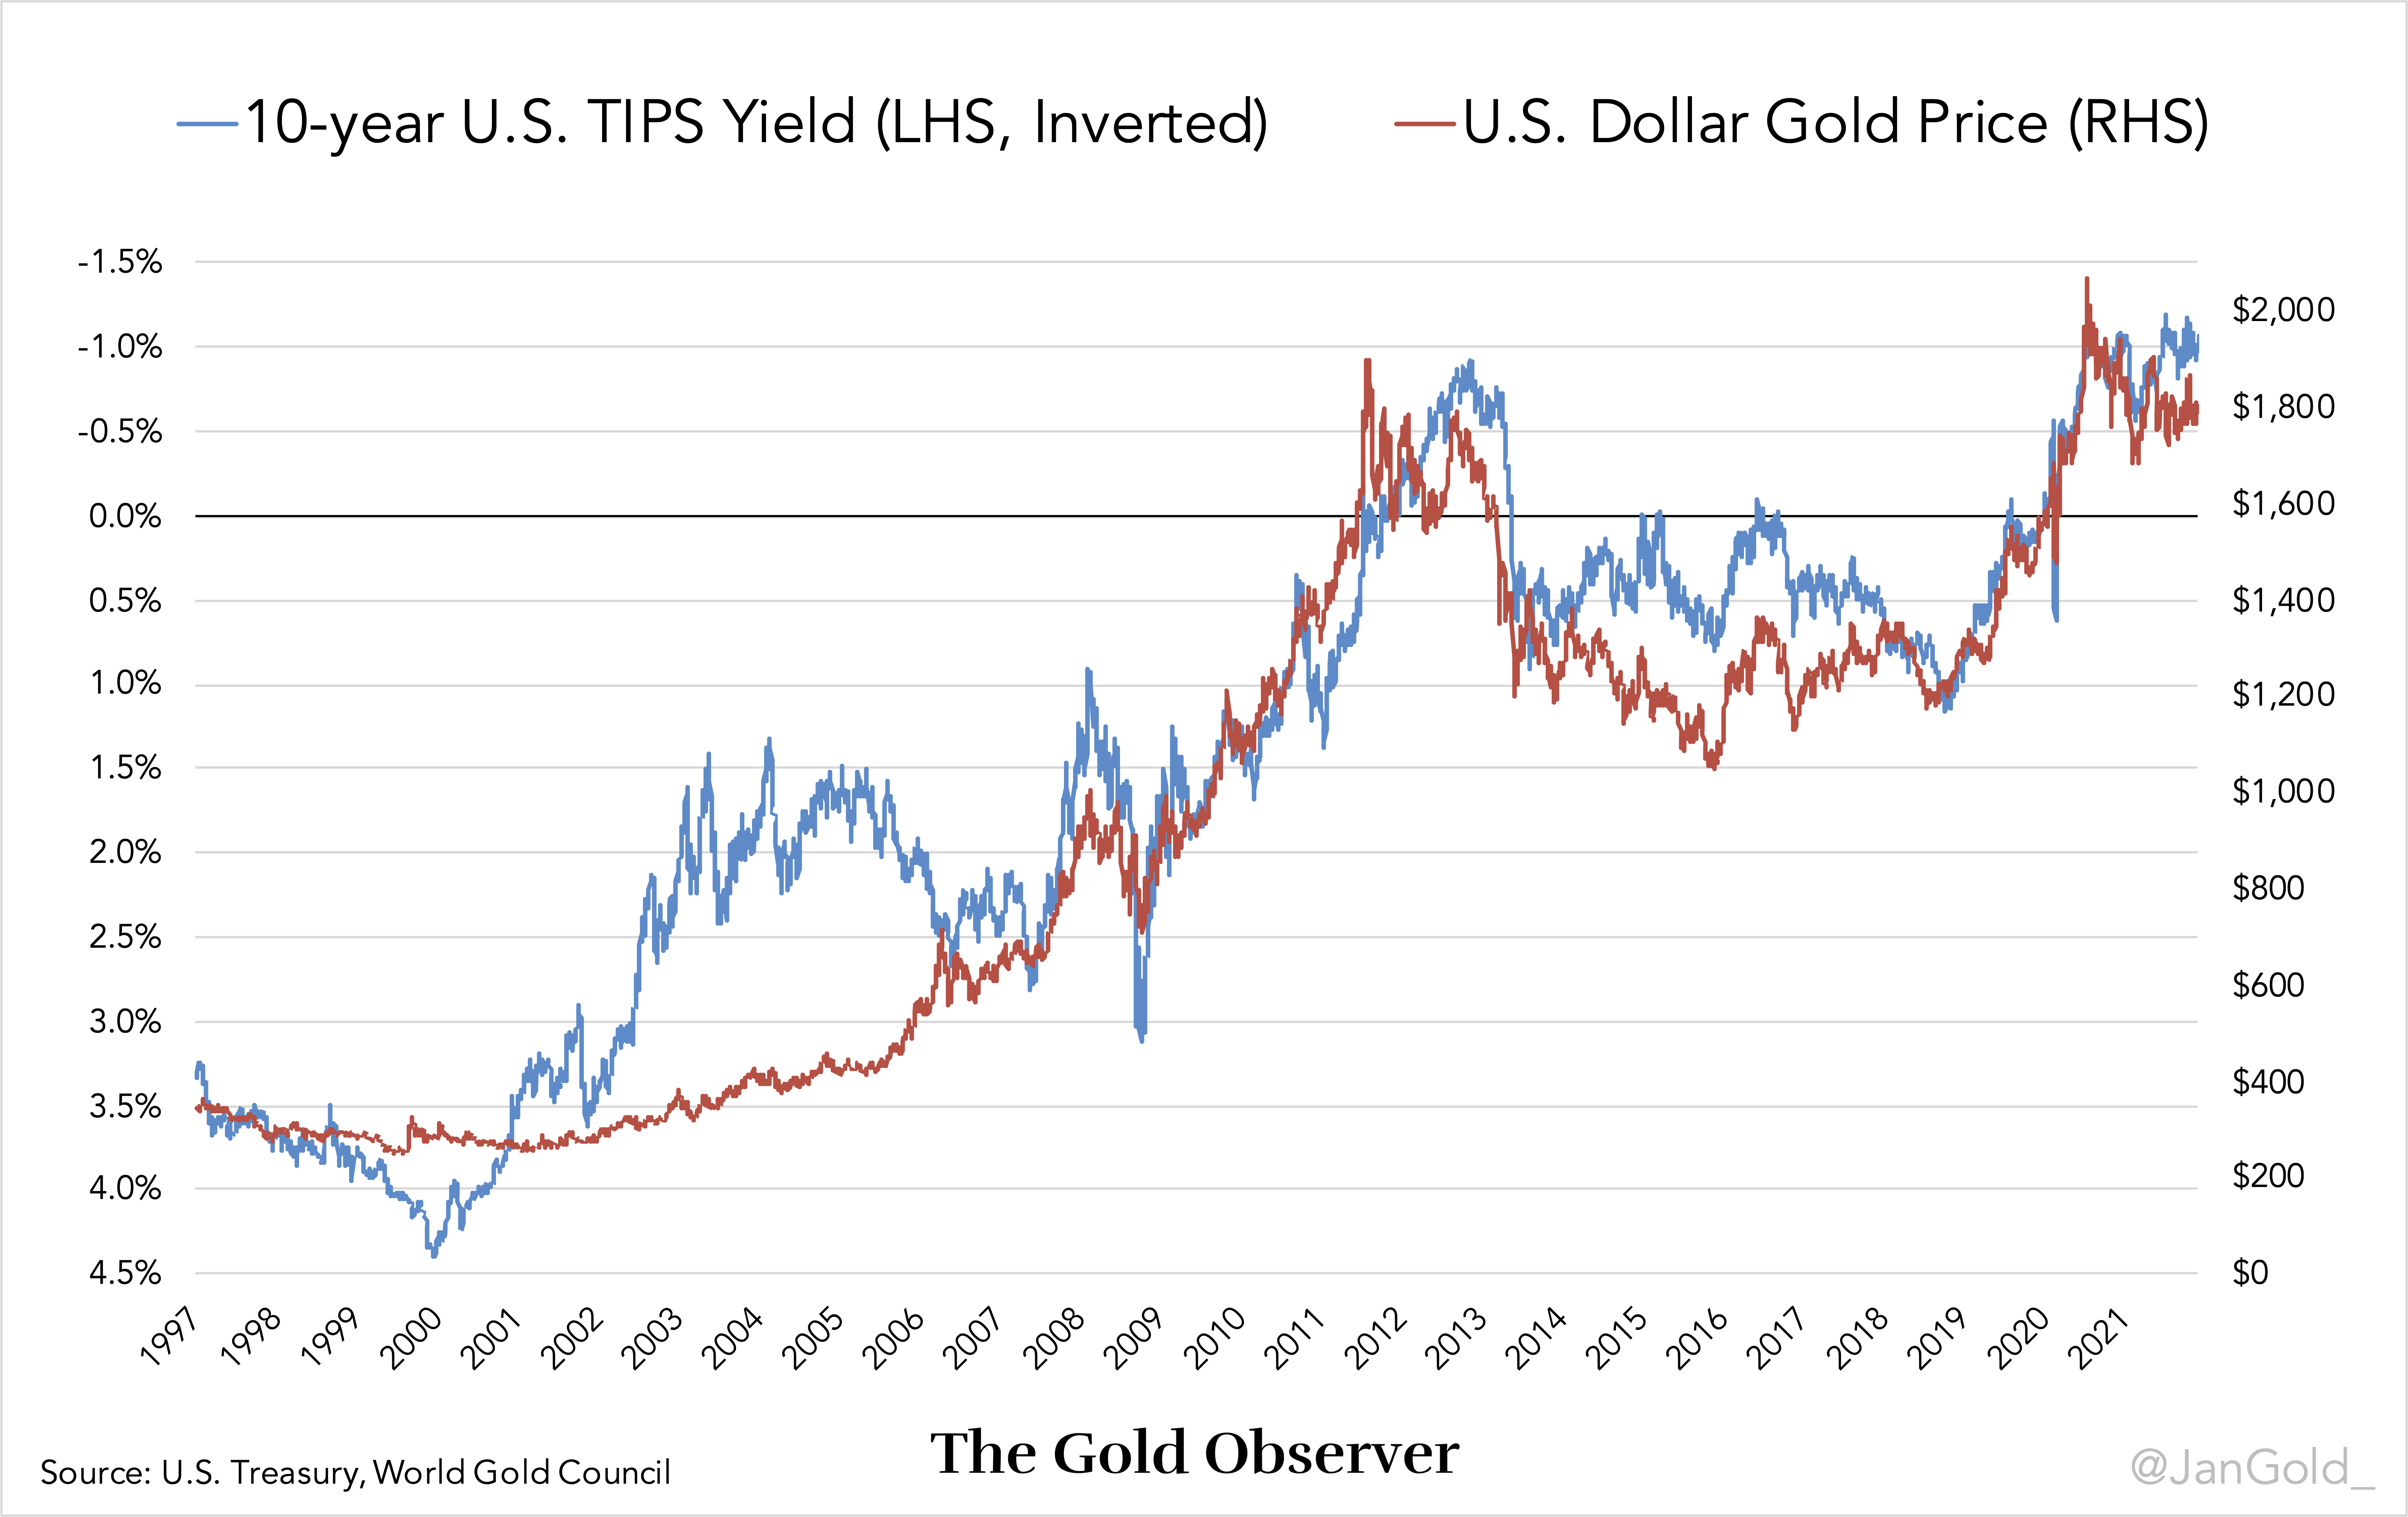
The third stage began in 1997 when Treasury Inflation Protected Securities (TIPS) were launched in the U.S., which gave birth to ex-ante real interest rates. A few years later, in 2006, gold became tightly correlated to the 10-year TIPS yield.
The TIPS yield is the expected real interest rate. The TIPS rate formula is:
Expected real interest rate = Treasury rate – inflation expectations
Put differently:
TIPS rate = Treasury rate – breakeven rate
A declining TIPS yield drives gold up; a rising TIPS yield drives gold down. The Treasury rate and inflation expectations play a role in the market’s decision to buy or sell gold.
To explain why I think the current framework is unsustainable we will have a closer look at the workings of TIPS bonds in the next chapter. If you already know the ins and outs of the TIPS bond market you can skip to the conclusion.
The Mechanics of TIPS Bonds
Let’s start with some bond market basics. According to renowned Treasury investor Lacy Hunt the standard for valuing nominal government bonds is the Fisher equation:
Risk free interest rate = real interest rate + inflation expectations
Put differently:
Treasury rate = real interest rate + inflation expectations
The Treasury rate is considered to be risk free because the U.S. government can print any amount of dollars needed to pay off its debt. The dollars returned can be worth toilet paper, but they will most likely be returned. Based on the Fisher equation investors decide to buy or sell Treasuries. (This is how it works in theory, in reality many financial institutions are forced by law to buy government bonds.)
A nominal Treasury with a maturity of 10 years and a coupon (interest rate) of 3%, will pay out 3% of the principal in interest annually and after 10 years the principal is returned. When inflation turns out to be higher than the lender expected, and he holds the bond until maturity, his return is diminished in real terms.
TIPS bonds “guarantee” the lender a real return. For example: an investor buys a 10-year TIPS note with a principal of $1 million dollars and a coupon of 2%. At every coupon payment the principal of the bond is adjusted for inflation, which adjusts the coupon payment as well. At maturity, the Treasury will return the lender $1 million dollars adjusted for 10 years of inflation. The TIPS bond investor has received 2% interest annually and the principal back, both in real terms (adjusted for inflation). So, why don’t all bond investors want to hold TIPS bonds?
Because TIPS bonds are compensated for inflation, the market will buy these securities, driving down their yields relative to nominal Treasury yields, until it’s indifferent between holding one or the other. That’s why the difference between the TIPS rate and the nominal Treasury rate is called the “breakeven rate.” Consequently, the breakeven rate reflects market-based inflation expectations. If the market expects annual inflation to average 1% over the next 10 years and the 10-year nominal Treasury rate is 3%, the 10-year TIPS yield will be priced at 2% (3% – 1%).
As the TIPS yield is seen as the (ex-ante) real yield, the TIPS bond formula is a rearrangement of the Fisher equation:
TIPS rate (2%) = Treasury rate (3%) – inflation expectations (1%)
Treasury rate (3%) = real interest rate (2%) + inflation expectations (1%)
In case the market’s inflation expectations appear to be accurate over the lifespan of TIPS bonds and nominal Treasuries of the same maturity, both have generated the same return. The main reason to hold TIPS bonds is because they outperform nominal Treasuries during unexpected increases in inflation. TIPS bonds are a hedge. Needless to say, nominal Treasuries outperform when inflation turns out lower than expected.
What happens if the TIPS yield is negative? First of all, it’s impossible to extract cash from bond holders periodically. In order to impose a negative yield, the buyer needs to pay a premium on top of the the principal up front. A higher price paid for a principal returned in the future is the same as a negative yield. If a 10-year TIPS bond yields –1% the buyer pays roughly 110% of the principal up front and is returned 100% in ten years’ time without coupon payments**. During the lifetime of the bond 100% of the principal is adjusted for inflation, but at maturity the investor has lost -1% per year in real terms.
Conclusion
Is the current gold price framework sustainable? Let’s test its own logic.
Below is a chart showing the inverse correlation between the gold price and the 10-year TIPS yield.

Starting in 2006, whenever the TIPS yield declined the gold price went up and vice versa. We must conclude that the market considers holding gold to be more attractive when real rates fall, because gold is the only international reserve asset without counterparty risk—gold can’t default.
A declining TIPS yield (the bond market expecting to earn less in real terms) is compensated by a rising price of gold. But strangely, the correlation doesn’t change when the TIPS yield enters negative territory. When the TIPS yield falls from –0.5% to –1% (the bond market expects to lose more in real terms) the gold price reacts the same as when the TIPS yield falls from 1% to 0.5%.
Even stranger, within the current framework, if the 10-year TIPS yield would stay at a constant –1% for years on end, the bond market is accepting to make heavy losses, but gold wouldn’t move at $1800 dollars per troy ounce. No compensation. This doesn’t make sense to me.
A final issue to contemplate has to do with the fact that the U.S. federal debt grows much faster than the above ground stock of gold. Over the past ten years the U.S. federal debt has doubled, but the above ground stock of gold has grown 17%. Now, consider that both in 2012 and 2022 the TIPS yield was –1%. So in 2022 the total expected loss of the Treasury market is twice as much as ten years ago, yet the gold price—the price of a quantity of gold that has grown 17% in 10 years—is the same as ten years ago. The current framework seems to be asymmetric.
It’s likely that the 10-year TIPS yield stays negative because the total debt to GDP ratio in the U.S. is at a record 370% (public debt to GDP is 120%). The U.S. government can’t allow nominal rates to go much higher in this environment. Meanwhile, printing money and supply chain issues have unleashed inflation.
I think that the longer the TIPS yield stays negative, the more likely gold will decouple and trend higher. Another important element to this is that bank savings accounts in many countries have a negative (ex-post) real rate for nearly a decade. As a consequence, people have embraced stocks and real estate as “the perfect store of value,” because these assets have continued to go up and pay a dividend or rent. Previously, I have written why I think these asset markets are in a bubble (here and here). Although, bubbles can last longer than you think, when they eventually pop, investors will be looking for an alternative store of value. Where to go when stocks crash and government bonds can’t offer a positive real return? Historically, gold has usually functioned as the asset of last resort.
Inflation is sky high but gold doesn’t move because institutional money is pricing gold based on the 10-year TIPS yield.
— Jan Nieuwenhuijs (@JanGold_) December 10, 2021
With the TIPS yield below 0 the correlation doesn’t make sense to me, but as long as stocks go up it will probably stick.
If you enjoyed reading this article please consider to support "The Gold Observer" and subscribe to the newsletter.
*I made a mistake in a chart published in part one, though the error has no analytical consequences. The percentages shown on the right-hand side axis in chart 5 (comparing consumer price changes year-on-year with gold price changes year-on-year) had to be multiplied by 10. The chart has been corrected.
**In reality the minimum coupon payment is 0.125%. For—I guess—technical reasons. When the TIPS yield is negative these coupon payments are discounted into the premium payed up front.
H/t Brain Romanchuk and Charlie Morris.
Sources
-
Alden, L. (2021) TIPS: Imperfect Inflation Defense
-
Choudhry, M. (2006) An Introduction To Bond Markets
-
Clark Neely, M. (1997) The Name Is Bond—Indexed Bond
-
PIMCO (2017) Understanding Treasury Inflation‑Protected Securities (TIPS)
-
Romanchuk, B. (2018) Breakeven Inflation Analysis
-
U.S. Treasury. TIPS In Depth
Original source: The Gold Observer
Reproduction, in whole or in part, is authorized as long as it includes all the text hyperlinks and a link back to the original source.
The information contained in this article is for information purposes only and does not constitute investment advice or a recommendation to buy or sell.


