To understand the price of gold, the relevant supply is the total supply, not the new supply coming to market during the last year, week or month. The supply of gold consists of all of the supply that exists, and the relevant demand is the total demand, not the new demand coming to market during any year. For gold, there is always a large stockpile, and it never gets smaller. The vast majority of all the gold mined throughout human history still exists and is held either in bars, coins, or jewelry. In most cases when a buyer purchases gold, it moves from the seller’s hoard to the buyer’s hold.
Exchange demand is expressed by giving up something in an exchange in order to obtain the thing demanded, and reservation demand is a demand that is expressed by holding onto something that you own. People who hold gold are demanding it by holding it off the market. Gold, unlike commodities, is not consumed, and therefore the traditional models and theories of supply and demand simply do not apply. Deficits or excesses do not, and cannot affect the market price, for the simple reason that nothing is consumed. In a sense, all that is happening in the market is that gold moves from one person’s stockpile (the mining company) to another person’s stockpile (the investor). There is no true consumption of gold in the economic sense; the stock of gold has been increasing throughout history but at a decreasing rate and now remains essentially constant, while ownership shifts from one party to another.
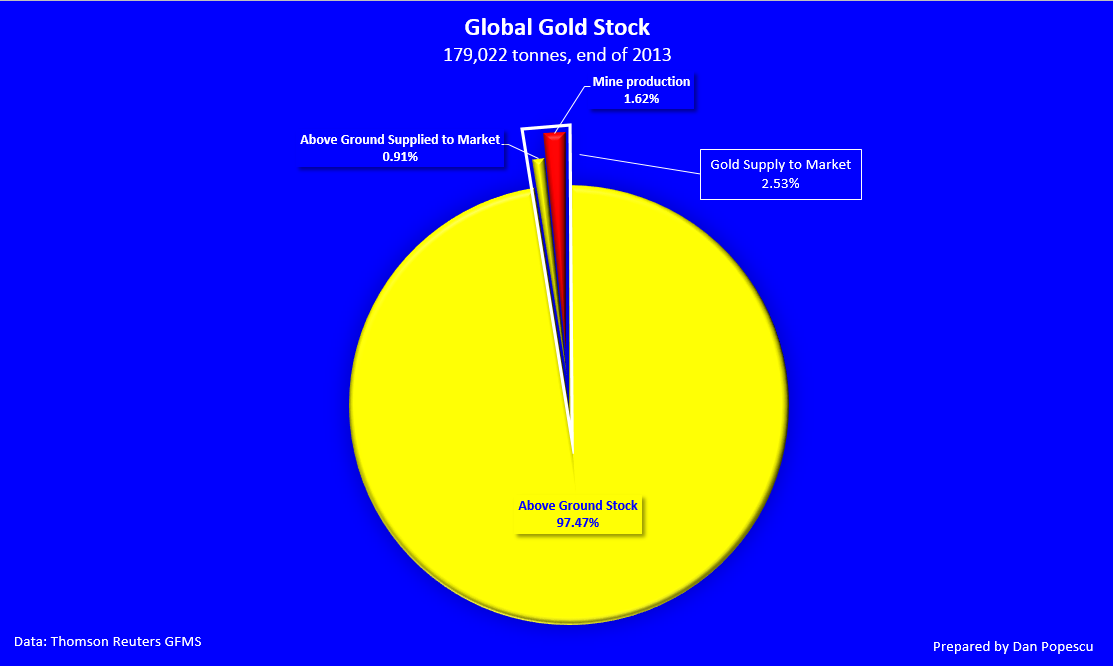
It is for this reason that I believe the stock of gold is very important to understand. If we accept the Thomson Reuters GFMS’ numbers of 176,000 tonnes of gold above ground, then the new gold (mine production) represents only 1.62% of the global gold stock and the gold market represents only 2.53% of the global gold stock (graph #1). More important is the fact that a large part of this stock can be brought to market on very short notice and at very low cost. Most of the gold is stored in its most natural form.
Graph #1: Global Gold Stock
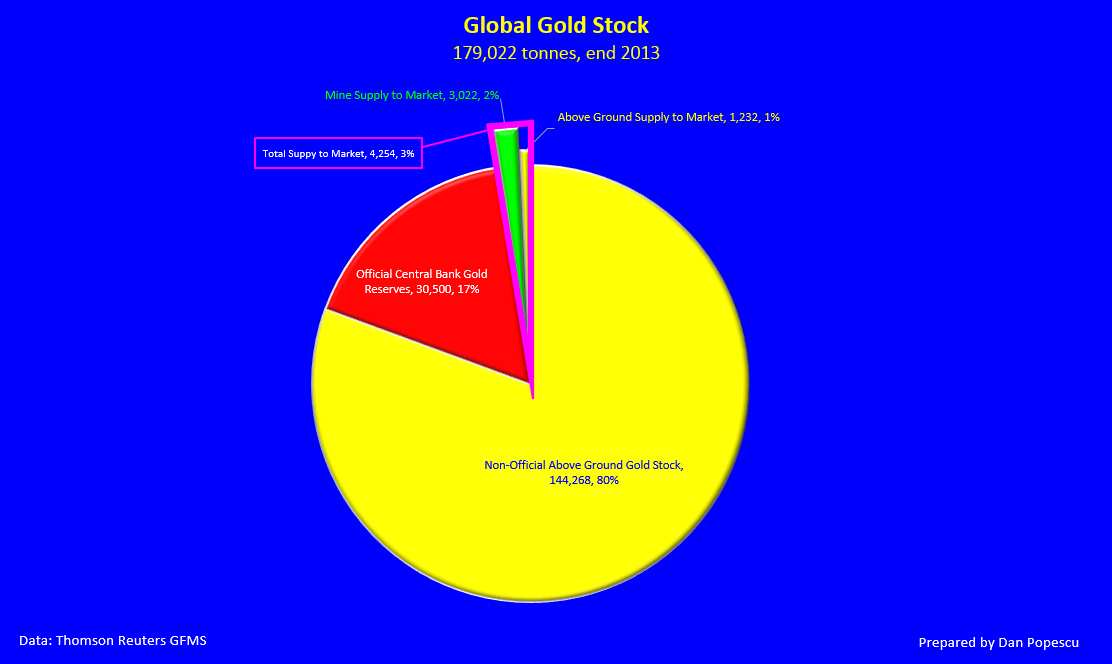
Approximately 20% of all the above-ground gold stock is under official control (graph #2). It is therefore evident why central banks have much more impact on the gold market than mining supply. Just the central bank gold stock is 7 times larger than the entire gold market. If accurate, the US official gold reserves are close to 2 times and the Euro Zone official reserves close to 2.5 times the entire gold market (graph #2).
Graph #2: Global Gold Stock
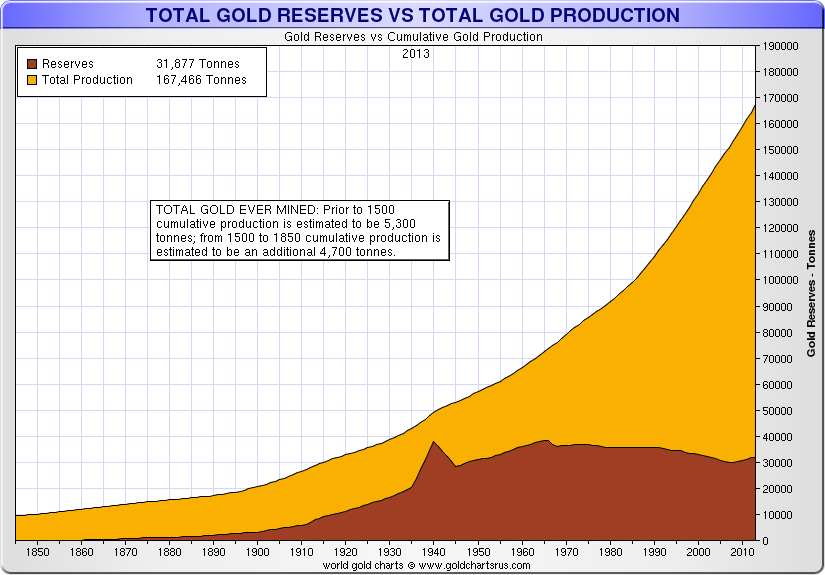
Let’s look now at the above-ground stock of gold. Do we really know how much there is? There is a number that has been used by the World Gold Council and, because of its excellent reputation, some have taken this figure as a fact. However, if we research a little, we find that this number is an estimate (statistical approximation) and has different margins of error, depending on the period we look at. According to Nick Laird, who has done an excellent research on the subject, 5,300 tonnes have been mined before 1500, 4,700 tonnes from 1500 to 1850, and the rest of 157,466 tonnes between 1850 to 2013 (chart #3).
Graph #3: Total Gold Reserves vs Total Gold Production
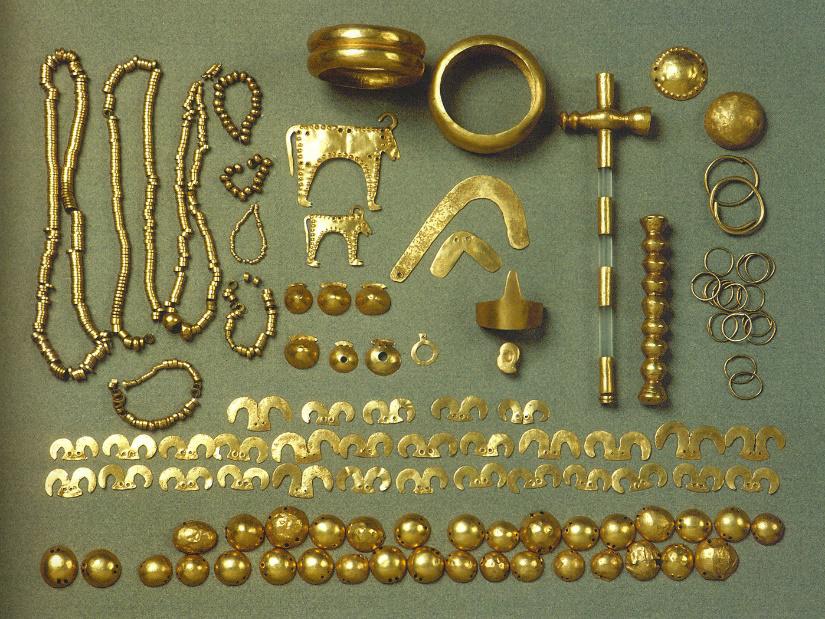
I had the privilege to see some of Nick’s methodology and I was impressed. His meticulous attention to detail and methodology in projecting data is above reproach. As you can see in graph #3, he splits the data in three parts: before 1500, 1500 to 1850, and 1850 to today. In my opinion, they all have different margins of error. The worst is the one before 1500. I would even split this period farther in two: before year 0 and year 0 to 1500. We know very little about mining gold before year 0. However, as the picture below shows, gold was mined and valued already 6,000 years ago.The Varna Necropolis is a burial site in the western industrial zone of Varna, Bulgaria. At this site was discovered the oldest gold treasure in the world, dating from 4600 BC to 4200 BC. This shows how far in history knowledge of gold goes and how long it has been mined. Gold has been accumulated for at least 6,000 years, and all over the world.
Picture #1: The oldest gold treasure in the world, Varna, Bulgaria – 6,000 years old
Remember also what we said above, that gold is not consumed. It is just passed from one owner to another. It doesn’t degrade with time either, so it’s possible that the gold used for my wedding ring was mined 6,000 years ago and who knows where. India’s passion for gold is time immemorial. India’s mines seem to have run out of gold when Europe was just being settled. Roman historian Pliny lamented, some 1,800 years ago, how India, the sink of precious metals, was draining Rome of gold, an appellation that resonates even today.
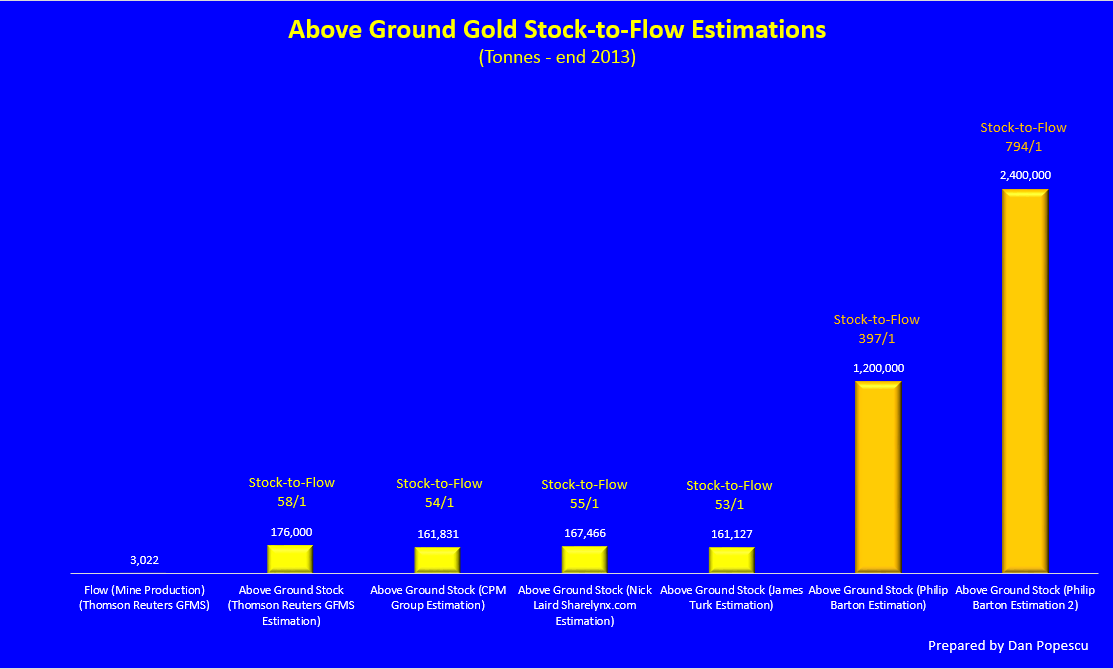
I put together some estimations that I consider as of a very good source but without having had access to the methodology. As you can see in graph #3, four of them average to about 166,606 tonnes, while Philip Barton of The Gold Standard Institute speculates this figure to be only 10% of the gold that actually exists above ground. His speculation is of 1,200,000 tonnes to 2,500,000 tonnes. How is it possible? Well, it all comes, in my opinion, to the period before 1500 and I think even more to the period between year 0 and 4000BC, and possibly even beyond that. Certain assumptions have to be made before we do any statistical approximation because we lack not some, but most of the data. If gold were a commodity it would not matter much since it would have been consumed, but gold is not. Not only that, but humans have gone through a lot of trouble to protect and conserve the stock of gold no matter how small, unlike any other possession. However, not just time is a problem but also space. There is very little information about gold mining in Asia and Africa between year 0 and 4,000 to 6,000 years ago. The “industry estimate” of above-ground gold assumes that if it takes modern methods a whole year to extract 2,400 tonnes then it would take far, far longer for more primitive cultures to extract the same amount of gold. Philip Barton challenges this theory, which assumes that all else was equal. He says that the farther back in history we travel, the more accessible and plentiful gold was. Our ancestors, according to him, mined all the easy gold in the world.
Graph #3: Above-ground Gold Stock-to-Flow Estimations
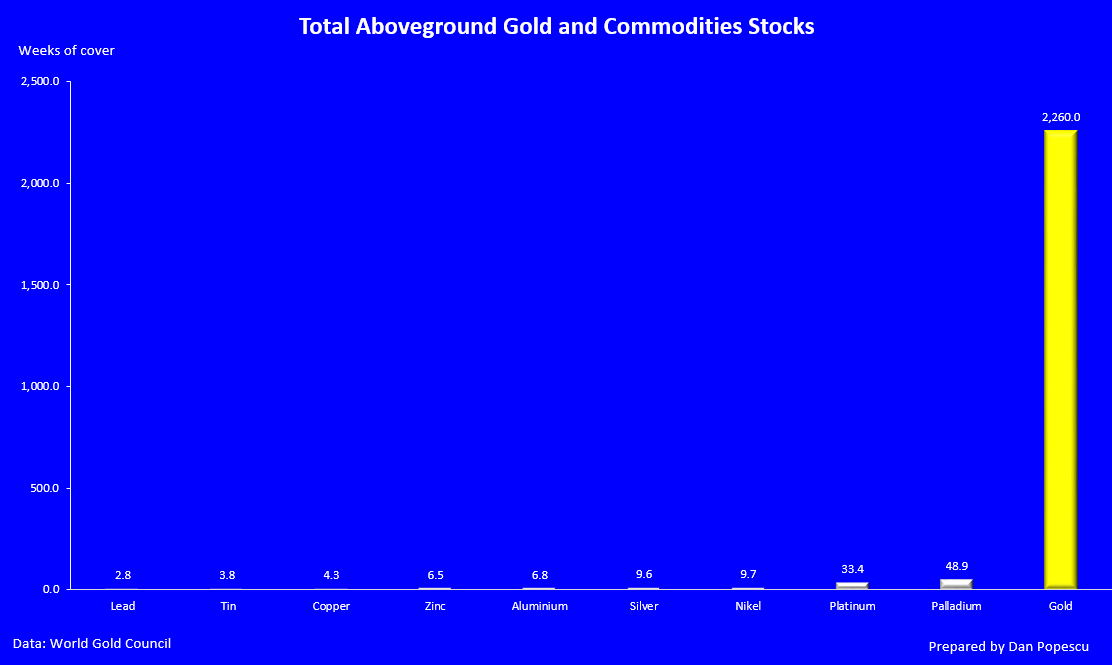
Taking the average estimate of 166,606 tonnes, the total above-ground gold stocks could cover approximately 43 years of demand. If we assume Philip Burton’s more conservative estimate of 1,200,000 tonnes, then it would cover approximately 290 years. Looking at graph #4, we can understand why gold is not a commodity.
Graph #4: Total Above-ground Gold and Commodities Stocks
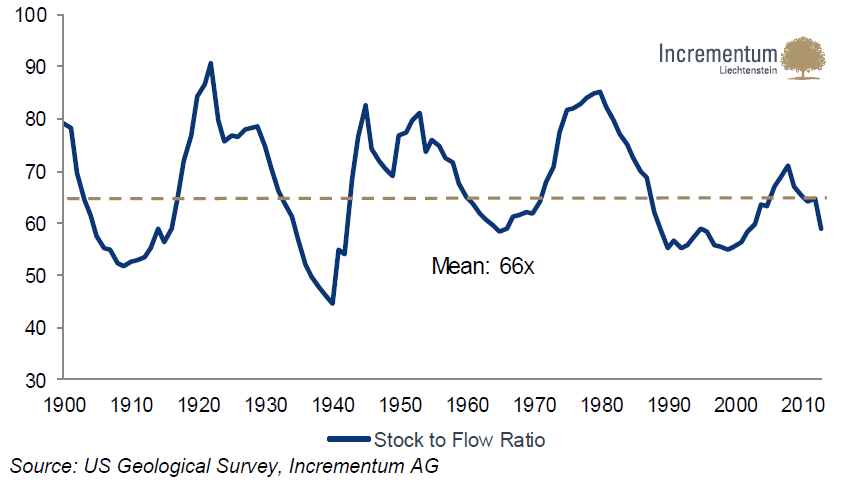
In graph #5, we can see that gold’s stock-to-flow has fluctuated between 45 and 90, with a mean of 66, for the last 100 years. Gold is one of the most liquid of all assets. Some analysts consider that up to 86% of global above-ground inventory could theoretically be mobilized in a relatively short time. However, the extent to which all of this gold can be considered “free float” is debatable. In financial markets, liquidity means the size of trade that can be executed without affecting the price.
Graph #5: Gold Stock-to-Flow Ratio
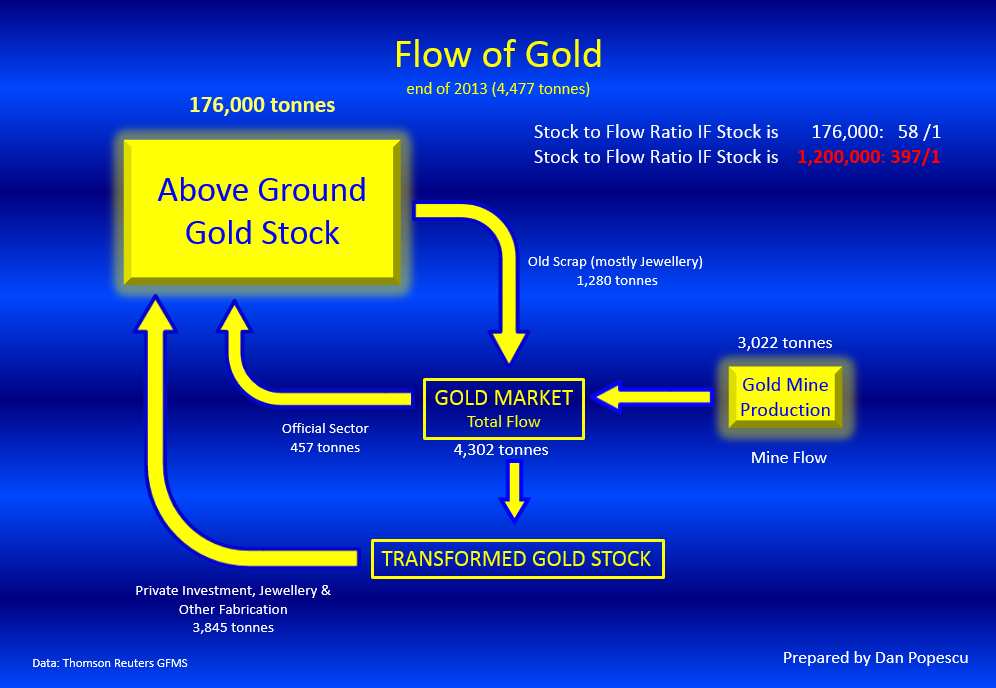
I also created a flow chart to show, from a different angle, the importance of the above-ground gold stock. Unfortunately, it is not to scale. The above-ground gold stock box should be 41 times bigger than the gold market and 58 times bigger than the mine supply if we use the 176,000 tonnes estimation.
Graph #6: The Flow of Gold
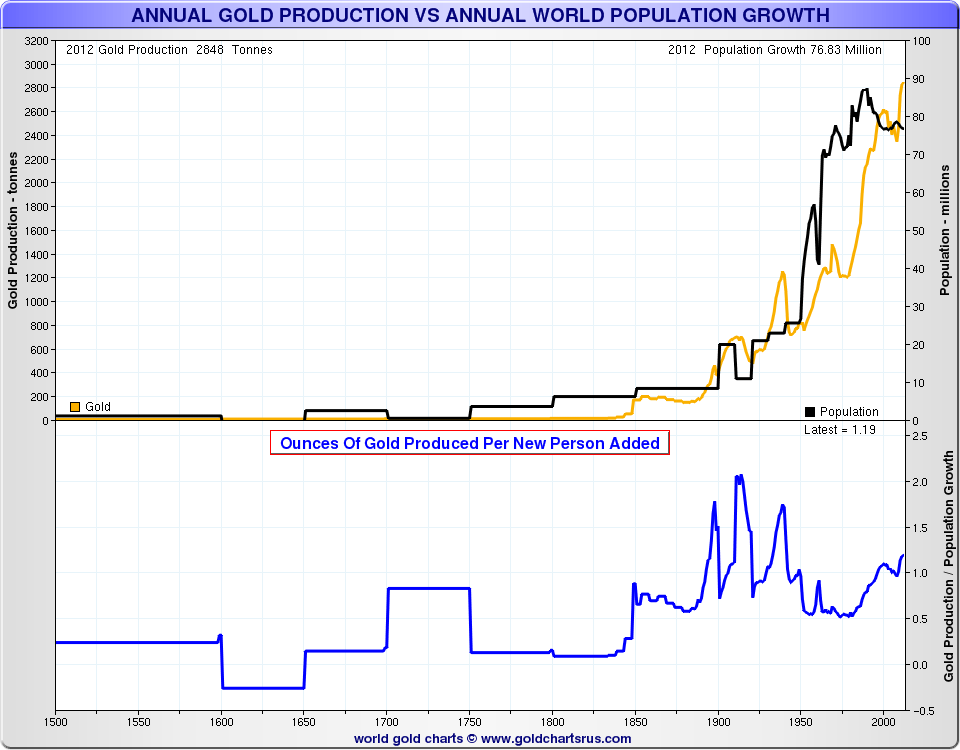
The 176,000 tonnes comprising the world’s gold money stock is gold’s M3. James Turk from GoldMoney compares the above-ground gold stock to the US paper money supply M3. Gold’s M3 grows approximately at the same rate as world population and new wealth creation (graph #7), which are key components critical to determining the supply and demand for money. When M3 grows faster than gold’s M3, the former is being debased, and the price of gold in that currency will rise, assuming demand for both gold and the currency remain unchanged.
Chart #7: Annual Gold Production vs Annual Population Growth
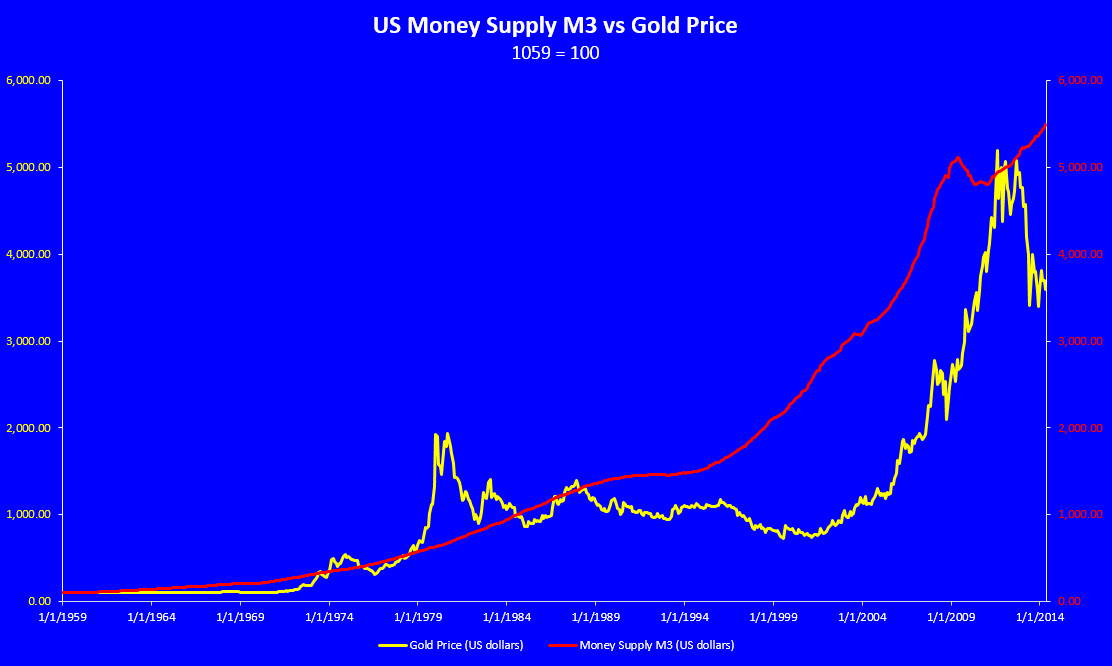
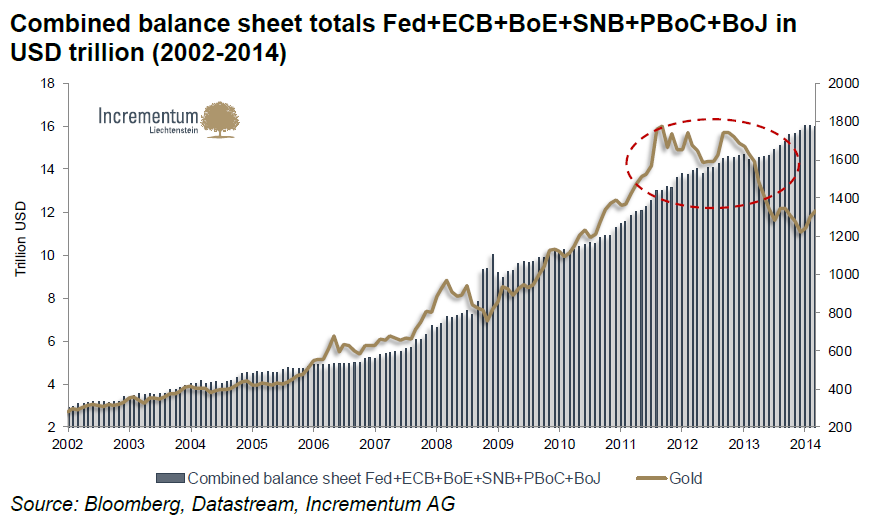
In graph #8, we can observe that the US money supply, at least since 1959, correlates closely but not perfectly to the price of gold in US dollars. A more appropriate comparison would be to compare global M3 to gold, since gold is universal hard money (graph #9).
Graph #8: US Money Supply M3 vs Gold Price
Graph #9: Combined Balance Sheet Totals vs Gold Price (US, Euro Area, UK, Switzerland, China, Japan)
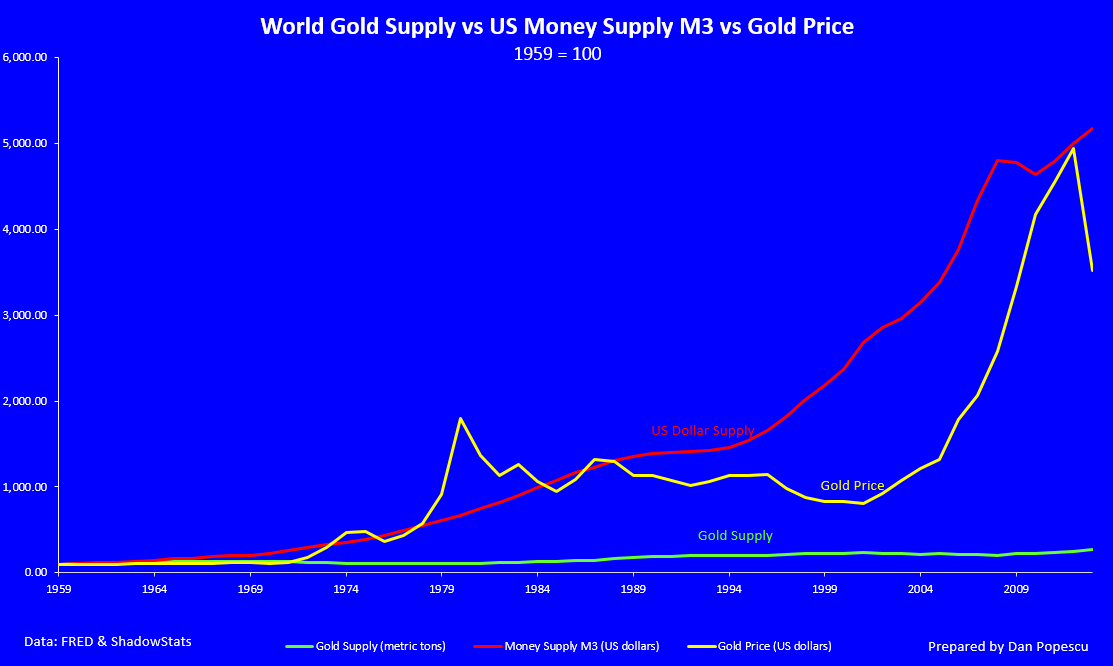
Graph #10 shows the trend of gold supply vs US dollar supply and the ratio between the two. As the supply of dollars increases while the supply of gold remains almost constant, the price has adjusted to compensate for the difference in supplies.
Graph #10: World Gold Supply vs Money Supply M3 vs Gold Price
One of the most frequent and common arguments against gold as money has been that there is not much of it. In a recent report, the Official Monetary and Financial Institutions Forum (OMFIF) states that “there are also limiting influences, partly reflecting the limited availability of gold” for gold to play a major role in the future multi-currency reserve system. The OMFIF says, “Financial market gold amounts to about 60,100 tonnes. Unless one assumes a major shift from jewelry/industry demand to financial use, gold reserves remain mainly a zero-sum game, with the only increases coming from new mining (approximately 2,500 tonnes per annum) and from recycling (slightly less than 1,600 tonnes per annum). This amounts to an increase in available gold stocks of just above 4,000 tonnes per annum, or 6.7% of financial market gold. Net buying by official institutions of 400 tonnes of gold in 2011 (around one-tenth of the annual increase in gold supply) was the largest volume of net purchases in four decades.” The report also says “The (relative) scarcity of gold means that it could only ever replace a fiat currency on a fractional basis. However, even such a system is unlikely.” (7)
As we have seen above, both by conservative figures and more liberal projections, there is plenty of gold, and mostly above ground. Some argue that it is a store of stable value over time because of its high stock-to-flow ratio. However, high marketability is an important characteristic of gold. The easier a good can be converted, the more pronounced its “moneyness”. Gold and silver did not attain their monetary status due to their alleged scarcity, but rather due to their superior marketability. Fungibility is a crucial advantage of gold as a medium of exchange. Fungibility is the property of a good or a commodity whose individual units are capable of mutual substitution. For example, since one ounce of gold is equivalent to any other ounce of gold, gold is fungible. Because gold is accumulated and not consumed, it is the least rare metal on the planet. (6) Even though the new supply is very small, its stock never gets smaller but rather increases, even if very little, every year (1.62% per year or 0.25% per year, using Philip Barton’s lowest estimate of 1,200,000 tonnes).
Another way of measuring the above-ground stock of gold would be to inventory all the gold in public and private possession. No government has been able to do that or has even tried; not even the totalitarian ones. Even in countries where gold possession by individuals was restricted, gold was still circulating underground. I have witnessed it personally behind the Iron Curtain in the 1960s. The gold market is an extremely opaque market. When the government of India recently indicated a desire to inventory gold in temples, it had to back down under extreme public pressure. After 40 year of studying gold, I tend to believe/speculate there is a lot more than 166,606 tonnes. How much? I don’t know. Based on available information, the 166,606-tonne figure seems to be the most accurate. However, the 1,200,000 figure wouldn’t surprise me at all. As Philip Barton says it so well, “No claim to precision can be made with regard to the amount of gold in the world. All that can be done is to try to arrive at an educated approximation, based on such vague evidence as is available.” (2)
Bibliography:
-
How Much Gold Stock is There Really? - Philip Barton, The Gold Standard Institute
-
The Aboveground Gold Stock: Its Importance and Its Size – James Turk
-
E-mail Exchange between Nick Laird, Sharelynx.com and Philip Barton, The Gold Standard Institute
-
Gold, the renminbi and the multi-currency reserve system, OMFIF
-
In Gold We Trust 2014 - Ronald-Peter Stoeferle& Mark Valek, Incrementum AG
Reproduction, in whole or in part, is authorized as long as it includes all the text hyperlinks and a link back to the original source.
The information contained in this article is for information purposes only and does not constitute investment advice or a recommendation to buy or sell.
