In his book Fractals, Chance and Finance, mathematician Benoît Mandelbrot uses as his cover image a naturally sculpted gold object called the “Golden Bush". This magnificent object of nature, kept in the National Museum of Natural History in Paris, was designated by Benoît Mandelbrot as a sufficiently perfect natural illustration of fractals. Now, more than a decade after the mathematician's death, the use of fractals remains restricted in the scientific or literary world. However, the usefulness of fractals as a mathematical tool in forecasting and investment decisions is absolutely significant. After introducing the concept of fractals in this article, we will focus on the question of whether or not the price of gold is indeed time dependent. In other words, whether the trends observed in the price of gold can be explained by the time they occur. The case of gold is extremely interesting because, beyond the symbolism intended by Benoît Mandelbrot, fractals are very relevant to the study of gold prices.
In this article, we will show that the price of gold behaves in a way that is independent of time.
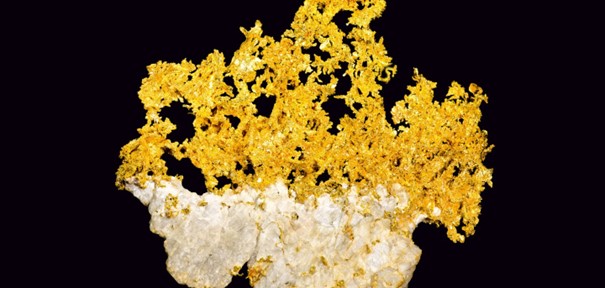
Source : The Golden Bush| National Museum of Natural History (mnhn.fr)
Understanding fractals
Fractals are often misunderstood by the public. This can be explained by the simple fact that fractals illustrate a new and recent concept in history. Nevertheless, the public's understanding of fractals is often limited by the complexity of the explanations of scientists and specialists. Even so, fractals can be defined quite simply. In mathematics, as will be explained here, fractals can be summarized as "simple" division.
In finance, fractals refer to the repetition of similar price patterns on progressively larger or smaller time scales. For example, if a bullish wave is composed of three ascending and two descending peaks over the course of a day, then it is quite possible to see the same pattern repeated over a decade.
Fractals are intimately linked to the cycles that founded Benoît Mandelbrot's thinking and research. An asset for which price cyclicality is strong will also be an asset for which fractals will be marked (the repetition of price patterns will be high). Once we have grasped this, we can say to some extent that fractals are the expression of a constant order in time. Fractals arise from an amplification (or reduction) between movements observed on a rather short time scale and movements at work on a longer time scale.
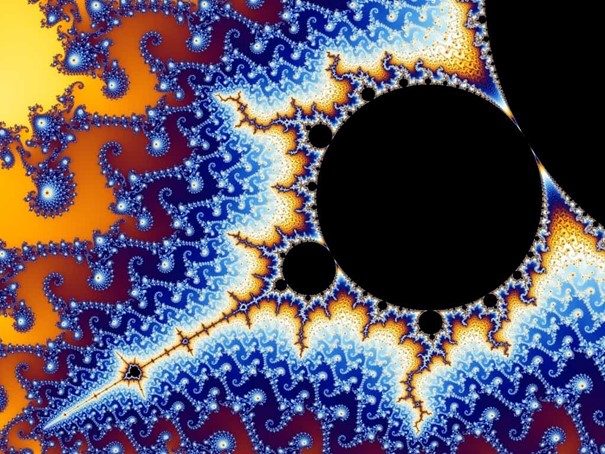
Example of the Mandelbrot fractal (repetition of graphic figures): Definition | Fractal | Futura Sciences (futura-sciences.com)
Once this definition is established, it is much easier to understand fractals. In mathematics, the fractal degree of an asset is measured using the Hurst coefficient (between 0 and 1). Thus:
- If the Hurst exponent is equal to 0.5, then the price of gold progresses independently of the passage of time (the price of gold is not fractal).
- If the Hurst exponent is greater than 0.5 (and especially 0.6); then the price of gold progresses in a time-dependent and amplified manner (the asset is fractal).
- Conversely, if the Hurst exponent is less than 0.5 (especially 0.4), then the price of gold increases in a time-dependent and reduced manner (the asset is fractal, but more difficult to read).
Measure of the (historical) volatility of the price of gold
We first calculated the volatility on a monthly basis of the price of gold in order to calculate the sensitivity of the price of gold to fractals. The data sample spans from January 2000 to September 2022, which is equivalent to a period of 261 months.
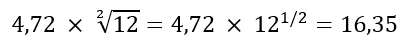
Using the volatility calculation (read more), we obtain that the monthly volatility of the price of gold between January 2000 and September 2022 is 4.72%. Furthermore, the average monthly performance of the price of gold is +0.84%. These data at our disposal are essential for measuring fractals. Let's then start our analysis without paying attention to all the technical aspects...
If the gold price is not subject to fractals, then we can use probabilities to imagine what will be the annual volatility of gold. In effect, Benoît Mandelbrot's hypothesis, which is the basis of the discovery of fractals, is to make the hypothesis (in mathematics) of non-stationarity. That is to say, the distribution of variations in the price of gold in the past is independent of time in the present. But this does not correspond to anything real in the real world...
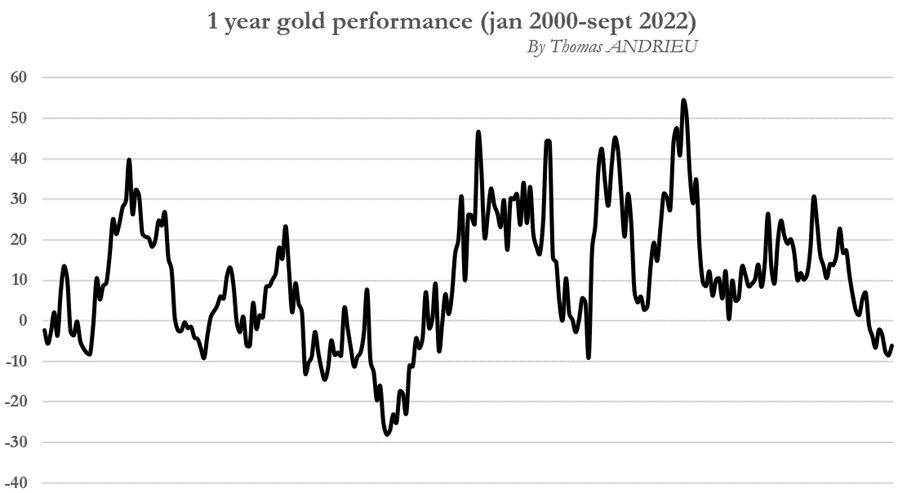
From then on, we try to calculate the (theoretical) annual volatility of the gold price by assuming that the evolution of the price of gold is independent of time (we annualize the volatility according to the theory of stationary probabilities). We then obtain that the (theoretical) annual volatility of the gold price is 16.35% between January 2000 and September 2022. As an illustration, we have represented below the one-year performance of the price of gold between 2000 and 2022. The last major performance record was set in 2006. Since then, we have entered a new cycle of falling gold performance that may end soon.
For the technical aside, we mentioned the (optional) detail of the calculation below. The observed monthly volatility is multiplied by the root of the number of months in a year to get the annualized volatility. The determining parameter in this equation is the exponent ½ (which is really the Hurst exponent), this is what defines the fractals of an asset. But we pose here ½ according to the stationarity hypothesis, we will come back to it later...
Gold and fractals
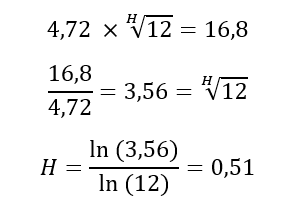
Now we only need to measure the actual observed annual volatility to finally know if the gold price is time dependent on a medium term scale. Over the period January 2000 to September 2022, the observed annualized historical volatility is 16.8%. It is therefore different (by a small margin) from the calculated theoretical volatility of 16.35%. Since the difference between the theoretical and observed volatility is small, we can expect the fractals to have little influence in the medium term (the Hurst coefficient is close to 0.5).
In the details of the calculation (optional), we seek to solve the equation that allows us to obtain the value of H, i.e. the exponent that transforms the true monthly volatility into annual volatility. Using the general formula stated by Benoît Mandelbrot, i.e. ln(P)/ln(t) where P is the variation in prices from one period to the next and where t is the time elapsed, we obtain that the value of H is 0.51.
As a result, the Hurst coefficient that measures the fractal degree of an asset is relatively very close to 0.5. This means quite clearly that the evolution of the gold price is relatively independent or almost independent of the passage of time. But can we globally affirm that gold is not sensitive to cycles and to the evolution of time?
The importance of time frames...
But to write it like that... Gold has not had the last word. If gold is independent of time in the medium term (from monthly to annual), this is not mechanically the case for other time frames. The same methodology was applied using rigorously weekly gold price data between January 2000 and September 2022.
The weekly volatility of gold measured between January 2000 and September 2022 is 2.32% . Therefore, it is possible for us to know if the price of gold is time sensitive between a weekly and a monthly scale, or a weekly and an annual scale. To do this, we apply the same calculation explained in the previous section. Thus, we obtain the following results:
- The value of H between a weekly sample and an annual sample is 0.501 (ln7.24/ln52).
- The value of H between a weekly sample and an annual sample is 0.51 (ln2.03/ln4).
As a result, whether we are talking about gold in the short term or the long term, its trajectory is relatively independent of time. This is rare enough to be noticed in the financial markets...
But we must keep this in mind: the fractal degree of an asset is variable over time, and the calculations performed give us a kind of average of all past coefficients. For example, the Hurst coefficient was globally below 0.5 in 2015, which suggested a future bullish reversal (the price of gold was reduced with the longer time scales, which is not the norm for the yellow metal).
Also, it is important to specify that before 2000, the price of gold had a Hurst coefficient greater than 0.5 (close to 0.6 in the 1980s, which can be read in some of the works of Benoît Mandelbrot). The fact that the evolution of the price of gold has become relatively independent of time is a fairly recent phenomenon (since the 2000s) and demonstrates the great sterility of gold in generating different market adjustments in the short or long term...
The example of bitcoin (BTC)
The case of bitcoin (BTC) is very interesting in that it is the absolute antithesis of gold. Indeed, the Hurst coefficient measured between the monthly and annual evolution of gold is 0.92 (read more). This means that bitcoin (BTC) is entirely or almost entirely time-dependent, and that stationary probabilities are largely ineffective in describing its evolution over time. What explains the price trends in crypto-currencies is the timing of these trends... In this sense, bitcoin stands in contrast to the price of gold, which is shown to be independent of the risks associated with the temporality of events.
It is rather notable to generally observe that the most volatile assets are also the assets most dependent on the temporality of trends. Gold is therefore an asset that is a priori detached from time and has little or no influence on its evolution.
In conclusion
We have shown that fractals are a very relevant way to measure the true behavior of an asset. The mere existence (or absence) of fractals on the price of a financial asset allows us to judge whether the price of the asset is dependent (or independent) of the passage of time. In his works, Benoît Mandelbrot speaks of "relative self-force" when talking about fractals. This is the ability of an asset to amplify or reduce its past trends. This reflects the presence of more pronounced cycles in the price of the asset in question.
The case of gold, symbolically chosen by the author of fractals, is an absolutely interesting case. We used to read in the past (around the 1980s and until the end of the century) that the price of gold was a time-dependent asset, just like stocks or several other metals. But a rigorous study of the data available to us shows, on the contrary, that gold has become, since 2000, a time-sterile asset. Whether on short time frames, or medium term time frames, gold shows an insensitivity to time... This does not prevent the presence of cycles, but they become more difficult to read.
But then how to explain this sterility of the gold price to the effects of time? And how to justify that gold is invariant with time, and that its stability is worthy of the most perfect elementary theory?
Since fractals are of little use in reading the price of gold, it is legitimate to look for explanations elsewhere, but the answers to this question remain complex and cannot be answered to this day... There is something fascinating in the price of gold: its capacity to be stable in the face of all the tests of time, something that only a tiny proportion of the world's assets are capable of ensuring to this day. Despite the fact that gold's price is certainly less cyclical than other assets, one can only rejoice at the observation that its performance is biased to the upside.
Reproduction, in whole or in part, is authorized as long as it includes all the text hyperlinks and a link back to the original source.
The information contained in this article is for information purposes only and does not constitute investment advice or a recommendation to buy or sell.


