Gold generates no income: no dividend, no rent, no interest. Yet its value remains less volatile than that of many financial assets. Most analysts struggle to explain the mechanisms that determine its price over the long term. While the influence of gold demand is obvious in the short to medium term, it is not sufficient to justify the maintenance of these price levels over time.
This question is rarely addressed in its entirety, which fuels misunderstandings about the mechanisms involved in determining the price of gold. With nearly 80% of the metal supply coming from mining, the cost of production appears to be the determining variable in market valuation. This cost conditions the profitability of mining companies, influences the metal's floor price and can even affect the decisions of investors and central banks. This article explores the effects of the major determinant of the price of gold.
Stable purchasing power of gold
Between 1900 and 2000, the price of a house in ounces of gold remained relatively stable, fluctuating between 380 and 400 ounces. However, by 2025, with the average price of a 120 m² house estimated at around €250,000, and a gold price of around €3,000, this price corresponds to around 85 ounces of gold. This indicates that gold has outperformed real estate over this period. However, this trend is less marked in the major cities, where property prices have seen more sustained growth.
This dynamic is illustrated by the real estate/gold ratio, which measures the number of ounces of gold needed to buy a house. The lows of this ratio (1934, 1980, 2011) have historically marked buying opportunities for real estate, while the highs (1930, 1971, 2001) have signaled buying points for gold. Gold's super-cycles against real estate generally last between nine and twelve years in the bull phase, followed by twenty to thirty years of relative decline.
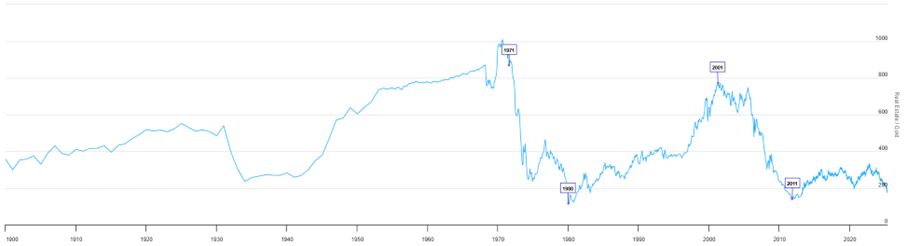
Source: Real Estate to Gold Ratio - Updated Chart | Longtermtrends
In 2011, an article highlighted the stability of the price of a suit, expressed in gold. Similarly, we estimate that a Napoleon 20F gold coin could buy a bicycle in 1900, which is still the case today. This is still true of many essential goods. In this sense, gold is not deflationary! And that should be enough to arouse our curiosity...
A major determinant: production costs
The fact that a financial instrument does not generate cash flows (dividends, rents, interest, etc.) makes its valuation more complex. This does not mean, however, that its price is based solely on subjective or speculative considerations. On the contrary, we are confronted on a daily basis with a multitude of goods with no intrinsic return (food, clothing, cars, furniture, etc.) whose prices are never questioned. In a market where the production of a good is relatively accessible and unconstrained, its price tends to approach the marginal cost of production: i.e. the cost required to produce and market an additional unit, in this case an ounce of gold.
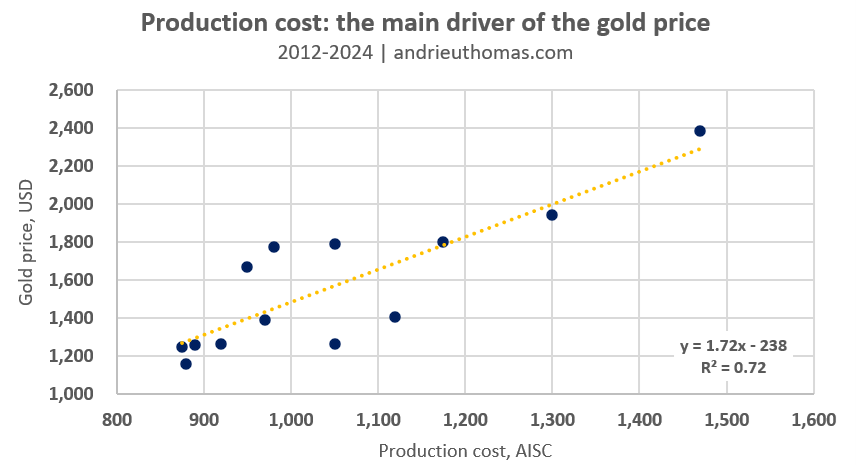
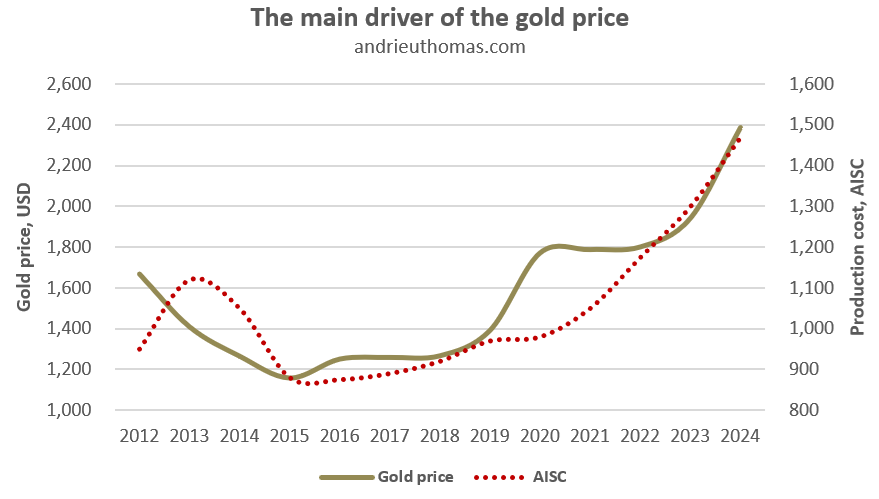
The evolution of gold production costs over the last twelve years reveals a close correlation with its market price. In fact, the price of gold has risen in proportions relatively close to the increase in its average production cost. More precisely, although the quality of the available data limits the solidity of the statistical analysis, it is estimated that this variable explains around 70% of the variations in the gold price since 2012.
However, while this relationship accounts for most of the movements observed in gold, it is not sufficient to explain all of them. The gap between the price of gold and the “fundamental value” estimated by the model shows that the price of gold frequently deviates from this value, whether upwards or downwards, and sometimes for long periods. This suggests the existence of speculative waves or corrective phases around the fundamental price. Such divergences may be due to excess or insufficient demand, generating a persistent imbalance in the market. Recent geopolitical events are a perfect example of such rapid deviations.
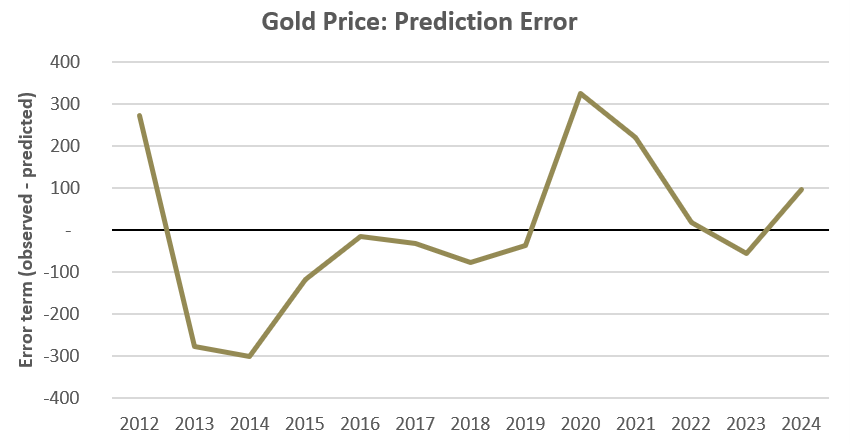
Production costs therefore act as a floor price for the gold market. If the price of gold falls sustainably below its “fundamental price”, as was partly the case in 2022, the least efficient producers close their mines, reducing supply, which tends to push prices back up.
Conversely, when the price of gold greatly exceeds the cost of production - as is currently the case - producers' margins increase, encouraging new mining projects. This can lead to oversupply in the medium term. Moreover, analysis of mining margins is crucial for investors in gold equities. A company with a low AISC (All-In Sustaining Cost) is generally more resilient to gold price volatility.
Gold is not a speculative tool
While the price of gold has an economic logic, it cannot be described as purely speculative, contrary to what some observers claim. Moreover, this market is characterized by high liquidity and a broad geographical and institutional spread - between investors, jewellers and central banks. That said, we must acknowledge the existence of shorter-term movements in the price of gold.
What then are the effects of production rigidities, such as costly infrastructure investments, transport costs or scarcity phenomena?
In addition, the existence of barriers to entry - such as the ownership of a particular deposit or infrastructure (rail, airport) - often gives rise to monopoly profits, de facto excluding competitors. Similarly, employee salaries, safety obligations, taxes, mining royalties and environmental constraints account for a growing share of costs. Companies operating in stable jurisdictions (Canada, Australia) are subject to strict social and ecological standards, which translate into higher costs. This context induces rigidities in the mining business, limiting the ability of supply to adapt to changes in demand, and can thus encourage speculative movements on the scale of a few months or years.
Since the 2000s, the cost of producing gold has risen structurally:
- In 2005, the global average cash cost was less than $400/oz.
- In 2012, the global average AISC reached around $1,046/oz, marking a significant increase on previous years.
- In 2020, the global average AISC was around $1,017/oz, reflecting declining deposit quality, cost inflation (particularly energy) and the tightening of ESG standards.
Today, the cost of producing an ounce of gold is approaching $1,500/oz in 2024. This would justify a gold price close to $2,300, which was indeed the case. Conversely, a gold price of $3,000/oz would imply, compared to the last twelve years, a production cost of around $1,880/oz, i.e. +28% inflation compared to 2024. Sustained demand for gold over the past few years is sending a price signal that is conducive to increased production, which now appears to be heading for new records.
What factors influence production costs?
Labor often accounts for up to 50% of a mining company's production costs, followed by materials (around 30%), energy (15% to 20%) and miscellaneous costs, such as administrative or environmental expenses (around 5%). The sharp rise in production costs observed in recent years can therefore be largely explained by the continuing increase in expenditure on labor and materials. For example, employment costs in the United States have risen by more than 3% per year since 2018, at a rate well above that of inflation, which considerably increases operating costs in the mining sector.
In addition, the gold production cost is more than just the act of extraction. It encompasses a range of direct and indirect costs associated with the discovery, extraction, processing, transportation and management of mined gold. This cost is generally expressed through two main indicators:
- The cash cost: direct operating cost per ounce produced. It includes extraction and processing costs, but excludes overheads, exploration investments and capital expenditure.
- The All-In Sustaining Cost (AISC): it gives a more complete picture, including cash costs, infrastructure maintenance costs, administrative expenses, sustainability and sometimes even environmental costs.
Finally, it is important to recall two major determinants of gold production conditions:
- Firstly, production costs are naturally tending to rise as accessible resources become increasingly scarce. It is becoming more and more difficult to identify high-grade deposits, particularly in a tightened regulatory context with increasing environmental and social requirements.
- Secondly, technological innovations across the entire value chain, from exploration to ore processing and extraction, can stabilize or even reduce production costs. Advances in robotization, automation and more efficient chemical processes play a key role in this dynamic.
Despite this, the structural trend is for mining operations to become increasingly complex. A sufficiently high gold price is therefore essential to justify mining companies' ongoing investments and meet sustained global demand.
The origins of the gold price cycle
While it's clear that the price of gold is the main determinant of its production over the long term, it's also clear that variations in demand can have a lasting influence on the trends surrounding this “fundamental price”. But what are the adjustment mechanisms for responding to excess or deficit demand?
Should the gold market experience sustained demand, accompanied by comfortable margins - as is currently the case - this would suggest the need to increase production. To meet this need, new mining projects will have to be progressively developed. However, as the World Gold Council points out, the time lag between initial exploration and the actual start of gold production is generally between ten and twenty years, with an average of around fifteen.
Significantly, this time frame coincides closely with the dominant gold price cycle. This concordance illustrates the profoundly cyclical and economic nature of the gold market, which reacts to periods of over- or under-investment. In other words, it generally takes between one and two decades for a sustained excess of demand to translate into an adequate supply response, which explains the formation of a full cycle of comparable duration.
Conclusion
Unlike conventional financial assets, gold does not generate any cash flow (interest, dividends, rents), which makes its valuation more complex. Yet its price follows a clear economic logic: in the long term, it is mainly determined by the cost of production. This cost includes expenses linked to extraction, processing, labor, energy, as well as regulatory and environmental obligations. The AISC, a key indicator, thus serves as a floor for the gold price: if the price falls below a certain “fundamental” threshold, loss-making producers stop production, which reduces supply and pushes up prices.
Historical trends show a close correlation between production costs and gold prices. Since 2012, around 70% of the variation in the gold price can be explained by this variable. In addition, gold acts as a reserve of purchasing power: in 1900, as in 2025, an ounce of gold could be used to buy similar goods (clothing, bicycles, housing in a medium-sized area). Despite this fundamental rationality, temporary deviations due to speculation or geopolitical shocks are frequent. When demand is high, mining projects are developed, but with an average lead time of 15 years, which explains the long cycles in the gold market.
Finally, the structural trend is for costs to rise, particularly since 2015, due to the scarcity of easily accessible deposits, and inflation in labor and capital costs, which means that the price of gold must remain high to guarantee profitability and meet demand for the eternal metal. Gold is a commodity, the most precious of all, but a commodity nonetheless...
Reproduction, in whole or in part, is authorized as long as it includes all the text hyperlinks and a link back to the original source.
The information contained in this article is for information purposes only and does not constitute investment advice or a recommendation to buy or sell.


