Since the crisis in 2020, the US stock market has grown at a sustained rate of +20% per year. Since 2022, this rise has been further accentuated by the rise of artificial intelligence, generating an increase of more than 50% over the last two years.
Despite the momentum of innovation and continued growth in the US, the strength of this bull market is raising questions. Asset managers, who hold historically low levels of cash in their portfolios, also consider the market to be overvalued. Is it not finally time, as so often in history, to take a break?
While some banks remain confident, fund managers are adopting a more cautious attitude. This article explores the fundamental and cyclical factors that help us analyze the state of financial markets at the start of 2025.
Towards a post-presidential correction?
One of the dominant cycles in the stock market is the famous “presidential cycle”. This cycle roughly corresponds to the length of a presidential term in the United States. It is generally marked by a decline in financial markets around the mid-term elections, followed by a strong uptrend in the two years leading up to the election, then a continuation of this uptrend for 200 to 300 days after the presidential election.
From 2020 to 2024, under President Joe Biden, the S&P 500 followed a typical presidential cycle. To illustrate this phenomenon, we have plotted all presidential cycles since 1992, along with their average (dark black curve). The most recent term (2020-2024) is shown in grey, and has proven to be the most bullish since 1992, although it has been remarkably aligned with the average evolution of the cycle. Our current position is represented by the blue curve.
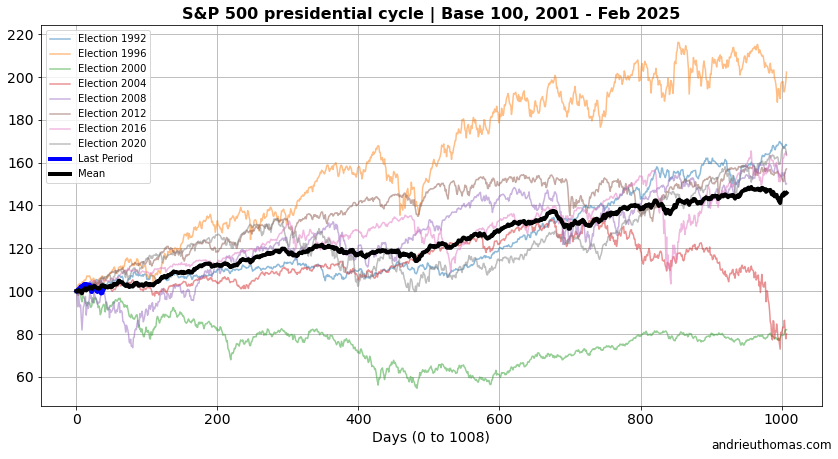
Source : Cycles et fractales pour investir en Bourse | e-book (144 pages PDF) - Thomas Andrieu
Furthermore, we note that the most bearish presidential cycles were those of 2000-2004 and 2004-2008. The strong concentration of variations around this average cycle suggests the relevance of this pattern. This force of attraction could be explained by the influence of the presidential term on the economic structure, driving strategic spending, reorientations and adjustments at the end of the term.
However, this cycle is not the only one influencing the trajectory of stock markets. Another key factor is the Kitchin cycle, named after economist Joseph Kitchin (1923). This cycle, which lasts around three and a half years, has shown a strong correlation with the general movements of stock market indices for at least 150 years. The blue curve below, representing our current position in this cycle, shows a clear symmetry with the black curve illustrating the typical evolution of the Kitchin cycle for the S&P 500.
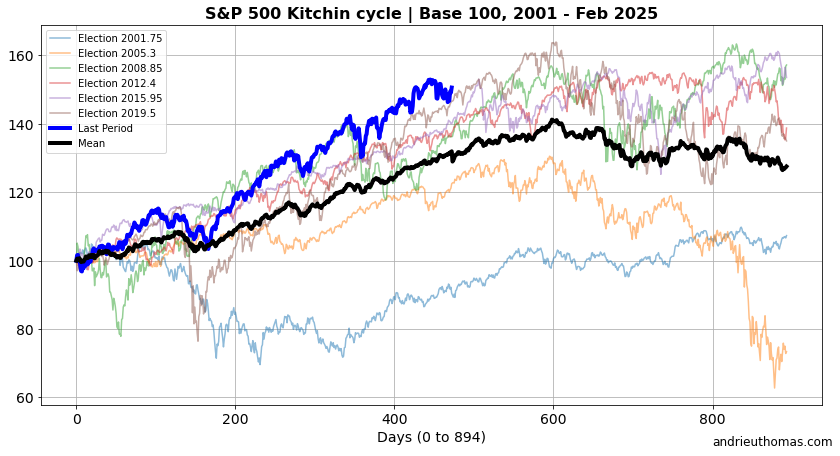
These concurring observations suggest that a correction in the S&P 500 is likely within 100 to 200 trading days, i.e. clearly by the end of 2025. But what would underlie this potential trend?
Corrective risks in the next two years?
In reality, the price/earnings valuation of the S&P 500 has risen by 50% in two years! In other words, most of the rise in recent years has not been due to earnings growth, but to a revaluation of equities. This increase in valuation can be justified if growth over the next few years is expected to be stronger. However, the S&P 500 is valued at 29 times annual earnings at the end of 2024, compared with just 19 times at the end of 2022. In the space of two years, the market has thus gained the equivalent of a decade!
From another angle, while in 2022 the market demanded a return of 5.25% (which corresponds to amortizing the value of a stock over 19 years), today it is content with just 3.5%, all other things being equal... i.e. below the key rate! According to Goldman Sachs, "There's an 80% probability that the S&P 500 pulls back 10% from its high during a one-year period when valuations are elevated". Another indication of this risk is given by the dynamics of the most liquidity-sensitive assets. For example, the leveling off of the bitcoin (BTC) price in recent months attests to the fragility of buying power on the markets.
Over the last ten years, S&P 500 earnings per share have grown by around 4.5% a year, which would justify a PER of between 20 and 25, or, symmetrically, a shareholder remuneration rate in line with the current key interest rate. Remember that over this period, half the S&P 500's performance has come from earnings growth, and the other half from expanding valuations.
Rising valuations may be explained by expectations of stronger long-term growth, or by less attractive investment alternatives. As a result, we have moved from a decade in which market rises were supported by low interest rates, to a decade in which these rises are supported by solid economic growth. However, persistently high key interest rates make these historically expensive valuations harder to justify, and riskier if growth slows.
Despite everything, Goldman Sachs anticipates a +10% rise in the S&P 500 in 2025 (which already gained +4% in February), with a slowdown in the advance of the “magnificent 7”. This projection is also in line with our forecast for the price of gold to rise by around +10% in 2025. Consequently, a market correction in 2025 would probably not, for the time being, call into question the particularly strong upward momentum of the last two years.
Historically over-invested fund managers!
"When time is up, the price will reverse", said William Gann. Because a bull market is only sustained if it can be bought, it's always worth paying attention to the potential buying force, i.e. essentially the level of exposure to the market of professionals.
The chart below, taken from the Bank of America survey, shows the proportion of cash (non-invested) in fund managers' portfolios. With only 3.5% cash in their portfolios, fund managers have significant exposure to the markets. Conversely, any new exposure to the equity market would be marginal. Such a low proportion of cash in portfolios tends to be followed by corrective movements within 100 to 200 days of such excesses.
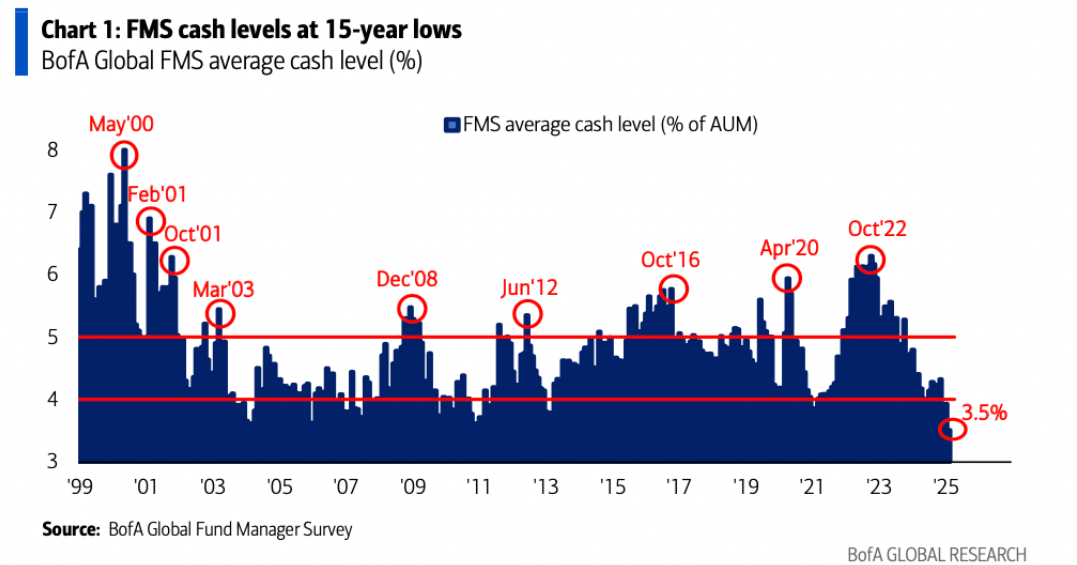
Source : BofA Survey Shows Investors Haven’t Been This Risk-On Since 2010 - Bloomberg
In 2025, fund managers anticipate an average return of 34% for equities, 22% for gold, and 18% for US equities specifically. In detail, the asset classes shunned by asset managers tend to be bonds and energy stocks, while the assets most in demand are equities, with banking and healthcare stocks the most popular. In recent months, investors have been reducing their exposure to banks and tech, while still remaining heavily exposed, despite the fact that 89% of these same managers surveyed by Bank of America consider equity markets to be overvalued.
Overvalued markets: The story of a long cycle
High stock market valuations have become the norm over the past decade. This trend is characteristic of the ascending phases of the long economic cycle, when growth and inflation are generally higher, driven by innovation and more frequent conflict. In 2024, US GDP grew by +2.8%, well ahead of the eurozone, which grew at almost three times the rate, and still behind China (+5%).
As underlined by the Bureau of Economic Analysis in the United States, "Real GDP increased 2.8 percent in 2024 (from the 2023 annual level to the 2024 annual level), compared with an increase of 2.9 percent in 2023. The increase in real GDP in 2024 reflected increases in consumer spending, investment, government spending, and exports. Imports increased". However, we will see a decline in investment in the final quarter of 2024 (-1%).
Similarly, according to Goldman Sachs, "Last year, the US added $1.4 trillion to its GDP, whereas China added $937 billion, and the entire euro zone added $619 billion. The increase in US GDP per capita in 2024 dwarfed those of other countries, while US labor productivity surged."
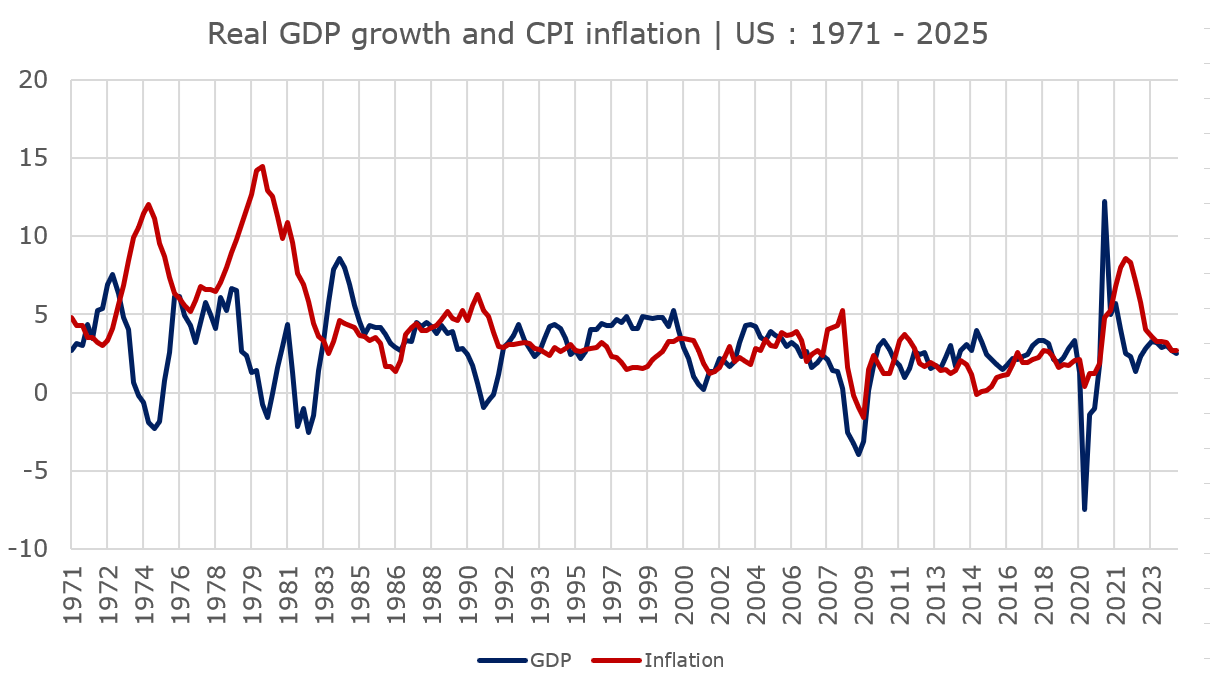
But the most notable feature remains the stability of inflation at around 3% in the USA and 2.5% in the eurozone. This inflation is essentially structural, since inflation excluding energy and raw materials stands at 3.3% in the USA and 2.7% in the eurozone. For example, prices are rising more in the transport, healthcare and real estate sectors. This “inflation plateau”, which is being maintained in the eurozone despite the absence of growth in the major economies, reflects a structural change that complicates central banks' objectives. What's more, low unemployment now suggests that the risk is of the economy seizing up rather than entering a phase of super-expansion.
A dynamic that could benefit gold and bonds
While the threat of a recession has yet to be ruled out by the markets, the risk of a slowdown in growth could loom large in the second half of 2025. Inflation remains a key factor, encouraging policy rates to remain at or above inflation. This high interest-rate environment should benefit long-term bonds, after the historic crash of 2022.
Furthermore, disparities between economic and monetary policies accentuate these dynamics, as illustrated by the asynchronous rate cuts between the various central banks. In the space of a year, the Fed cut its rate by 1 point, compared with 1.35 points for the ECB. While the US key rate stands at 4.3%, it is only 2.9% in the eurozone. Thus, the ECB is favoring a low euro by cutting rates more sharply than the Fed. This further reduction in the key interest rate is justified objectively by weaker growth, but also implicitly by rising debt levels. This could lead to increased volatility on the currency markets, and boost demand for gold from central banks.
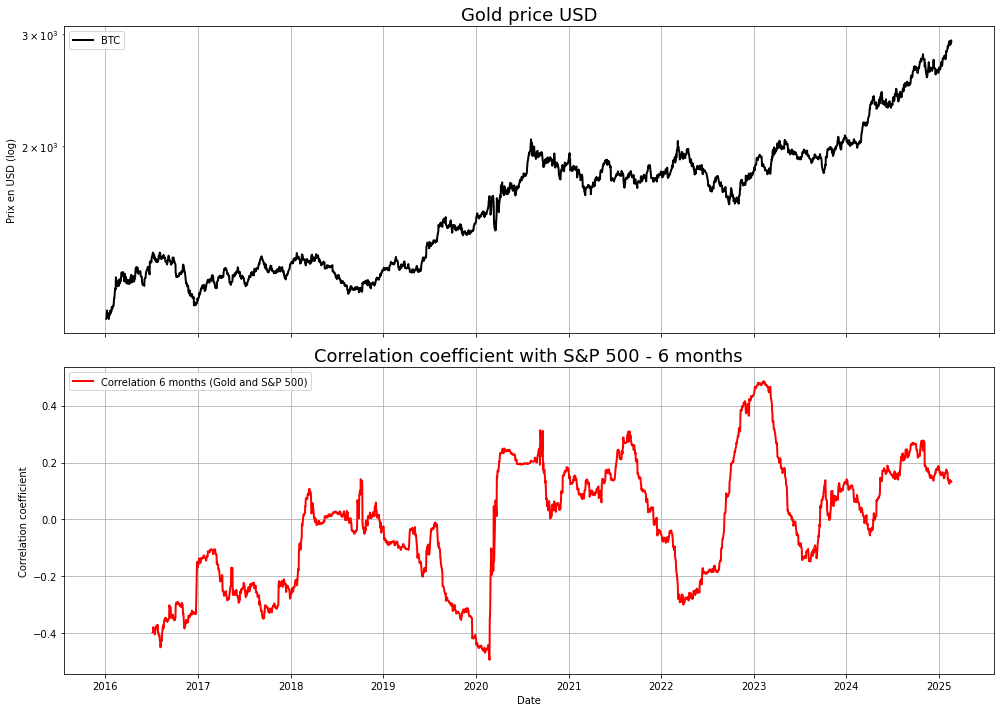
Finally, the return to high interest rates is profoundly changing the behavior of financial markets. With liquidity now scarce, long-term structural impacts are expected. It is also noteworthy that gold's rise since 2016 has been accompanied by a growing correlation with the S&P 500 share price, a phenomenon typical of low-volatility bull markets. However, in times of market tension, the price of gold tends to decouple or move inversely in relation to the S&P 500, as was the case in 2020 and 2022. In this context, gold generally benefits from stock market corrections before stabilizing in a consolidation phase.
Conclusion
“When the stock market goes, everything goes”. Over the past two years, the financial markets have performed extremely well, propelling US stock market indices and the value of technology companies to high valuations. This optimism is based primarily on robust growth and major innovations. However, the duration and intensity of this bull market is beginning to raise questions among financial professionals.
While fund managers are posting record exposure to the markets, the lack of liquidity available for new purchases is limiting the potential for this uptrend to continue. History shows that such high levels of exposure have often preceded correction phases.
Moreover, a correction does not immediately mean a lasting trend reversal. Economic and stock market cycles are influenced by various factors, including presidential and Kitchin cycles, which suggest a possible turnaround by the end of 2025. Central banks could play a decisive role in this evolution, by adapting their monetary policy to market stabilization needs. Last but not least, the role of gold and bonds should not be underestimated, and some managers are already carrying out rotations, albeit still marginal.
Reproduction, in whole or in part, is authorized as long as it includes all the text hyperlinks and a link back to the original source.
The information contained in this article is for information purposes only and does not constitute investment advice or a recommendation to buy or sell.


