In 2022, 76% of the world's gold sales came from mined gold. Under these conditions, it is clear that gold mining companies have a significant influence on the price of the yellow metal. At the same time, production costs are soaring. The few mining companies that could still produce gold at under $1,000 an ounce are now virtually non-existent.
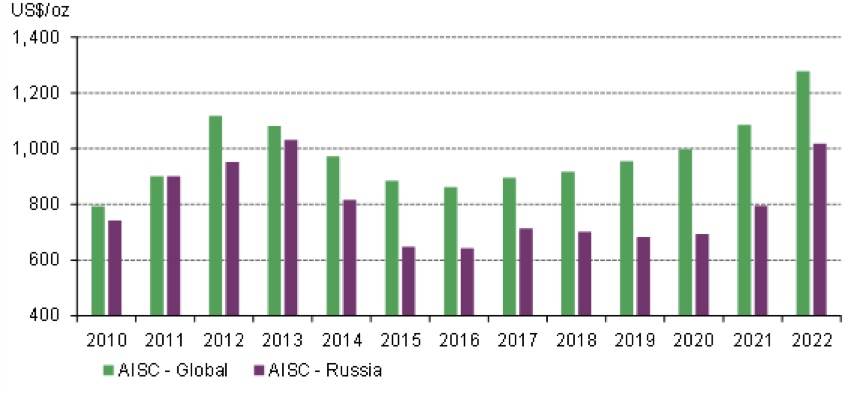
Over the past year, gold production costs have climbed by 18% to $1,276 per ounce. In this context, we had to wait until the end of 2022 to see gold prices catch up. In addition, demand for gold rose sharply at the end of the year, as did production costs. With demand for physical gold tending to run out of steam in the first quarter of 2023, the pressure on production costs raises questions about the outlook for the gold price.
Outlook for the major mining companies
In a previous article, we discussed the position of the major gold mining companies. The major mining companies have a significant influence on the market. What's more, because of their size, these mining companies often benefit from economies of scale and are among the most competitive. The study of their production costs therefore seems relevant.
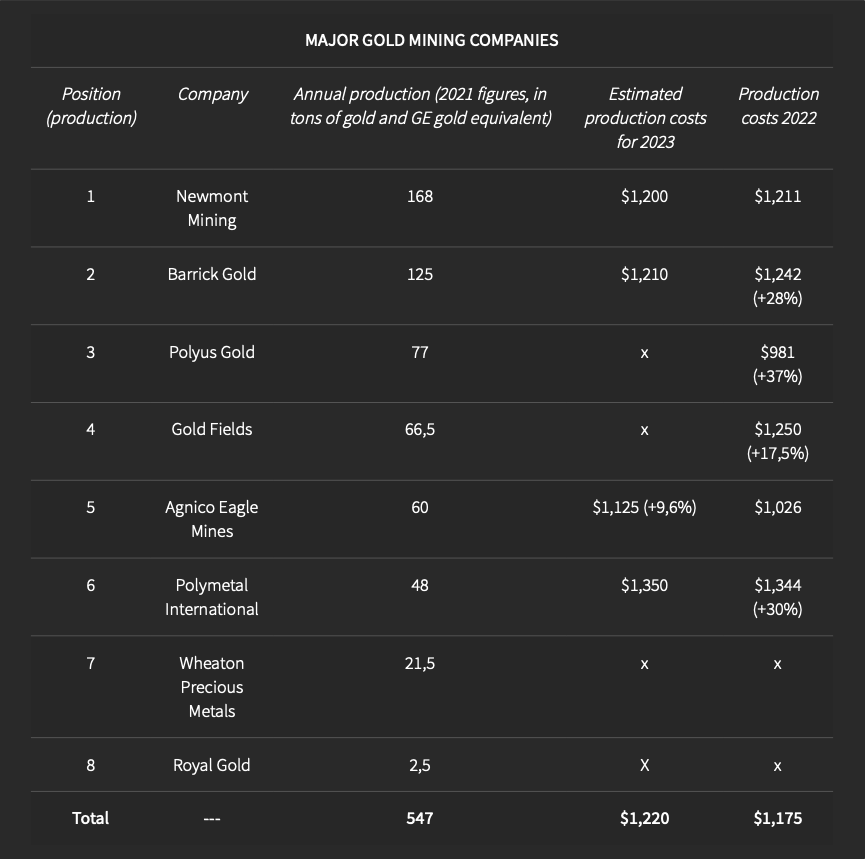
In this context, it should be remembered that the average increase in production costs in 2022 was 18% for mining companies. For 2023, companies anticipate a fairly stable production cost, due to lower inflation on raw materials (see table above). But in any case, a return to production costs significantly below those of 2022 seems unlikely. The new production cost peak of $1,276 per ounce is therefore historic. This is well above the last peak at $1,116 per ounce in 2012.
An underpriced gold?
Once we've detailed the strains on gold production, it's important to point out that the price of gold has historically been 45% to 60% above the cost of production. In fact, there is a good long-term correlation between the cost of production and the price of gold. With a production cost of over $1,250 per ounce in 2022, the "fundamental" gold price is effectively between $1,850 (low) and $2,040 (high). Clearly, gold was undervalued in 2022.
The sharp rise in the gold price at the end of 2022, when almost 10% of gold production was unprofitable, has therefore prompted a readjustment of the price towards its "fundamental" price in 2022. It is also important to point out that, in view of the 2023 outlook, it is highly unlikely that the price of gold will have a fundamental value below that observed in 2022. In this case, the threshold for gold prices would be between $1,900 and $2,000 per ounce.
Finally, if the rise in production costs were to continue, particularly in the event of prolonged inflation, then it is clear that gold would confirm significant new highs. But what also catches our attention is the steady but sustainable rise in the cost of gold production since 2016. This trend looks set to continue, and will be reinforced in 2022 by the inflationary shock. The challenge for 2023 is not just to determine whether the cost of production will be higher, but also to observe (or not) the continuity of this upward trend in costs.
Who drives the price of gold: buyers or sellers?
There's a question that economists and investors often debate. The issue is whether, after all, there will always be buyers, or always be sellers. Then there's the question of whether the gold price is high because there is sustained demand in the first place, which ensures that mining companies can sell at a price that amortizes their production costs, or whether there is a supply that creates demand in the first place (no one refuses to buy gold).
To better understand which party (buyer or seller) has the greatest impact on the gold price, we turn to the study of elasticity. Elasticity compares the variation in demand (or supply) with the variation in the market price. If demand (or supply) is rising faster than the gold price, then the elasticity is greater than 1. Conversely, if the rise in the gold price reflects a fall in demand (or supply), then the elasticity is negative. A study of the data available since 2010 clearly shows the following conclusions:
- Firstly, the elasticity of demand in relation to the gold price is positive 90% of the time. In other words, an increase in the price of gold will also translate into an increase in the physical demand for gold. The more expensive gold is, the more it will be in demand. Nevertheless, the increase in demand for gold is often less than the increase in the gold price, since the average elasticity over 10 years is 0.62.
Conversely, it could be argued that a rise in gold demand (or a fall) reflects a greater rise (respectively, a fall) in the gold price. - On the other hand, the elasticity of gold supply to gold price averages 1.2 over 10 years. This means that an increase in the gold price translates into a greater increase in gold supply. In detail, the elasticity of mining supply, which accounts for 76% of total supply, is much higher: around 2.3! A small increase in the gold price translates into a large increase in the supply of mining gold.
Conversely, we could well conjecture that an increase in mining supply implies a small increase in the gold price. Likewise, a reduction in mining supply will result in a smaller fall in the gold price.
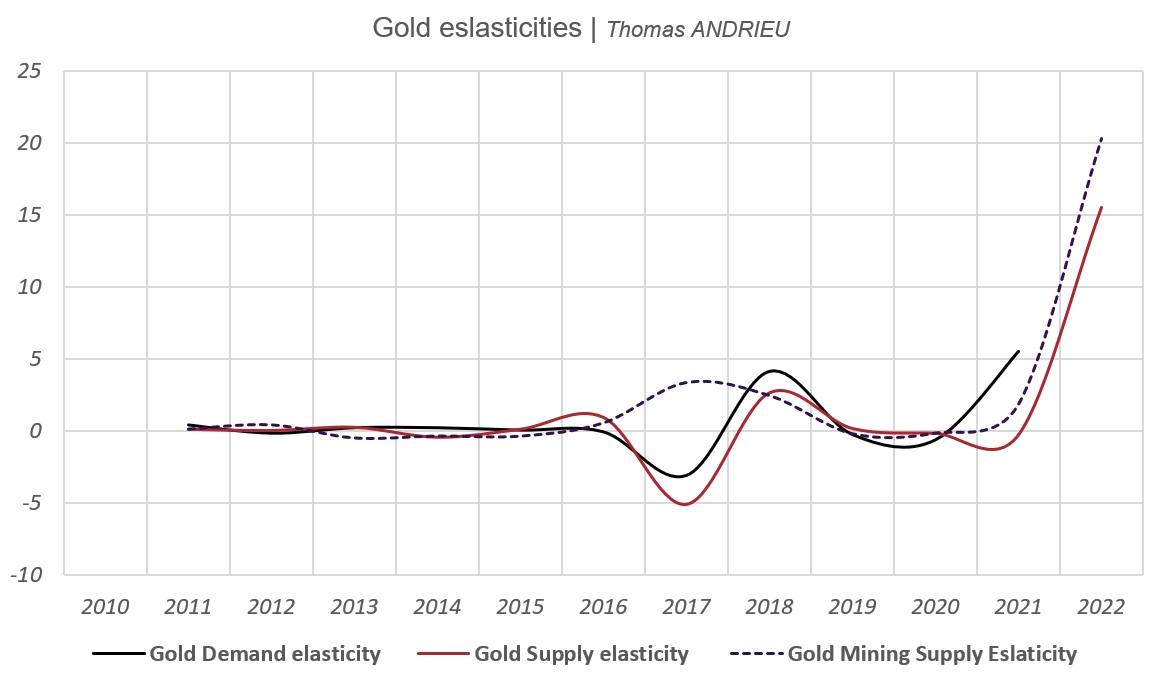
The facts we have set out are represented in the chart above. It is also interesting to note that, in 2017, the gold price reacted oppositely to gold supply and demand. This marked the start of a new bullish cycle. What's more, 2022 shows a very special phenomenon. The price of gold remained stable in 2022, while demand increased considerably (+17%) and supply rose very slightly (+1.28%).
Lower demand in the first quarter of 2023
We have shown that demand can explain the volatility of the price of gold, while at the same time, supply tends to explain the fundamental long-term trend. As it turns out, demand declined in the first quarter of 2023, putting the massive buying seen at the end of 2022 on hold. This reduction in demand was essentially driven by central banks, which, after buying a record 378 tons of gold in the last quarter of 2022, finally "scaled back" their purchases to 228 tons in the first quarter of 2023.
Despite this, investment demand rose from 250 tons in Q4 2022 to 273 tons in Q1 2023. Jewelry demand, meanwhile, fell by almost 15% over the quarter. All in all, overall demand for physical gold was down 13% quarter-on-quarter. This may explain why gold has fallen back below $2,000 an ounce. Despite these observations, demand outside the physical market (OTC) is up sharply, even offsetting the fall in demand from jewelry and central banks.
In conclusion
Gold production costs reached an historically high level in 2022 (+18%), which was then reflected in the gold price. As a result, the price of gold "perfectly" returned to its fundamental value at the end of 2022 and beginning of 2023, evolving between $1,800 and $2,050 per ounce. The challenge now is to determine whether or not the upward trend in gold production costs observed over the last six years will continue, and whether or not demand will remain as strong as it was at the end of 2022.
From what we have written, it seems clear that demand has an amplifying impact on gold price variations. Nevertheless, the supply of physical gold also appears to be highly sensitive to the gold price, but variations in mining supply in particular do not appear to explain the bulk of gold price variations. In a way, then, it's important to write that demand indirectly and effectively governs the gold market. However, this demand can only be satisfied by a production cost set by the mining companies. While the gold price may be subject to short-term "noise" due to demand, a fundamental value for gold emerges from its production cost.
At the beginning of 2023, demand for gold weakened after the impressive demand recorded at the end of 2022. The cost of production borne by mining companies is expected to remain stable overall in 2023, with the first figures to come confirming (or not) this expectation.
Reproduction, in whole or in part, is authorized as long as it includes all the text hyperlinks and a link back to the original source.
The information contained in this article is for information purposes only and does not constitute investment advice or a recommendation to buy or sell.


