What is the difference between gold and the companies that mine it? What is the profile of the mining companies? What are the different risks and performances associated with mining companies compared to the gold price? These are all questions that are essential to understanding the gold market. Most mining companies have relatively high returns. Thus, the cost of gold production is an essential parameter, both for the price of gold, but also for the immediate profitability of gold mining companies. To date, most of the listed mining companies available to investors are located in North America. As we will show, the profitability of these companies can vary significantly despite the fact that their debt load is extraordinarily low. Let's decipher the behavior of mining companies, which often offer more than 3% returns, and the mechanisms that link them to the price of gold.
The major mining companies
Among the largest mining companies in the world, we can list Newmont, Barrick Gold, Franco Nevada, Agnico Eagle Mines, Wheaton or Polymetal, but also Royal Gold or Gold Fields... Among the forty largest capitalizations of mining companies, most of them are Canadian. However, we must take into account the lesser accessibility of Russian and Chinese companies to Western retail investors.
In the table below, we have represented the detailed data for eight mining companies. These eight companies are among the largest mining companies in the world (ranked by largest annual gold production or gold equivalent production). On average, the world's leading mining companies provide a return of more than 3%, which is quite respectable during a market downturn. Furthermore, a mining company is valued at an average of $4 to $5 billion based on a study of some forty companies. However, it seems that there is a more or less important link between the profitability of these companies and the quantities of gold mined.
Major Gold Mining Companies |
||||
|---|---|---|---|---|
| Position (production) | Company | Annual production (2021 figures, in tons of gold and GE gold equivalent) | Country (by headquarters) | Profitability (dividend/share, 2021) |
| 1 | Newmont Mining | 168 | United States | 4% |
| 2 | Barrick Gold | 125 | Canada | 4,9% |
| 3 | Polyus Gold | 77 | Russia | 5,3% (in rubles) |
| 4 | Gold Fields | 66,5 | South Africa | 2,9% |
| 5 | Agnico Eagle Mines | 60 | Canada | 3,3% |
| 6 | Polymetal International | 48 | Jersey/Russia | 0,45% |
| 7 | Wheaton Precious Metals | 21,5 | Canada | 1,73% |
| 8 | Royal Gold | 2,5 | United States | 1,36% |
| Total | --- | 547 | --- | Average = 3,42% |
Moreover, the eight largest mining companies we have listed alone produce the equivalent of 15.2% of the world's total gold production. With a cumulative production of almost 550 tons, the share of these few companies in world production (3,580 tons) is not negligible. Moreover, we must remember that China and Russia lead the gold production and that many companies are less accessible to individual Western investors. As for the Russian company Polymetal, 44% of the turnover is made in Russia, and one third in Kazakhstan. Thus, 86% of the turnover is made on gold, and the rest on silver. Each company therefore has its own geographical specificities and the costs of extracting an ounce of gold are very different from one company to another. For example, the South African company Gold Fields produced more gold at an average cost of almost $1,300 per ounce. In contrast, Newmont Mining produced gold at a lower average cost of $970 per ounce. The difference in costs would thus explain the mathematical difference in the profitability of the different companies (by a factor of 1.34).
The cog in the mining industry: the cost of production
We understand that the entire mining industry depends on the cost of gold production. We will not go into detail about the importance of the cost of gold production in relation to the world gold price. However, most of the very long-term evolution of the gold price is due to the evolution of production costs. This market power of mining companies is due to the concentration of supply (80% of all gold supply comes from gold mines).
We are therefore dealing here with a paradox:
- The rising price of gold is a bullish factor for the profitability of mining companies.
- However, it is also known (in the long run) that gold is partly determined by its production cost.
- As a result, a rise in gold prices induced by a similar rise in production costs will have no effect on the profitability of mining companies. Conversely, an increase in the price of gold without an increase in costs will generally be favorable to mining companies. In this sense, only the exploitation of mines (or new mines) with low gold production costs allows a sustainable increase in the profitability of mining companies.
The cost of production is therefore one of the major determinants of the ability of certain companies to increase their market share, to benefit from long-term prospects, or to have a favorable financial situation (low debt, etc.). The parameters that influence the cost of gold production are multiple, but very real: available equipment, abundance of gold, ease of mining depending on the area, labor costs, exchange rate risks, transportation costs, etc.
In addition, mining companies generally have very little debt, which provides additional financial security. The debt/equity ratio for Barrick Gold is thus 0.16 in 2022, and 0.28 for Newmont Mining, compared to an average of nearly 1.6 for S&P 500 companies. In general, the debt ratio is more or less inversely correlated with the price of gold. A fall in the price of gold will tend to put pressure on companies, which automatically implies an increase in debt. Finally, in a fairly recent note, BNP Paribas emphasized that a gold price above $1,780 per ounce would result in an increase in gold flows from mining companies. In this sense, we deduce that the cost threshold is currently around $1,700. A sustained fall in the price of gold below $1,700 could eventually reduce the supply of gold on the market and cause the bull market cycle to continue. This threshold is all the more important as it seems to act as a medium- to long-term market equilibrium.
What performances?
In the case of Newmont Mining, which is one of the strongest performing mining companies, the share price shows an average monthly increase of +0.92% between 2000 and 2022. In comparison, gold performs on average almost +1% per month. So there is a similar performance between gold and Newmont Mining. However, the difference between gold and mining companies (Newmont Mining in our case) is the significant difference in volatility.
The annualized volatility measured on Newmont Mining exceeds 30% over the period 2000-2022. In comparison, gold's volatility generally ranges between 15% and 20%. This means that mining companies can be up to twice as volatile as the price of gold itself. In other words, the investment risk in mining companies is higher than the investment risk in gold at equal performance. Nevertheless, mining companies have a significant advantage: they allow you to increase the performance of your portfolio over the medium term. The fact that the price of mining companies is subject to large variations, most often symmetrical to the price of gold, also explains the almost systematic outperformance or underperformance of mining companies against gold.
Finally, we are leaving out one consideration here. Mining companies provide significant returns. In addition, the low leverage of mining companies also increases their profitability.
Finally, several indices exist (such as the HUI), grouping together the price evolution of several mining companies. This is for example, the case of the Dow Jones Gold Mining Index. This type of indexes offer us a representation of the price evolution of the main mining companies. In the first quarter of 2022, the Dow Jones Gold Mining Index rose by more than 40%... But the fall in the second half of the year was all the more brutal. This index highlights the extreme price volatility of mining companies. Between 2011 and 2016, the index fell by more than 77% before rebounding by more than 400% to regain and exceed its 2011 levels. For example, the index's previous high was 140 in 2011, eventually settling at 40 in 2016, as suggested by the technical target (shoulder-head-shoulder pattern in 2012).
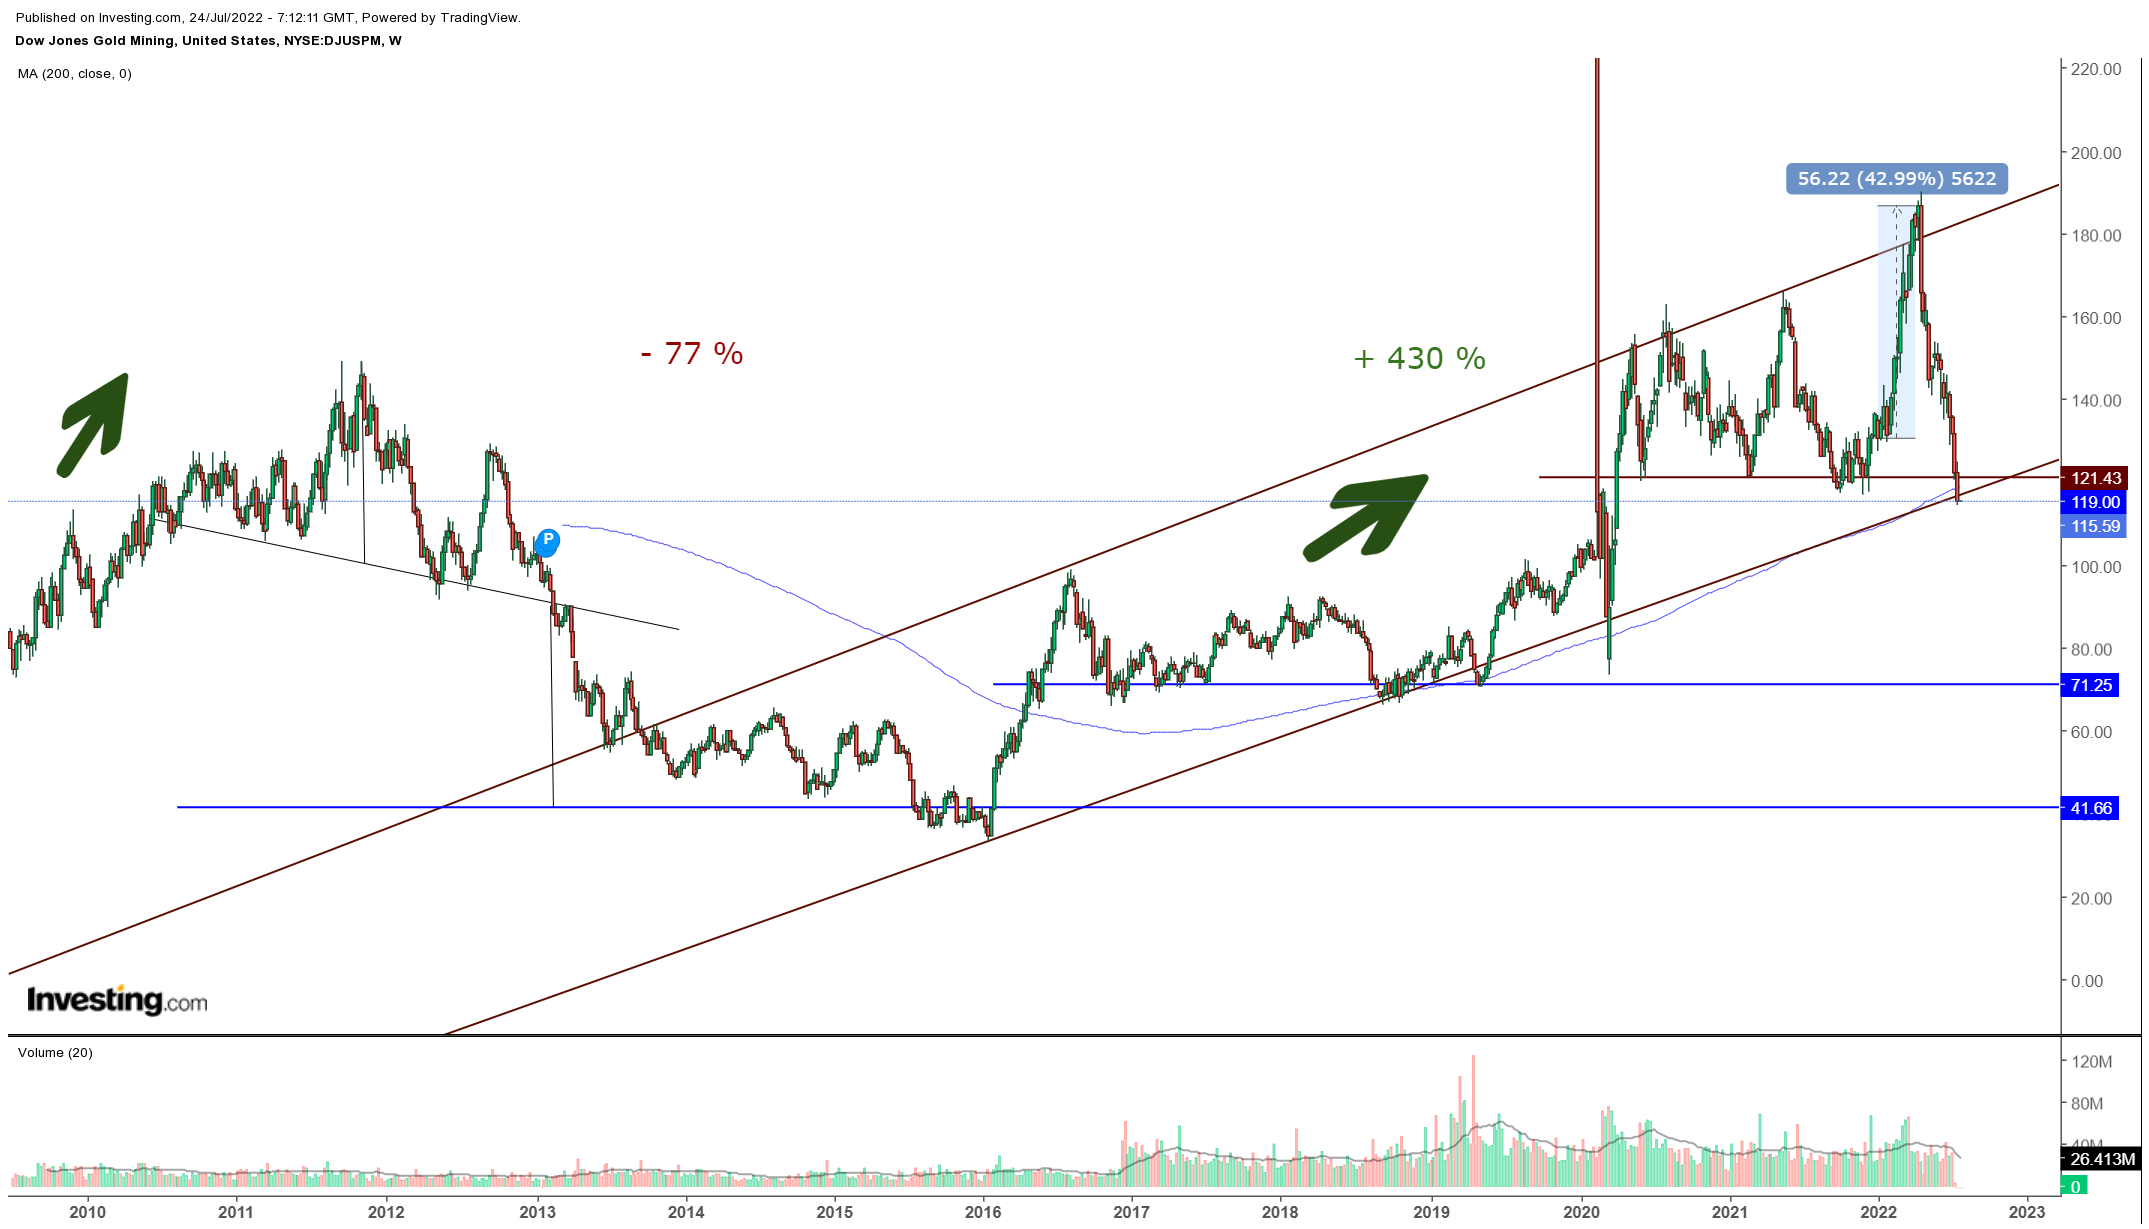
Currently, the index is in an ascending channel drawn since 2016. The exit of this channel would project a more important fall towards the levels of 2019. However, we note that the index is evolving fairly symmetrically to the price of gold, with generally exaggerated price movements. Thus, the decline of mining companies is often exaggerated to the fall in the price of gold because of the faster fall in the profitability of companies. Conversely, rising gold prices increase the profitability of mining companies very quickly when the price of gold quickly exceeds the cost of production. Again, recessions are often more or less profitable times for mining companies because of the increase in cyclical demand.
In conclusion
In conclusion, we have shown that the major mining companies have strong market power and produce a significant share of the world's gold production. The profitability of the major mining companies often exceeds 3% and their low debt levels for several years are an additional criterion for their viability. Each year, these major mining companies contribute many hundreds of tons of gold to the gold market. It is also important to emphasize the power of supply in the gold market.
However, we must emphasize the role of the production cost of gold. On the one hand, this determines to a large extent the long-term evolution of the gold price. On the other hand, higher production costs reduce the profitability of mining companies. Mining companies are always confronted with a structural increase in costs, which ideally should be accompanied by an increase in the price of gold. This sensitivity to the cost of production also explains the difference in behavior between gold and mining companies. Mining companies are up to twice as volatile as the gold price, yet perform slightly worse than the gold price. In this sense, mining companies offer generally similar returns (excluding dividends) for a greater overall risk.
Therefore, investing in mining companies implies the search for return over long periods, or the search for capital gains over the medium term (a few months). In this case, mining stocks can be profitable and extremely lucrative over specific periods. At present, a sustained fall in the price of gold below $1,700 per ounce would tend to keep pressure on many mining companies.
Reproduction, in whole or in part, is authorized as long as it includes all the text hyperlinks and a link back to the original source.
The information contained in this article is for information purposes only and does not constitute investment advice or a recommendation to buy or sell.


