Since its low in November 2022, the price of gold in dollars has climbed nearly +15% (compared to +4.5% in euros). The rising cost of gold production and the declining profitability of mining companies largely explain this movement. As early as November 2022, we were insisting on the strong probability of an effective gold reversal in 2023. This movement has now been confirmed. But will this rise be enough to drive new highs?
Throughout this publication, we will see that despite the slight drop in the dollar price of gold in 2022, demand is clearly on the rise. At the same time, production costs are rising and mining companies are less profitable. This context largely explains the strong rebound of gold. But what is most impressive is the appetite of central banks for gold, whose demand has increased at a rate not seen since 1967... Behind the structural changes in the market, gold seems to hide a geopolitical confrontation of considerable magnitude.
Strong increase in demand for gold in 2022
Contrary to what many had suggested, demand for gold was boosted considerably in 2022. Demand for the physical metal increased by 18% between 2021 and 2022, while supply increased by only 2%. The stability of the gold price in 2022 once again shows the lack of a link between the price and actual demand.
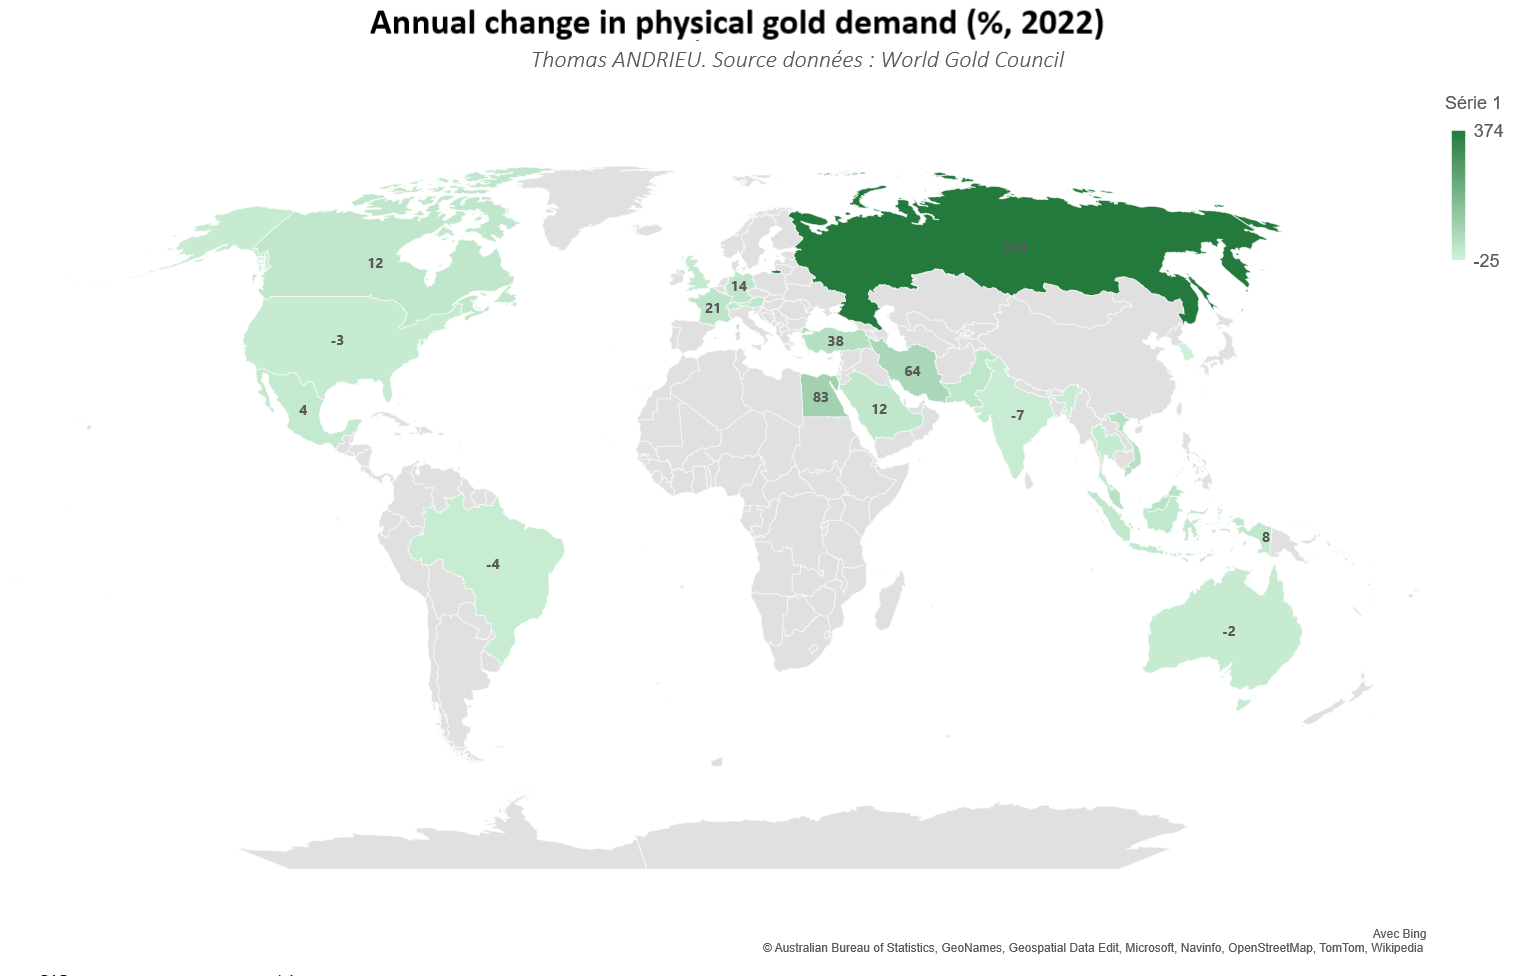
We should also note the particular case of Russia. The demand for coins and bars in Russia jumped by 374% in 2022 to 25 tons! This is a very significant increase for the reasons we know. In France, the increase in demand for coins and bars is still 21%, or 14% in Germany. The chart shows a clear interest in gold in European countries, mainly due to the fall of the euro in 2022. But the interest in gold is even stronger in the Middle East and Russia, driven by a desire for monetary independence.
Central banks are massively buying gold
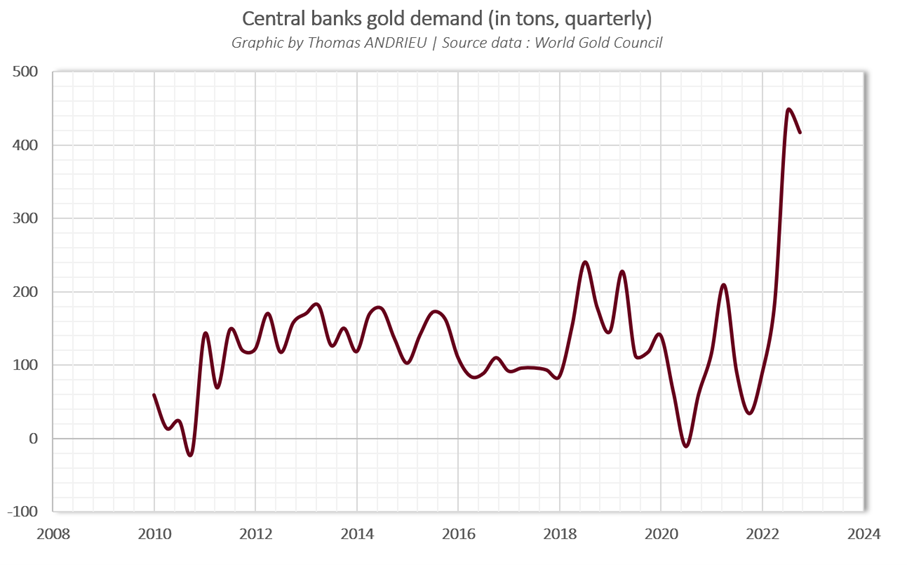
One thing that catches our attention is the sudden and massive revival of interest in the yellow metal by central banks. Central bank demand for gold jumped 152% between 2021 and 2022! This is simply the largest amount of gold ever purchased by central banks in one year in decades. The equivalent of 1,135 tons.
These massive purchases are questionable, as they run counter to the trend observed in recent years. In 2019 and 2020, central bank demand had fallen by 7.7% and 5.8%, respectively. Central banks' purchases are taking place against a backdrop of balance sheet reduction, which seems contradictory. Turkey has thus increased its gold reserves by 147 tons in 2022, followed by 62 tons for China, and 44 tons for Egypt.
According to the World Economic Forum, the pace of gold accumulation by central banks is unprecedented since 1967! In a WEF article published on November 10, 2022, the WEF states that: “Gold is regarded as an effective inflation hedge, although some analysts believe this to be true only over extremely long time horizons stretching over a century or more.”
Gold is primarily considered in the same way as foreign exchange reserves. In order for the balance of payments between countries to be balanced, central banks must change their reserves. Foreign exchange reserves thus tend to decrease when a country experiences either capital outflows, a deterioration of its trade balance, or a decrease in prices. It is understandable why, in an inflationary context, the demand for foreign exchange reserves increases, and with it, the demand for gold. The case of Turkey, which has seen inflation rise to over 80%, is revealing. Faced with a rising dollar, many central banks are buying gold to ensure liquidity on the international scene. The real interest of gold for central banks is, above all, to guarantee a source of confidence and independence.
The cost of production rises... companies less profitable
As we know, the price of gold is strongly determined in the long term by its production cost. Because of the concentration of supply, the major dynamics of gold price evolution are determined by the profitability of mining companies. Production increases as long as mining is profitable, so that supply increases and the price of gold decreases. But if production costs increase, this reduces the supply of the companies and mechanically results in a higher gold price. This is precisely what we saw in 2022.
The chart below shows the percentage of gold production that is costing more than the price of gold. In other words, this is the proportion of gold production that is not profitable. In the third and fourth quarter of 2020, less than 1% of gold production was unprofitable while the gold price was at its highest. We can see how the fall in the price of gold in 2021 has strongly impacted the profitability of companies. In the third quarter of 2022, more than 9% of gold production was not profitable.
Share of gold production whose production cost is above the gold price (source)
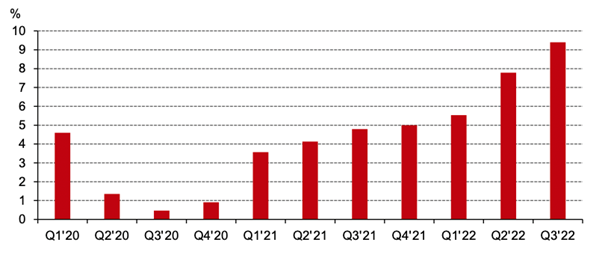
While the correction in the gold price has inevitably led to a decline in profitability, we must also point out the significance of rising production costs. To date, according to data provided by Metals Focus Gold Mine Cost Service, the cost to produce an ounce of gold is just over $1,250. An all-time high!
In 2013, this production cost was around $1,100. So the production cost of an ounce of gold in 2022 is (about) 13% higher than in 2013. And indeed, the price of gold is roughly higher in similar proportions to 2013. Under these conditions, the bullish potential of gold is considerably strengthened.
A production deficit?
The quarterly level of gold mine production (based on WGC data) is represented in the chart below. It can be seen quite clearly that mine production has increased overall since 2010, from 650 tons per quarter, to 950 tons in 2018 (+46%). It should be noted that total gold supply (mine production and recycled gold) has only increased by 10% over the same period. The sale of already existing gold is significantly lower than in the past. Moreover, the sale of recycled gold was previously correlated to the gold price. But despite the rise in gold prices since 2018, the supply of recycled gold has not increased.
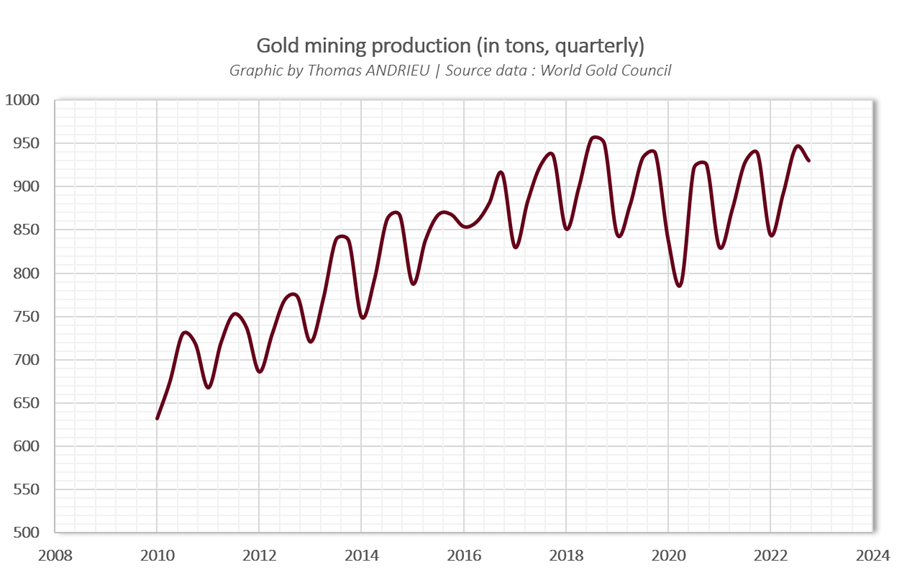
In addition to the fact that mining production evolves in annual cycles, it tended to grow at an average rate of 3-4% per year until 2018. However, since 2018, the average growth rate of gold mine production has been zero. If this trend were to continue in the coming years, this dynamic would certainly be very favorable for the price of gold. It should also be noted that the rise in the price of gold from 2018-2019 is simultaneous with the stagnation of mining supply.
Bipolarization scenario benefits gold
We have shown how the economic context favors the increase in demand for physical gold. However, this does not explain the scale of purchases by certain central banks. In this respect, the "bipolarization" scenario largely benefits gold. The fact that central banks, especially those in the Middle East and Asia, are buying gold on a massive scale is a direct reaction to the freezing of Russian foreign exchange reserves by the US. Many nations now fear American and Western domination. This fear is not only justified by the fact that it is an infringement of property rights, but also that the Western measures reinforce an emerging bipolarization of the world.
According to the IMF, Russia is expected to grow by 0.3% in 2022 (compared to a 2.3% recession originally forecast with the sanctions), followed by 2.3% in 2023. The failure of sanctions is evident as the demand for gold grows. This trend of gold purchases by central banks is not only opposed to the 1980s, it is an intensification of a new order. Finally, if a significant number of countries start to buy gold on a permanent and massive basis, the question of the West's reaction arises. Would the United States allow a considerable eviction of gold flows in favor of the East to develop?
Although this trend has been noticeable for years, it is clear that 2022 marks a significant imbalance in the demand for gold between different countries.
A rather favorable technical context
In this context, UBS has notably raised its year-end target to $2,100 per ounce, which would mark an absolute historical high. The context of uncertainty remains, and while commodity prices remain high overall, gold is benefiting from a dual trend of supply shortages and a return to the international stage.
Technically, the price of gold is showing strength at the moment. The recent rebound has clearly surpassed the 200-day moving average, currently at $1,775. But the recent relapse in the gold price could spur a move to $1,850 or even $1,840 as a first step. It is also interesting to note the following: the support reached from $1,628 corresponds exactly to 50% of the retracement of the rise observed between 2018 and 2020. At the same time, the crossing of the $1,730 area, and then the $1,775 area (200-day MM), confirms the exit from a downtrend.
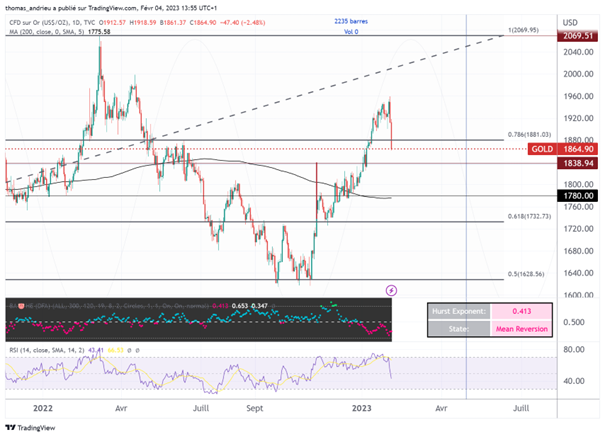
Nevertheless, the correction move in early February shows weakness in the RSI and fractals, which leads us to temper the bullish potential of the gold price between now and the end of the first half of 2023. Clearly, as long as the price of gold remains sustainably above about $1,750 per ounce, the market trend is not technically bearish and the profitability conditions for companies are not deteriorating too much.
In conclusion
As it was rational to anticipate (Towards a Gold Reversal in 2023? | Goldbroker.com), the price of gold has finally broken out of its bearish dynamic observed in 2021 and 2022. We have shown throughout this publication that:
- Demand for physical gold is rising sharply, driven by the uncertain environment. But we must remember that demand has a more limited influence on the gold price compared to supply.
- Central banks are buying at a historic pace to maintain their foreign exchange reserves in the face of an inflationary crisis.
- The countries which see their demand for gold increasing significantly are Russia, the countries of the Middle East, and partly Europe (France, Germany, Switzerland, etc.).
- Mining production is stagnating due to rising production costs. This trend is indicative of a new equilibrium that is, so far, a bullish factor for gold.
In this context, it is understandable that a fall in inflation would lead to a relative decrease in demand in the short term. But this impact would be limited, because on the other hand, the difficulties of mining profitably continue to manifest themselves. Under these conditions, it is understandable why gold's powerful rebound faced an initial slowdown at the end of January. As our study of cycles shows, the market could evolve like this for a few more months. We would have to wait until the end of the year to possibly attempt new highs for the reasons we have mentioned.
Reproduction, in whole or in part, is authorized as long as it includes all the text hyperlinks and a link back to the original source.
The information contained in this article is for information purposes only and does not constitute investment advice or a recommendation to buy or sell.


