Let’s start by looking at silver’s spot price in euro:
Silver has obviously developed a reverse head-and-shoulder pattern which has been finalized all the way to its baseline.
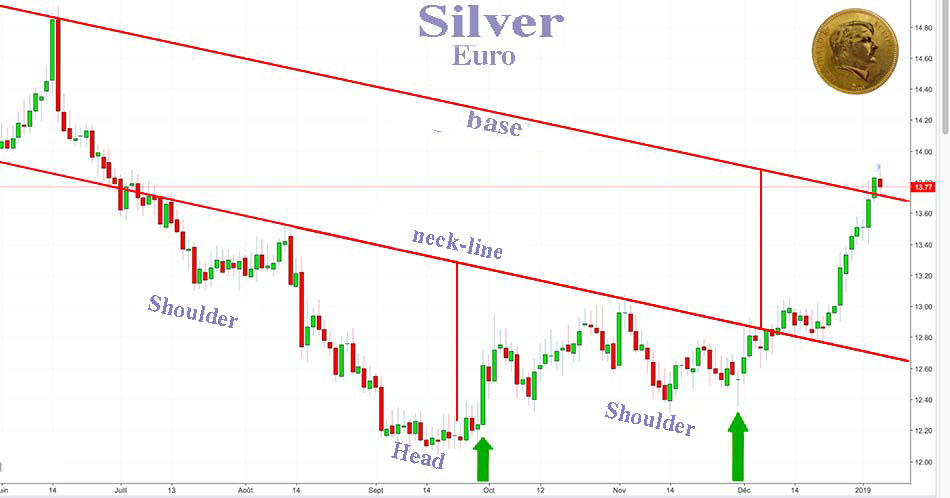
On the daily chart above we see that the first strong bullish move in silver corresponded to the first leg of the stock market decline in October.
The December bullish move also corresponded to a very strong decline in stock markets over the world.
Therefore there has been a transfer of capital flows from the stock market toward the precious metals... but also toward Treasury bonds, which is another matter.
An Explosion Of Carry Trades
When trading resumed on FOREX following the year-end pause, an extremely rare event occurred: there was an 8% move on currencies, which had not been seen since 2009, according to Reuters.
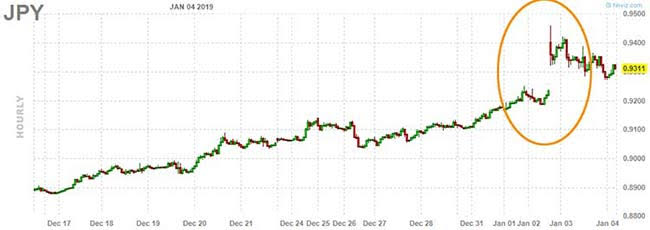
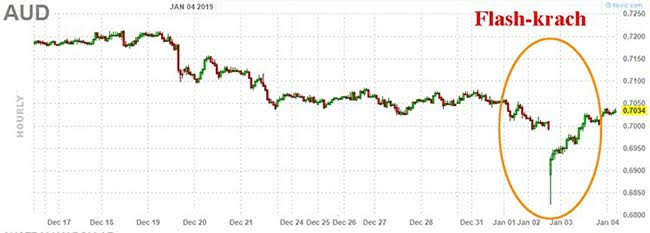
The principle of the carry trade is to borrow in a country with the lowest interest rates – namely, the yen at the Bank of Japan – and invest in a currency offering better yield. Carry trades can be extremely lucrative when currencies are stable, but can become dangerous if currencies start to fluctuate.
This strong gap in the JPY/AUD pair has provoked a very brutal unwinding of carry trades, which forced financial funds to sell speculative positions on different markets and, notably, to buy back their short positions on the precious metals.
This short squeeze brought about a very brutal bullish move in gold and silver, at an ideal moment to break certain major resistances.
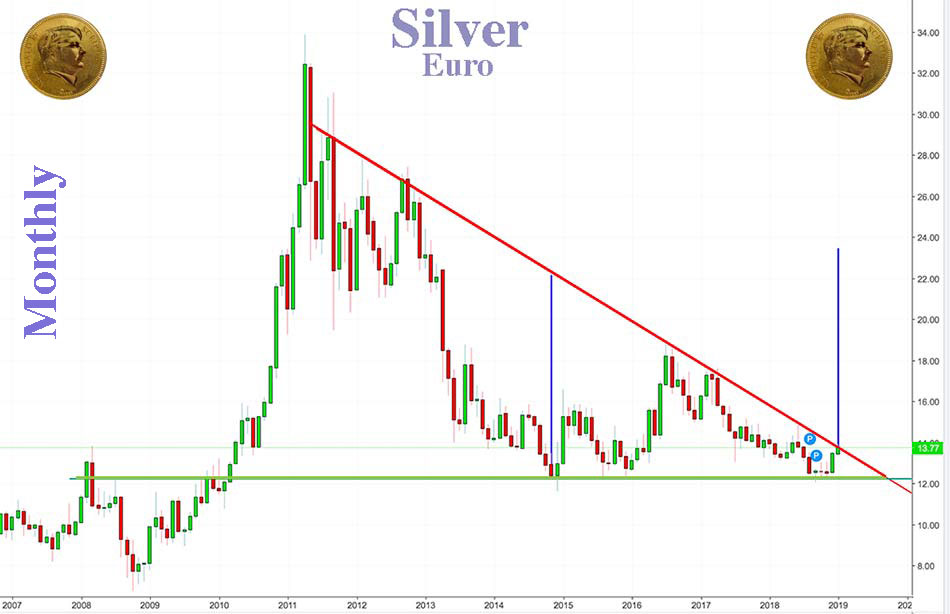
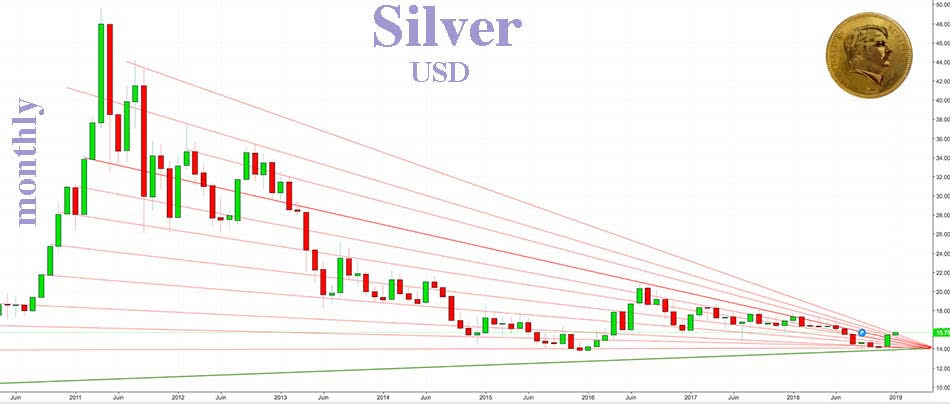
In the monthly chart above, we see that silver has been stuck in a compression triangle since 2011.
Support for this triangle has been tested four times in 2014 and 2015, and again for four consecutive months in 2018. And that support turned out to be very solid.
The resistance to the triangle was broken on January 3rd, and the weekly closing was above it.
This breaking above the resistance shall, of course, be confirmed in January. If it is the case, the first target should be around €23.5 an ounce.
Since this consolidation has lasted eight long years and there has been systematic buying of the available physical silver for over more than 12 months, in a market almost constantly in deficit, the most reasonable calculations may let us hope having reached that target before the end of 2019, although it will be more probably reached next spring.
There’s nothing idealistic in thinking that COMEX’s rule 589 could be applied at some point and that we could see daily jumps of $12 if no one wants to sell at the current prices.
LBMA
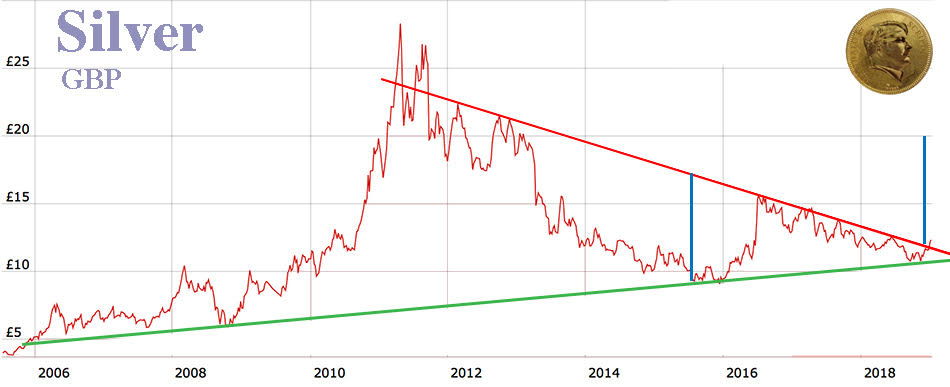
There is an identical triangle on silver quoted in pounds sterling.
Since the City of London is one of the world’s foremost financial hubs and the LBMA is the world market reference for precious metals, the breaking out of this multi-year resistance constitutes a major event for silver.
COMEX
In dollars, silver seems to have played systematically up and then down, a certain number of beams showing it might be due in part to a trading algorithm.
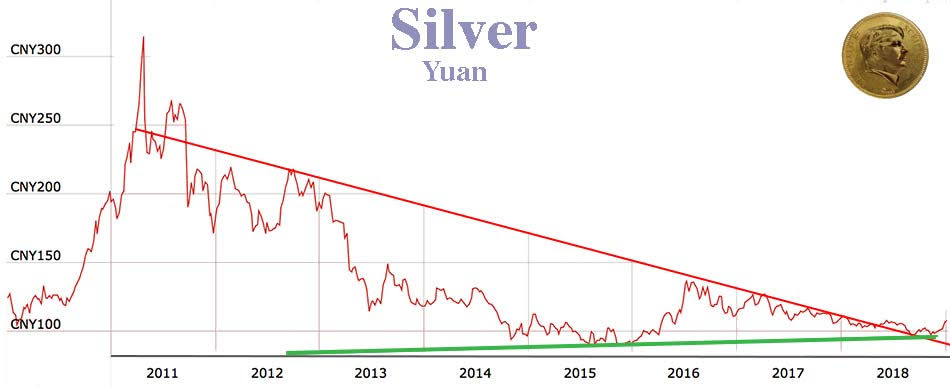
SGE
The breaking out of the triangle happened much sooner in Yuan, but prices have been forced to remain low, while China let gold lead the upside move.
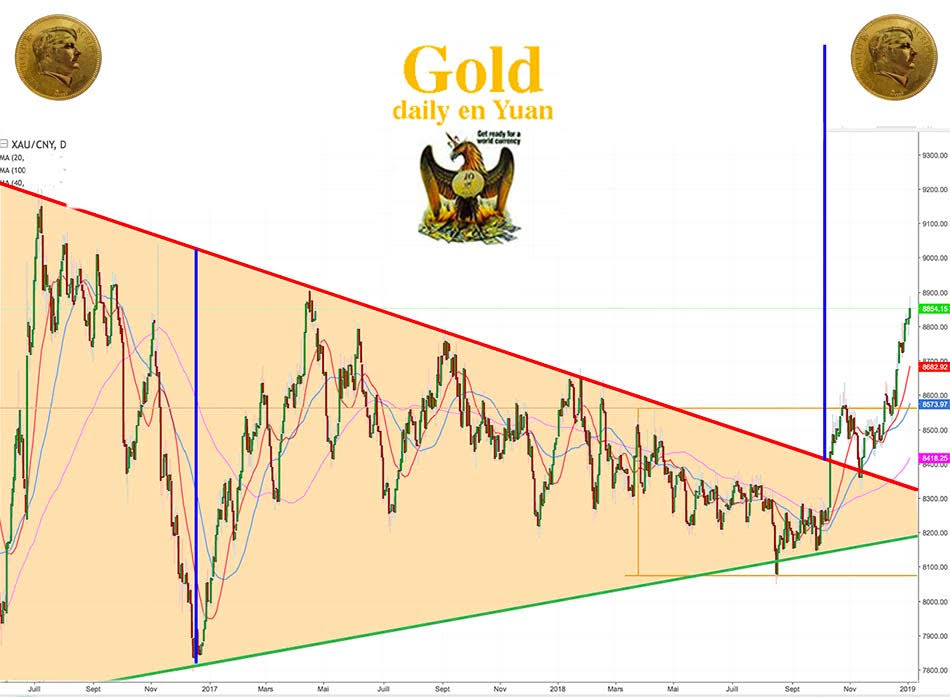
As we can see on this gold chart in Yuan, following a very violent move on October 11, gold in Yuan broke the resistance of its compression triangle, did a pull-back on the resistance on November 13, before starting its logical upward leg (blue line).
Since the Yuan/dollar pair is back today at the same level it was at the beginning of August, 2018, it means it is not the Yuan that is losing value, but gold going up in Yuan, triggering an upside move in the other markets.
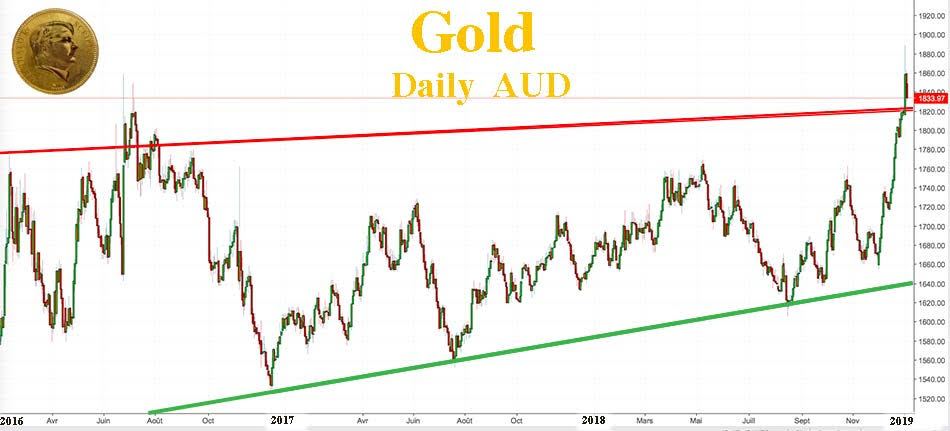
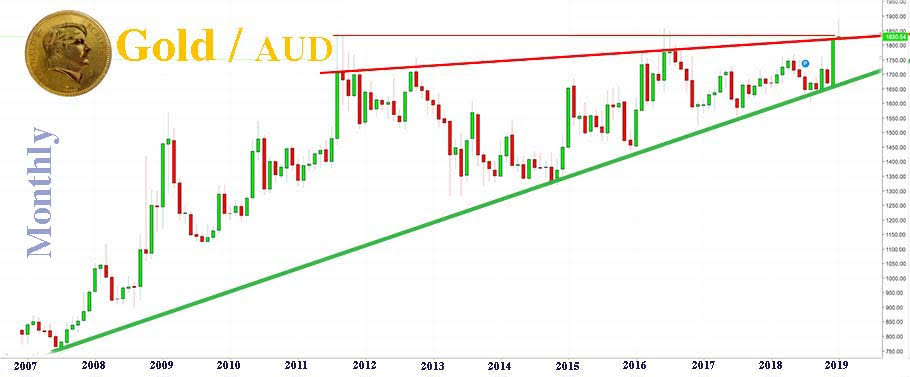
On the Australian dollar gold chart, we can note the effect of the massive unwinding of carry trades at the beginning of January.
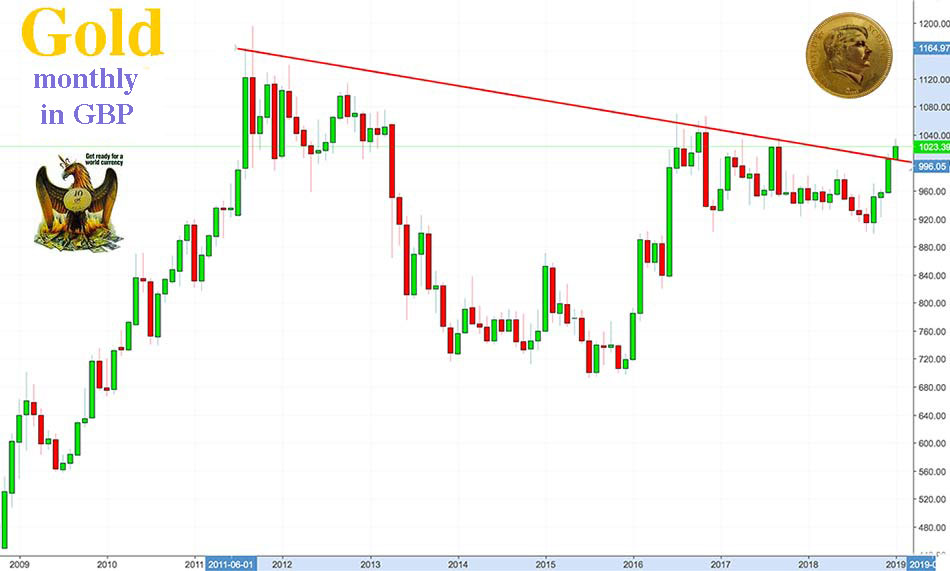
LBMA
We see the same push on gold in pounds sterling.
Many factors have led to this situation, so much so that it would be boring to list them all and even more boring to try to demonstrate which ones are the most important.
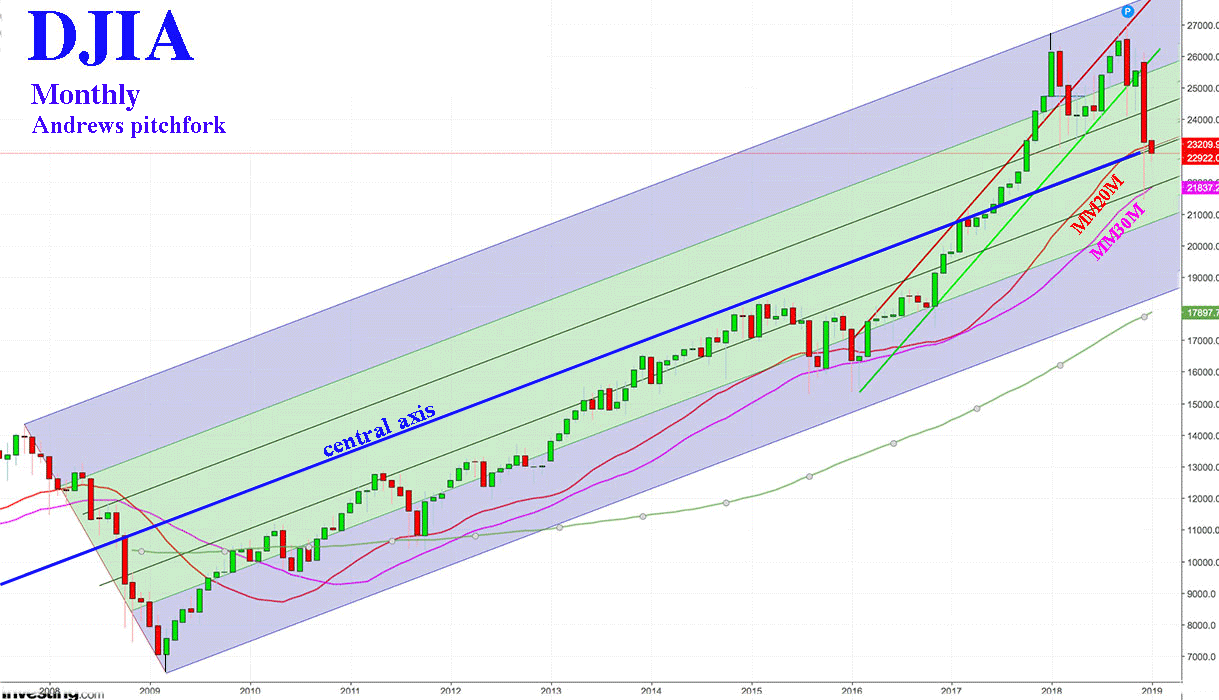
The Wall Street stock market had reached the top of its trading channel, so it was logical that it would consolidate, the more so because the Federal Reserve was raising the base rates and was reducing the size of its balance sheet.
In Europe, the ECB had announced it would end its quantitative easing program, thus reducing its purchases of State or private bonds, which allowed the improvement of European banks’ balance sheets. Yet, despite the ECB’s proactive help and its QE since 2009, the European banking system is still extremely fragile today.
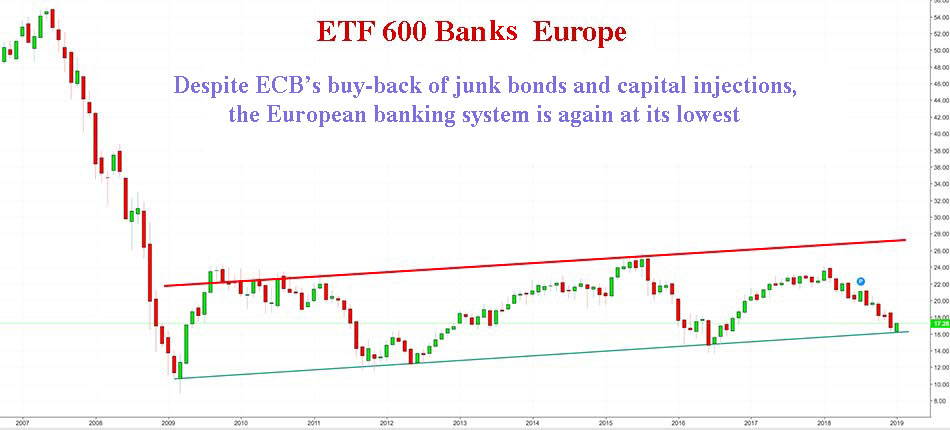
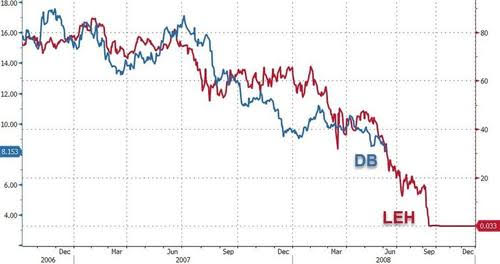
Deutsche Bank, one of the important systemic banks, continues to fall at an alarming rate. Its shares are only worth 5% of their 2007 value.
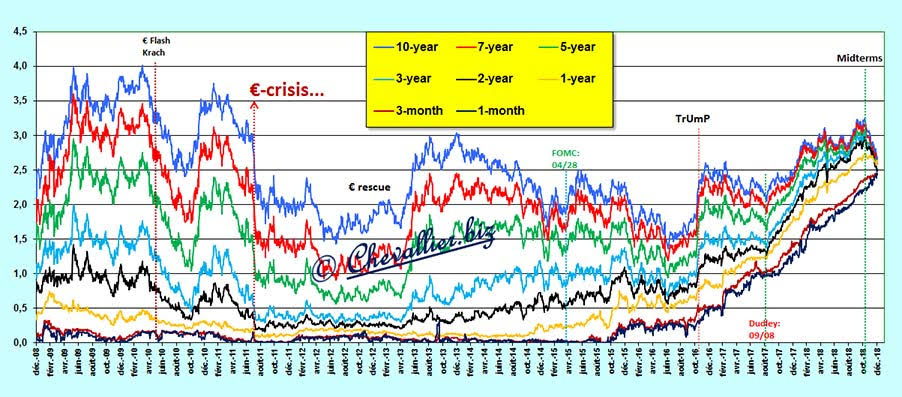
JP Chevallier did an alarming study of the ECB’s balance sheet which justifies a capital outflow from the Euro zone, finding refuge in part in precious metals, but above all massively in U.S. Treasury bonds, adding to the outflow leaving the American stock market for the Treasury bonds as well.
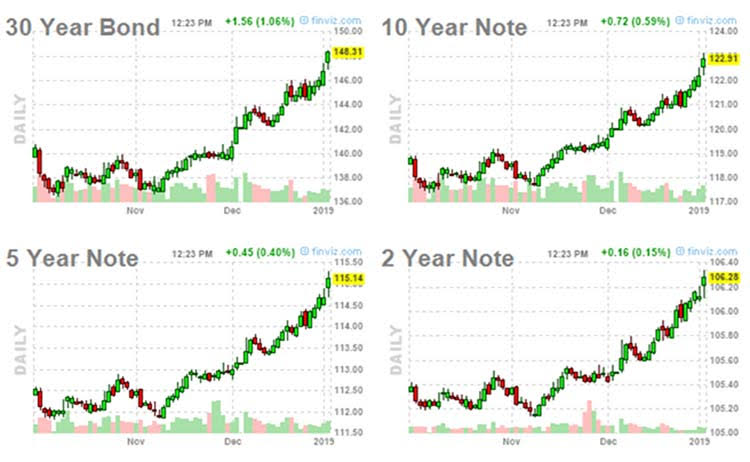
This demand, way too high, brought about a historical anomaly: one-month, three-month or one-year bonds now have the same rates as the three-, five- or ten-year bonds. All of this reflects a real buying panic, a totally out-of-whack bond market, and a bubble.
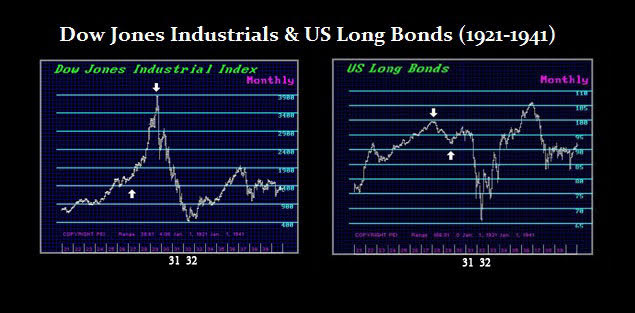
This PANIC UP on the markets is observable on these charts:
Will history repeat itself ?
During World War I, European nations needing capital because of the war suspended their currencies’ convertibility in gold. Accumulated debts provoked successive monetary shocks.
- Hyperinflation of the German mark of the Weimar Republic and of the Austrian currency between 1914 and 1923.
- Poincaré’s Devaluation: the franc, one of three international currency benchmarks, loses 4/5 of its value in gold, in order to get rid of some of the debt.
- Smaller countries defaulted on their debt by equivalent monetary devaluations.
Capital escapes Europe to find refuge in the United States, nearly debt-free after the war and with a powerful industry. This flow of capital provoked a strong rise of the dollar and a ballooning of the American stock market from 1922 to 1929. After the explosion of the 1929 speculative bubble, as the stock market continued to fall and the American economy to plunge into a hard recession, the monetary flow started to reverse. Capital escaped the dollar on the fear of a devaluation, provoking a bond market crash in 1931-32. As you know, the United States effectively strongly devalued the dollar against gold in 1934.
In 2016, Martin Armstrong warned that the Federal Reserve would be forced by domestic policy to raise its rates to stop the stock market bubble. These rate hikes should trigger a worldwide debt crisis and, probably, a Treasury bond market crash, just like in 1931-32. He was thus advising his clients to sell their Treasury bonds and buy corporate bonds from the best companies – the famous “Blue Chips” – while avoiding bonds from banks or insurance companies, which are forced to fill their portfolios with up to 85% of Treasury bonds, often.
At any rate, while secondary issues fill the headlines and attract the attention of ordinary people, real worrisome issues are moving the markets.
This bullish move in precious metals that just started should gather steam from February to May, as the stock markets should go deeper.
Basically, we are privileged witnesses of the first steps of a global change in the international monetary system, which will necessitate a massive revaluation of the precious metals.
Hang tight to your physical without trying to speculate on “paper”.
Reproduction, in whole or in part, is authorized as long as it includes all the text hyperlinks and a link back to the original source.
The information contained in this article is for information purposes only and does not constitute investment advice or a recommendation to buy or sell.


