Written by Jan Nieuwenhuijs for The Gold Observer
The rising 10-year U.S. Treasury interest rate is causing the gold price to decline.
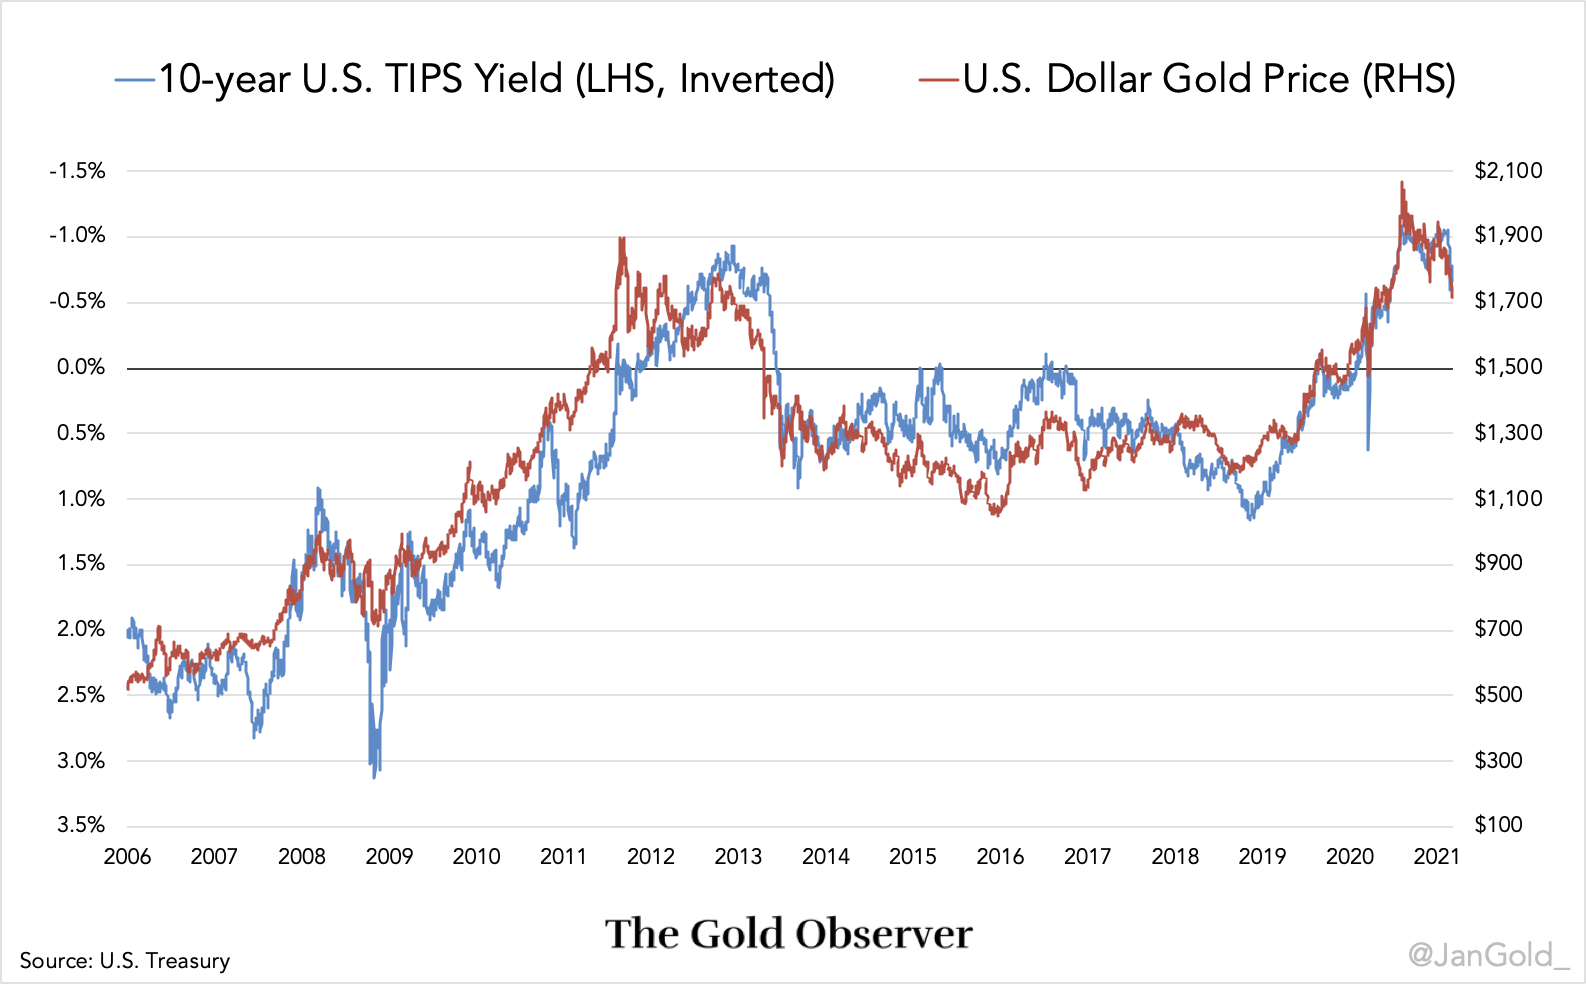
The gold price is inversely correlated to the “real interest rate,” as derived from the 10-year Treasury Inflation Protected Security (TIPS). The 10-year TIPS is a U.S. government bond that protects the owner from consumer price inflation. If the TIPS interest rate, for example, is 1% and annual inflation 3%, the owner of the bond receives 4% interest (1% + 3%). The owner of the bond is always protected against inflation.
In the chart below you can see the correlation between the gold price and the 10-year TIPS rate. Note, the axis of the 10-year TIPS rate is inverted in the chart, because when the TIPS rate falls, the gold price rises, and vice versa.
According to bond market math the 10-year TIPS rate equals the nominal 10-year Treasury interest rate minus inflation expectations.
TIPS rate = Treasury rate – inflation expectations
Since March 2020, inflation expectations have been rising and so did the price of gold. But, from March until September the nominal 10-year Treasury rate barely moved (around 0.6%), after which it began to rise. Since October 2020 the 10-year Treasury rate is rising in a fashion that makes the TIPS rate go up, and thus gold down. At the time of writing the 10-year Treasury rate is roughly 1.6%.
The above is a very brief update on what is happening in the gold market. Currently, I’m working on a few articles that require a lot of research, but I wanted to give you a heads up on the gold price and its interaction with the bond market. We will discuss the correlation between the gold price and real interest rates in-depth in a forthcoming article.
I think the gold price can stay weak for a while, but eventually I’m expecting the Fed to step in and lower long-term Treasury rates. Likely, the Fed will implement yield curve control to manage interest rates across the entire curve. The U.S. government has never been this much in depth and rising rates will push the government into bankruptcy. In addition, rising rates slow the economy (and hurt the stock market), which is not what the Fed wants at this point.
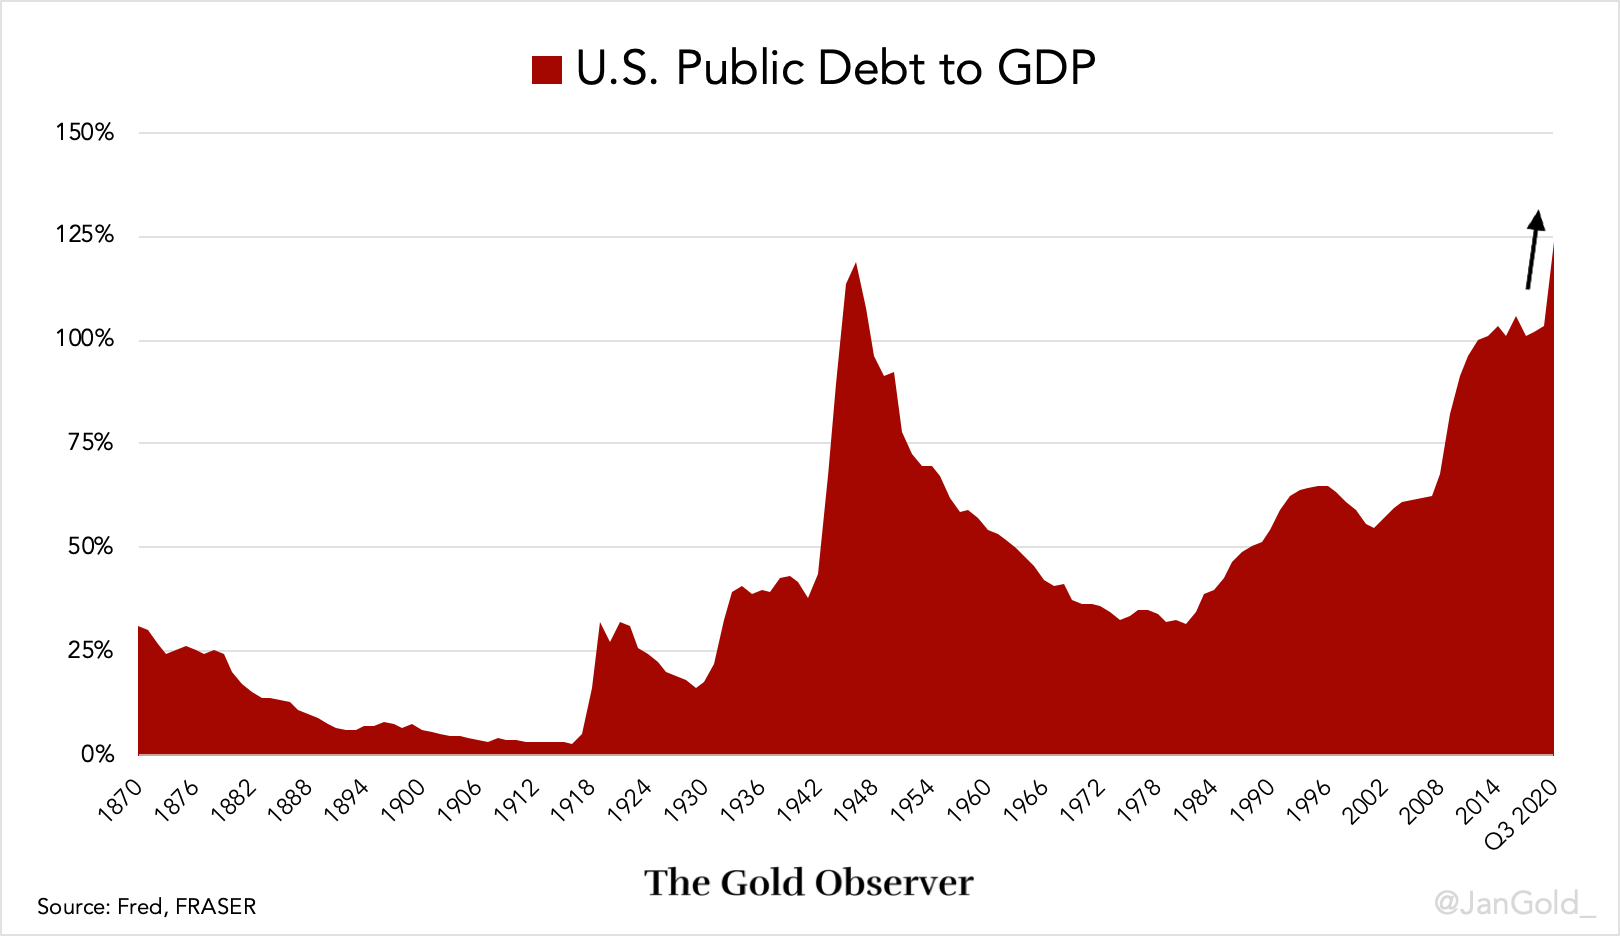
Remarkably, the U.S. public debt to GDP ratio has mainly decreased during the classic gold standard (1870 - 1914) and from 1943 until 1980, which was a period with high inflation and deeply negative real interest rates.
In the current economic environment, the U.S. government doesn’t want to be limited in spending, and so a possible scenario going forward is what happened after the Second World War. In the early 1940s the Fed put a cap on yields of government bonds across the curve; a policy that lasted for two decades. The Fed printed whatever was necessary to fund the government and inflation was allowed to run much higher than interest rates. The result was deeply negative real interest rates, which washed away the debt relative to GDP (see last chart). For more information read my article, “Why Yield Curve Control by the Fed Will Be Bullish for Gold.”
If you enjoyed reading this article please consider to support "The Gold Observer" and subscribe to the newsletter.
Reproduction, in whole or in part, is authorized as long as it includes all the text hyperlinks and a link back to the original source.
The information contained in this article is for information purposes only and does not constitute investment advice or a recommendation to buy or sell.


