Gold is mostly a monetary metal while silver is today mostly an industrial metal, but still with a large monetary component, especially in a monetary crisis, as “poor man’s gold”. Recent performance of silver confirms that even though it is mostly an industrial metal its monetary aspect largely dominates its price performance in these circumstances. With the help of a few graphs, going from the very long term to the short-term, let us look at gold and silver’s performance since the beginning of the 19th century.
North American culture considers a 100-year analysis as an absurdity while, for Europeans, it is acceptable and, for Asians, quite normal. I still have three gold coins left that I received from my grandfather dating to the beginning of the 19th century. I have exchanged some gold coins close to $800 and some at $300 but I was always able to exchange them for a lot of goods and services. One hundred years allows us also to observe the performance of gold and silver through different monetary systems, several economic crises and two World Wars. One hundred years represents also the majority of the fiat money’s history, first backed by gold, and then backed by nothing but trust in sovereign debt. Aristotle, the Greek philosopher, student of Plato and teacher of Alexander the Great, was mentioning fiat money 2,400 years ago when he said, “In effect, there is nothing inherently wrong with fiat money, provided we get perfect authority and godlike intelligence for kings.” Paper money,a more recent form of fiat money,has its origins in China in the 9thcentury. We learned about this first experience and collapse of paper money from Italian explorer Marco Polo, who brought some samples back from his voyage to China.
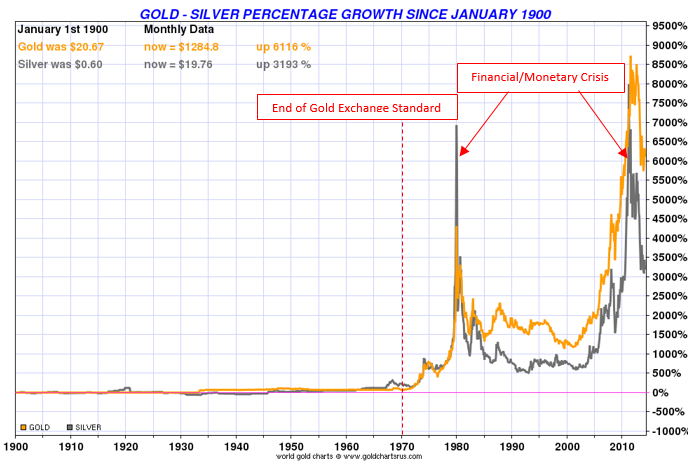
When you first look at the gold and silver chart in graph #1, you cannot avoid but being impressed by the change in percentage growth that happened since 1970. What happened in 1970 to create such volatility and growth in gold and silver price? Even though paper money was introduced at the beginning of the 19thcentury, it was in 1971 that all currencies have been de-linked from real assets through gold. Gold, since 1900, was up 6,116% and silver was up 3,193% but as you can see, most of this stellar performance is relative to fiat money (US dollar) and mostly since 1970. That is the year paper money was totally de-linked from gold.
Chart #1: Gold & Silver percentage growth since January 1900
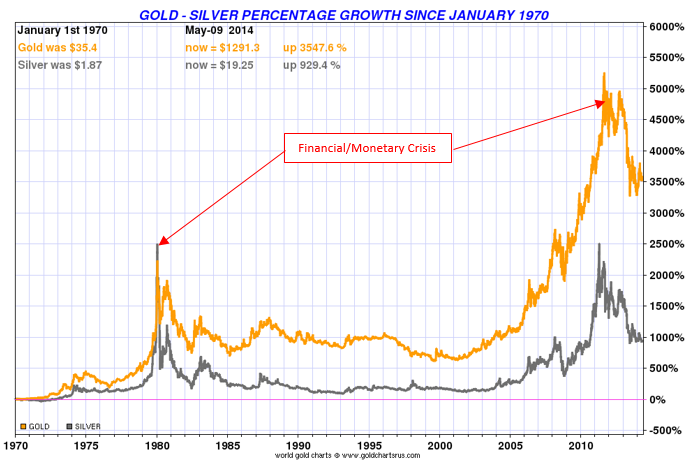
In graph #2 we see the performance of both gold and silver since the end of the gold exchange standard. Gold was up 3,547.6% and silver 929.4%. Both spikes in price took place during a financial/monetary crisis.
Chart #2: Gold & Silver percentage growth since January 1970
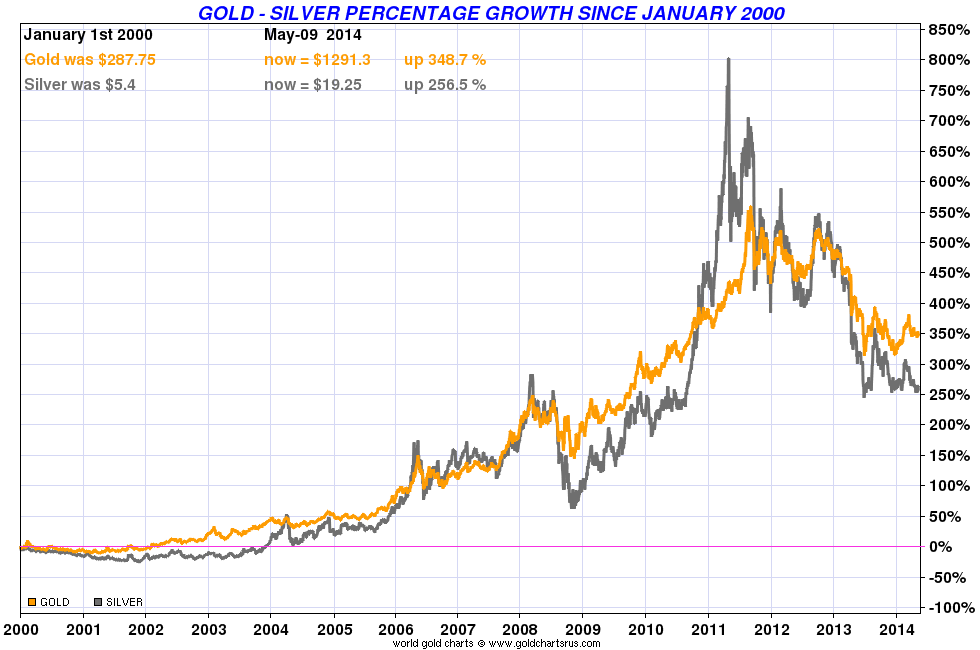
Since 2000, the performance of gold peaked at 550% while silver peaked at 800% and it is now, as of May 2014, at 348.7% for gold and 256% for silver. Even adjusted for inflation, it is still not a bad performance.
Chart #3: Gold & Silver percentage growth since January 2000
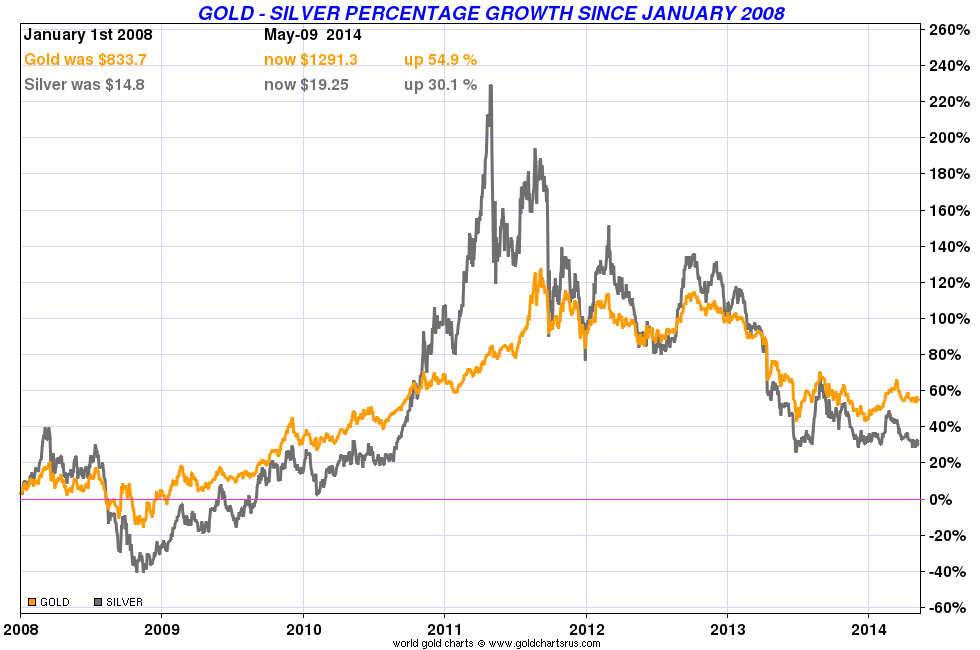
If we look now at the performance of gold and silver since the 2008 financial crisis, we see in graph #4 that, after a drop of about 80% during the crisis,gold and silver grew 94.9% and 70.1%, respectively.
Chart #4: Gold & Silver percentage growth since January 2008
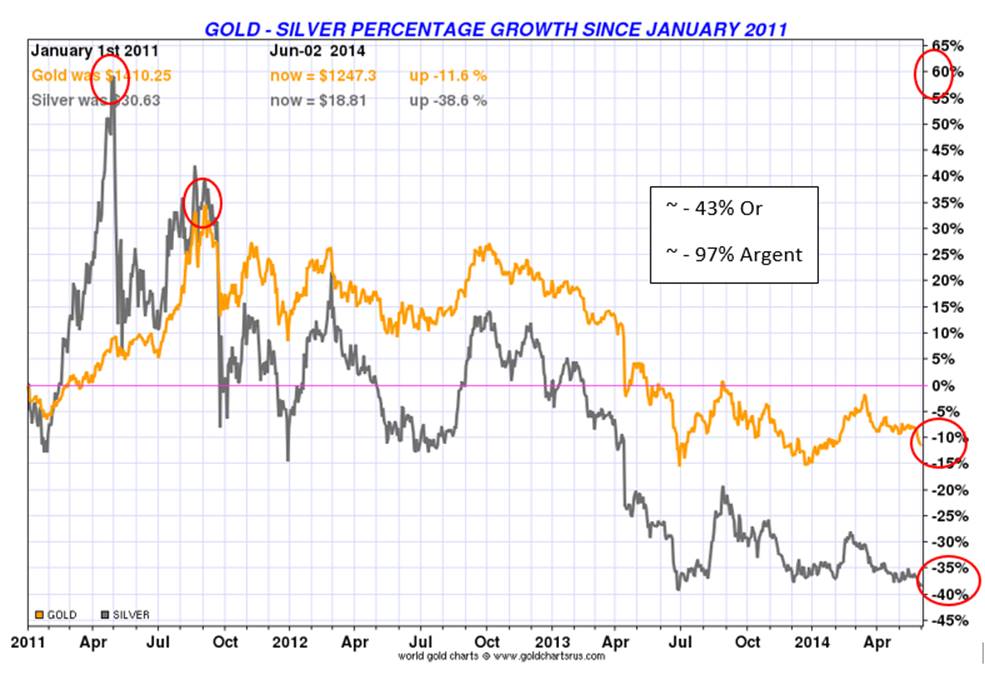
As we can see in chart #5, since the top in April 2011, gold fell 43% and silver 97%. Since July 2013, we seem to be creating a base. Any collapse of the US dollar, which I think is imminent, will create a reversal and a breakout of both gold and silver. I expect gold to lead and silver to follow, but at a faster rate of change. I will not be surprised to see a collapse of the dollar that will trigger major upward moves in gold of $500 per day and the equivalent in silver in that environment.
Chart #5: Gold & Silver percentage growth since January 2011
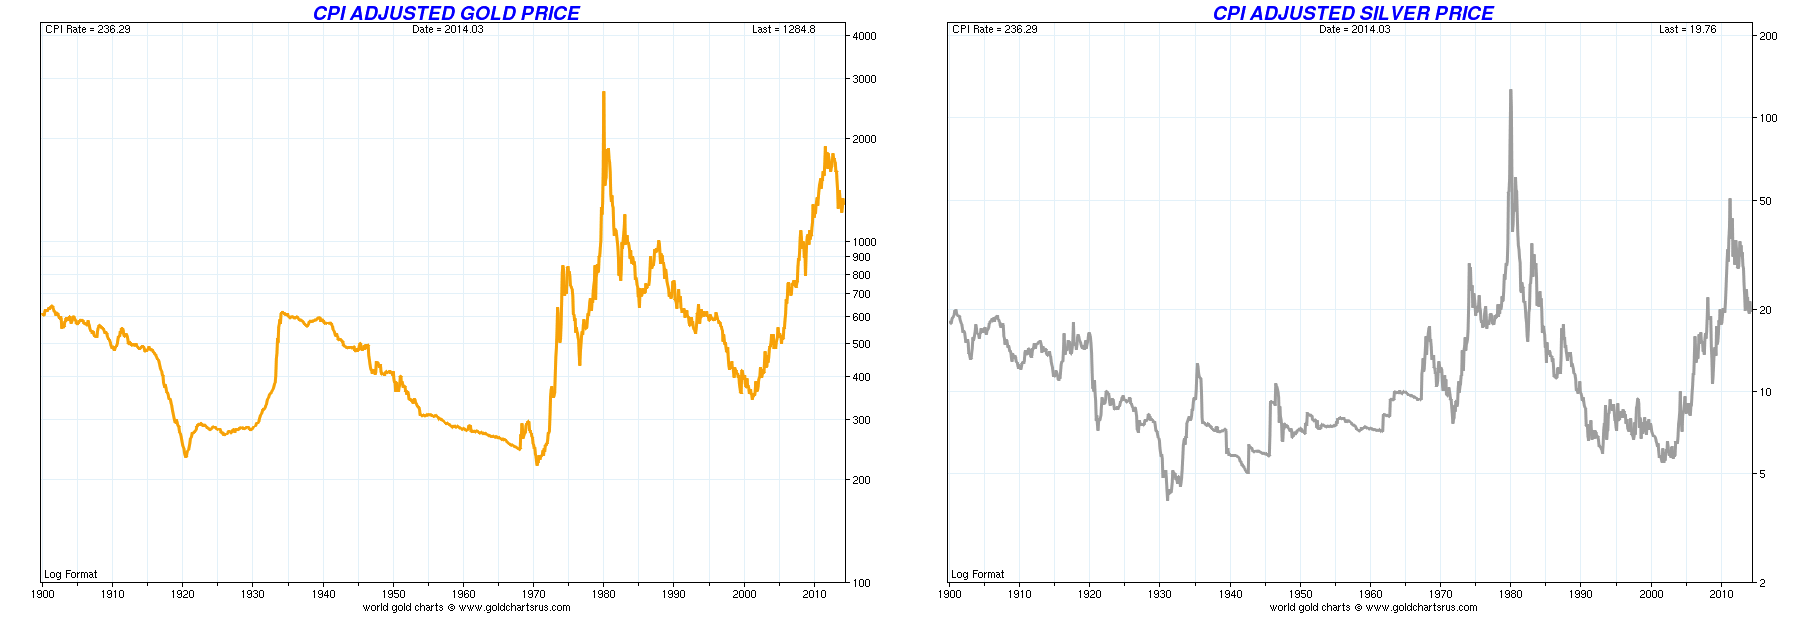
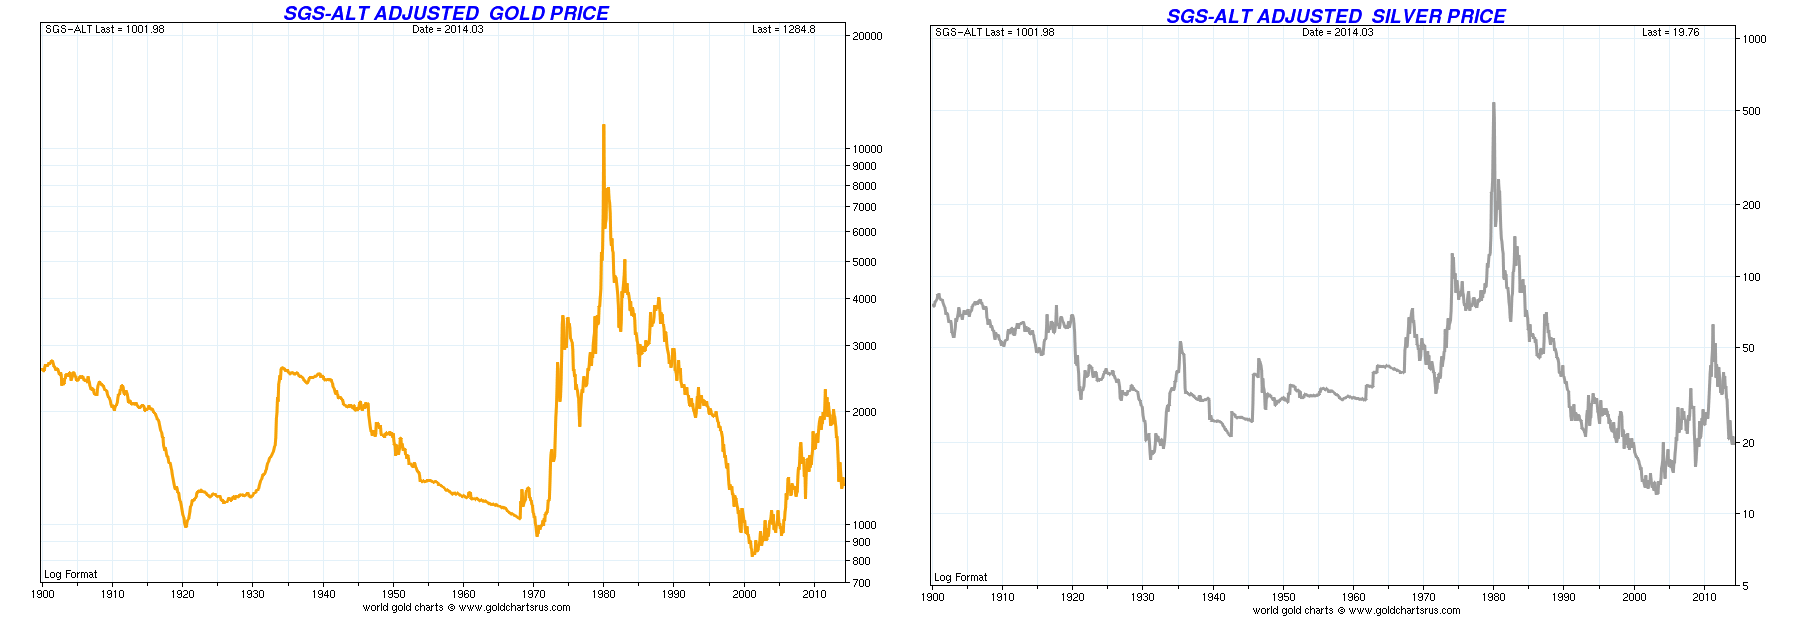
When you look at these performance charts, you must keep in mind that the percentages are in nominal terms, therefore not adjusted for inflation. The two next charts (#6 and #7) show gold and silver prices adjusted by inflation since 1900. You can see the enormous volatility introduced by inflation since 1900.
Chart #6: Gold & Silver real prices (adjusted for official US inflation)
Chart #7: Gold & Silver real prices (adjusted for pre-1980 official US inflation - ShadowStats)
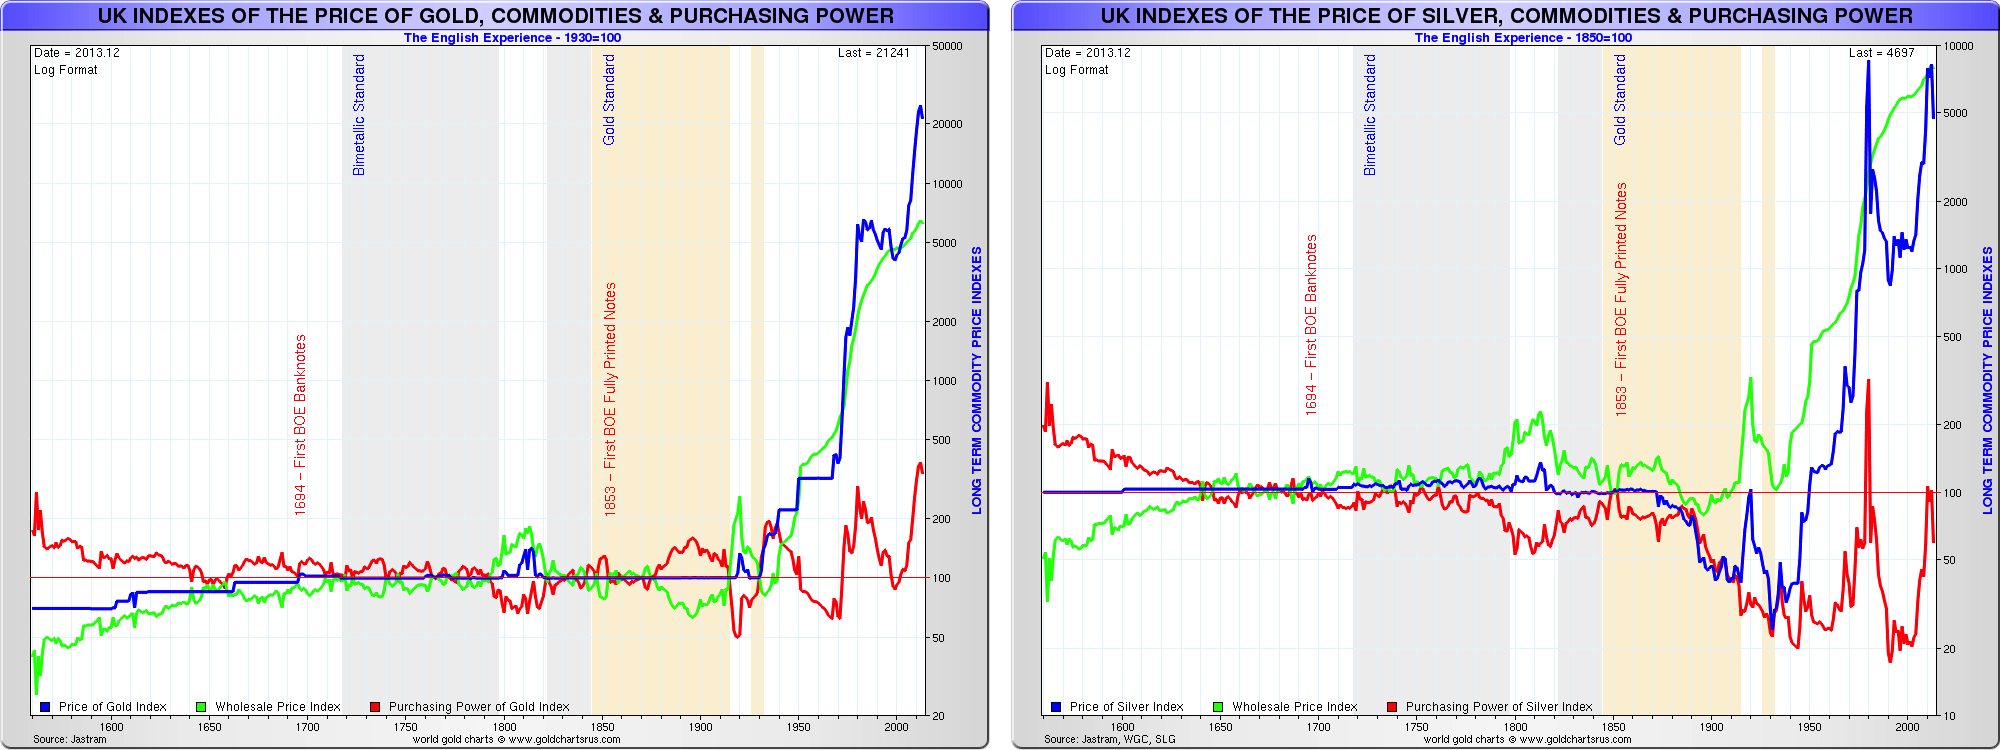
The last two charts (#8), show the evolution of gold and silver prices in British pounds, both versus UK inflation and price adjusted for UK inflation. Again, we see the dramatic volatility introduced by inflation and the illusion of money that inflation creates.
Chart #8: Gold & Silver prices adjusted for inflation since 1520 (Nominal, Real & UK Inflation)
Regularly I am criticized by people, mostly traders and mostly from North America, for showing very long-term charts. However, at this very important time in history when paper money is very close to a collapse and an international monetary system reset, it is very foolish to ignore history. Riding the waves when a tsunami is coming is very foolish. History repeats itself, but not necessarily the most recent one. We are witnessing events we have not seen in 300 years. Most of the financial and economics manuals have been written in a never-ending inflationary environment. Regularly we hear, even traditional economists and central bankers, say that we are in “unchartered territory”. Having a longer time perspective today is not a luxury but a necessity.
Even for those who bought gold and silver at the top in 2011, at US $1,911 and US $46 respectively, and have now a loss of 43% and 97% respectively, if they bought gold and silver as a protection against the collapse and a reset of the current monetary system, then they will soon not regret their decision. If they bought for short term speculation, then they should have followed technical indicators and timed their exit and re-entry to avoid the pain of the loss. Behavior finance research found that the pain of a loss is three times larger than the pleasure of a gain; so the pain of the 43% nominal loss for gold must fell like a 129%loss and the 97% nominal loss for silver must feel like a 291% loss.
Gold and silver (as the poor man’s gold) are hard cash and, in either a deflationary or hyperinflation collapse, will at least maintain their value with respect to other hard assets. What is important to remember is that gold and silver are also hard currencies, since they are the most liquid and marketable assets. You should not invest in them but use them as a protection against uncertainty. There will be a time after the reset of the international monetary system to exchange them for whatever you wish.After the collapse of the current monetary system, you will be glad to have hard money to exchange in the new system that will emerge. Just as in 1945, the collapse of the pound Sterling was not the end of the world, nor will a collapse of the US dollar be the end of the world, but just a reset.
Charts by Nick Laird
Reproduction, in whole or in part, is authorized as long as it includes all the text hyperlinks and a link back to the original source.
The information contained in this article is for information purposes only and does not constitute investment advice or a recommendation to buy or sell.
