The previous Silver corners
In the early 1970s, the Hunt brothers, who had made their fortunes in oil, panicked at the sight of galloping inflation, since the Federal Reserve had abandoned the defense of the fixed price of gold in dollars. As in the United States it was forbidden to hold more than a certain amount of gold, they decided to invest heavily in silver.
When they started, one ounce of silver was worth $1.30. On the last day of the hike, in January 1980, silver reached $50, before the Hunt brother were crushed by the Fed.
What is surprising is that the Hunt brothers and their associates in the emirates had only amassed about 100 Moz of physical silver. Besides that, they had bought all the futures contracts on the markets, which they had to sell with huge losses, because of margin calls.
In October 2009, China banned the export of silver, depriving the market of approximately 154 Moz, and blocking JPM in a short-squeeze by not delivering the silver sold by China through Bear Stearns. This caused prices to skyrocket in 2010 and 2011. The silver price climbed from $14.67 to $49. In May 2011, the CME changed the rules to crash the speculators with 5 successive margin calls… exactly like in 1980.
At the beginning of 2009, when silver was at $14.67 the whole silver market was worth about 13 billion dollars.
2018 - Between January and July, the “smart money” asked delivery of 1,820 Moz that they bought for 29 billion dollars. They started buying all the physical silver available on the market. When the second circle of insiders will be informed is extraordinary opportunity, there will be a rush of new investors, who will try to take advantage of the windfall. Billions of dollars will be invested in a very small market.
On July 6th, Andrew Maguire confirmed this move of the smart money on KWN: “We are also evidencing a large move to allocate and remove gold and silver from the interconnected legacy banking system. This is creating a supply shortage ahead of season.”
More than 75% of the above-ground silver is already in private hands.
India Silver Imports
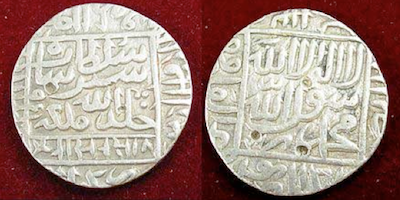
“Rupee” means "silver coin"
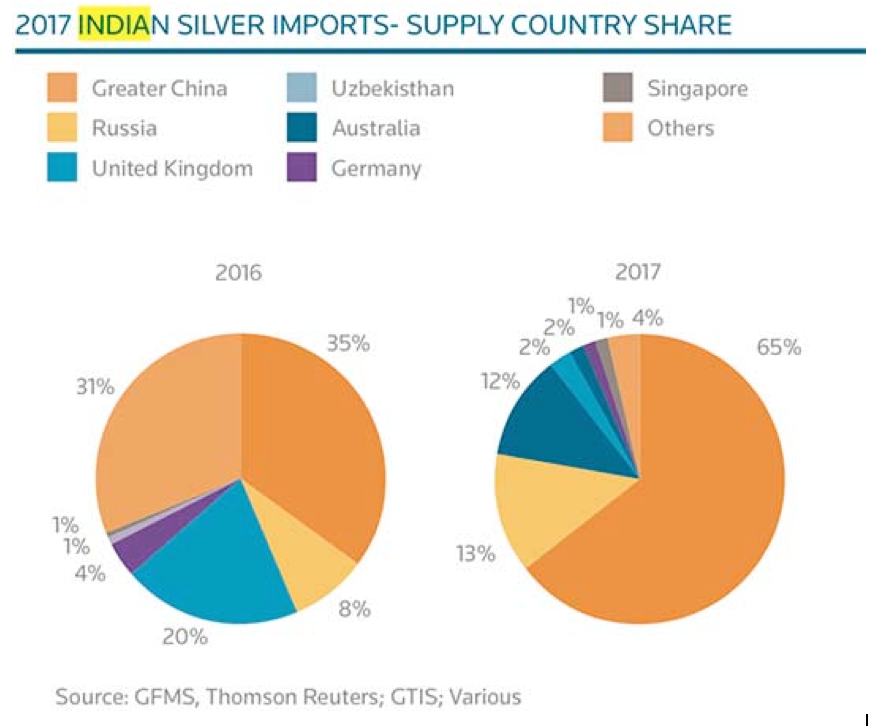
India imported an average of 2,667 tonnes of silver between 1999 and 2010. Then, from 2011 to 2017, India imported an average of 5,375 tonnes per year. In 2018, if it continues at the same pace, India could import 8,667 tonnes.
Indian industry (which includes jewelery) only needs 2,667 tonnes. The average surplus of 2,700 tons since 2011 has been imported by six banks and eight agencies, as you can see in the World Silver Survey 2017.
Since 2011, these buyers could have accumulated a treasure of 25,000 tons (881 million ounces).
And they bought their silver mainly outside of the LBMA :
The Gold/Silver ratio
In the history of humanity, gold and silver have always been monetary references. Gold/Silver ratios have often fluctuated from one continent to another and from one era to another. When European mines were exhausted in the late fifteenth and early sixteenth century, the Gold/Silver ratio was 1/10 in Europe against 1/5 in China.
The bimetallic monetary system set up by the French Convention in 1795 set a ratio of 15.5, which will remain the international reference until the First World War.
Today, the ratio fluctuates according to the manipulations of the market. But if you look at the data published by the USGS year after year on gold and silver :
- When the world gold production is 2,500 tons, the world silver production will be evaluated to 25,000 tons. The ratio is 1/10.
- When the world’s gold reserves are estimated to 50,000 tons, the world’s silver reserves are calculated to 500,000 tons, The ratio is 1/10.
All figures produced by the USGS are false, but they wrote those numbers, year after year on the same Gold/Silver ratio basis: 1/10.
I conclude that this ratio has been for decades a political will.
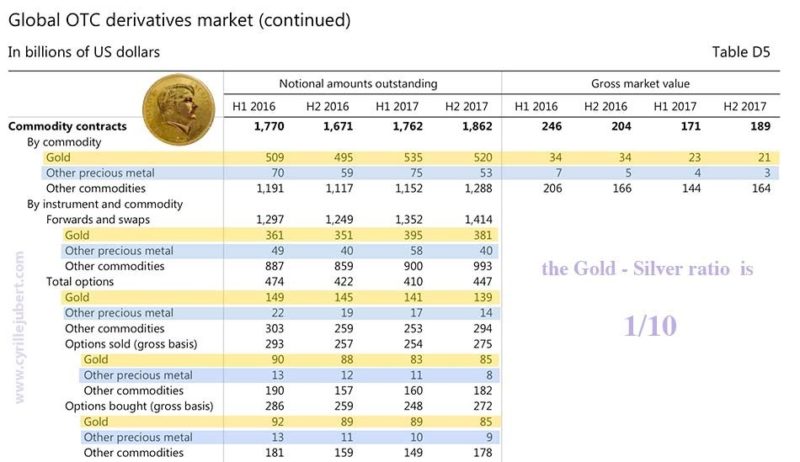
If you study the global derivatives statistics on the BIS’s website here, the ratio between gold and silver is once more 1/10.
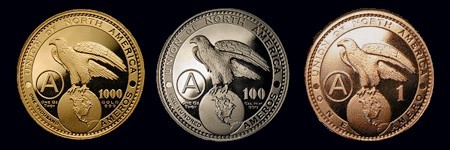
Ten years ago, there was a project to launch a single monetary unit for NAFTA, called Amero. Just like the Euro for the European Economic community.
A few prototypes had been coined by the US Mint. Each coin weighs an ounce.
The ratio of these coins was 1/10.
The World Gold council says there are 190.000 tons of gold above-ground.
The World Silver Survey tells there are 86,651 tons of silver above-ground.
So there is more than twice as much gold as silver.
Should gold be priced at $8 or silver at $2,400?
Be sure that the people who are cornering the market right now did the same math.
The Gold/Silver ratio which is at 1/78 today, will crash severely in the three years to come.
For an investor, that means that investing in silver will be nearly 8 times more interesting than investing in gold, whatever the future price in gold.
The next silver rally
The rise of silver can be slow or very brutal.
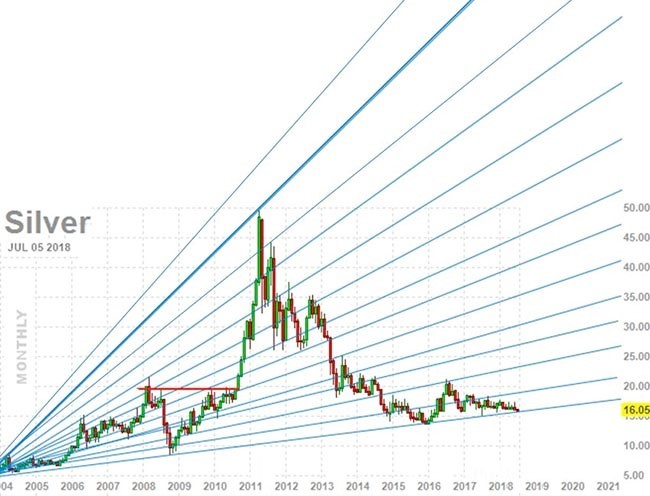
A slow rise will already be surprisingly fast. Refer to the 2010-2011 graph.
In September 2010, silver broke the resistance, which had held for two years.
Then the prices rose from $18 to $50 in just six months, jumping from a Fibonacci fan to the next.
The rise will go faster and faster when the $50 level will be broken.
A brutal rise
The COMEX Rule N° 589, which entered into force on December 22, 2014, could be applied at any moment.
Let’s suppose that silver price is $16. At some point nobody will want to sell their physical silver. Buyers will then be forced to raise the auction. After a rise of $3, the market will be stopped two minutes to let buyers and sellers negotiate. Then the market resumes, the auction goes up by $3… etc. When the threshold of $12 rise in the day is reached, without anyone wanting to sell physical silver, the market will be closed. And there will be no fixing for that day. Without a fixing, nobody will be able to buy or sell silver in the world until the next fixing.
The second day, the silver market opens at $28. But nobody agrees to sell physical silver at this price… so as the day before, the price rises by $12… but there is once more no fixing.
In two weeks, 10 business days of trading, price will increase from $16 + $120 = $136. Have fun and do the math by yourself.
And during this entire period without fixing, no one will be able to buy or sell silver in the world.
—–
Did they create this rule to solve the problem of a future Big Corner?
Timing
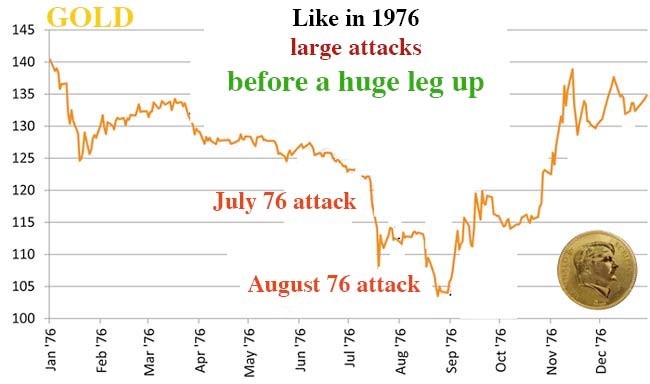
Just like in 1976, there had been attacks on gold and silver in July. It could be the same in August.
In the last days of August 1976, silver was at $4.08.
In January 1980, one ounce of silver was at $49 as you can see here.
Israel Friedman wrote in 2006: "Only a shortage in physicals can bring high prices and defeat the paper market and force the naked short sellers into bankruptcy."
The shortage is here. It is a fact.
In the weeks to come, you should find many articles to read about the growing delays in delivery of silver. There should be real problems for delivery at the end of September and the beginning of October. Prices will climb fast to $20 this autumn.
The first leg of this silver bull market is about to be launched.
The first leg should bring silver between $150 and $200.
There will be a consolidation during a krach on the markets and then the second leg will start, going to the moon.
For the moment, let’s enjoy the first wave. It is the calm before the storm.
Remember, the rule for silver is the same for gold : if you don’t hold it, you don’t own it.
Reproduction, in whole or in part, is authorized as long as it includes all the text hyperlinks and a link back to the original source.
The information contained in this article is for information purposes only and does not constitute investment advice or a recommendation to buy or sell.


