Since January 1, the price of gold has posted a steady gain of ~4,5%. After reaching an initial peak in late January, the precious metal has been attempting to enter a new sustained uptrend, targeting $5,500.
However, geopolitical tensions related to the war in Iran have reignited inflation fears, leading to a rise in interest rates and reviving the risk of recession.
Furthermore, the decline in open positions observed since October — and even more sharply at the end of February — suggested a consolidation phase for the price of gold. The question now is whether a rebound can begin and, if so, to assess its magnitude.
While some banks maintain expectations of prices exceeding $6,000 per ounce, and following gold’s spectacular rise in 2025, should we expect this super-cycle trend to continue?
Is the current consolidation merely a short-term adjustment, or does it signal a more structural shift?
A technical consolidation
An analysis of open positions since the end of 2025 suggested a decline in investor interest. In other words, the rise in the price of gold was not accompanied by an increase in the number of open contracts in the derivatives markets. Furthermore, this decline in open positions accelerated at the end of February, as we noted at the time.
This particularly significant signal seemed once again to herald a gradual withdrawal of investors from the precious metal. So, how can we explain this partial withdrawal by the major players in the gold market?
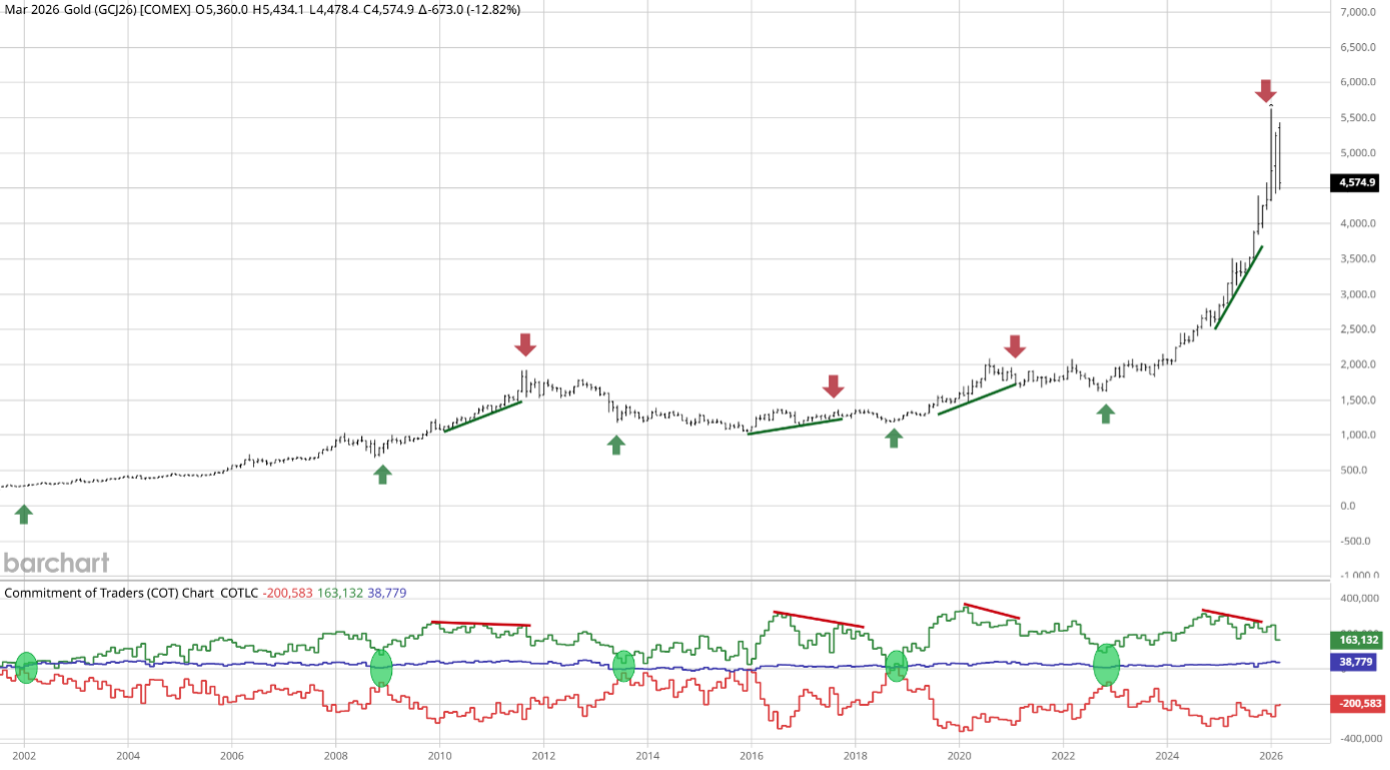
The price of gold is currently fluctuating between periods of technical consolidation and technical rebounds. Since our last analysis, open interest in the gold market has continued to decline, leading to price consolidation. Market participants began to pull back from October onward, creating a classic divergence near the gold price peaks, a pattern already observed during the peaks of 2011 and 2020.
At the same time, flows into ETFs remained bearish. Nearly 25 tons of gold were sold during the first two weeks of March, a volume that remains limited, however, compared to the 146 tons acquired over the entire first quarter.
However, a further rapid decline in open interest during April could, paradoxically, generate a buy signal. While the current trend clearly reflects a pullback by speculative investors, it cannot be ruled out, in the current context, that they may return to the market.
The current instability in the price of gold appears to be primarily linked to a period of high volatility, comparable to that observed in 2008. This “contagion” effect between stock indices and precious metals once again illustrates the essentially technical nature of the current decline.
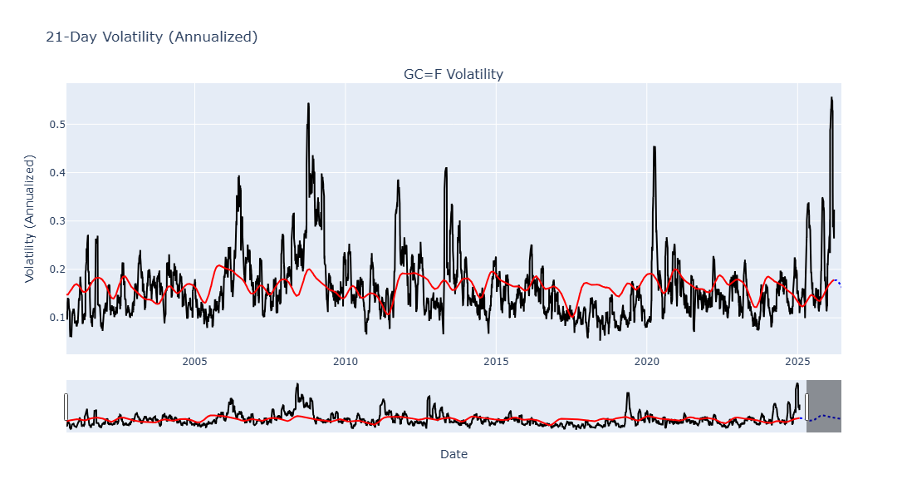
Data source: yfinance
Banks maintain a strong outlook
Despite the conflict in Iran, major international banks have not revised their price targets for gold. JPMorgan Chase maintains a forecast of $4,300 per ounce for the second quarter, with potential for the price to reach $6,300 by year-end. Wells Fargo and UBS also hold similar outlooks.
In the longer term, JPMorgan Chase has raised its target to $4,500 per ounce, highlighting in particular the ongoing shifts in international monetary policy. While this level appears consistent with current prices, a further rise toward $6,300 remains contingent on monetary easing — specifically a rate cut — or the onset of a recession.
For its part, Goldman Sachs maintains a target of $5,400 per ounce by December. Other institutions, such as HSBC and Commerzbank, are more cautious and are targeting a range between $4,500 and $5,000 per ounce by the end of 2026.
From a technical perspective, the key support levels are around $3,900–$4,000. As long as gold remains above the $4,000 threshold, the bullish momentum that has been in place since 2023 remains intact, particularly if the derivatives markets continue to send favorable signals.
A break below the $4,000 zone could, however, invalidate the assumption of a return to previous highs. Key support levels are around $3,500, or even, in an extreme scenario, $3,000, a level that also constitutes an important “fundamental” zone. The invalidation of a potential rebound would also raise questions regarding its duration and magnitude — potentially shorter — of the current cycle compared to previous bull markets.
Historical Comparison of Gold Prices
Despite the lack of usable historical data on gold prices — since the price was managed until the end of the Bretton Woods system in 1971 — we propose the central hypothesis that cycles of approximately 16 years persist in the gold market. This hypothesis is based on a combined spectral, graphical, and fundamental analysis of the market.
Since the late 1960s, the gold market has indeed experienced three major bull cycles:
- 1968–February 1980 (approximately 12 years): the price of gold increased more than 24-fold over the period.
- August 1999 – September 2011 (12 years and 1 month): the price increased nearly sevenfold.
- November 2015 – present (approximately 10 years and 4 months to date): the price has increased nearly fivefold.
Furthermore, it is possible to identify an intermediate “bull” phase — more sideways than truly bullish — between 1985 and 1996, which can be interpreted as a consolidation cycle following the exceptional performance of the previous cycle.
These major bull markets are generally driven by a combination of fundamental factors specific to the metals market — such as supply constraints or production difficulties — as well as by the broader macroeconomic environment (inflation, monetary policies, financial instability).
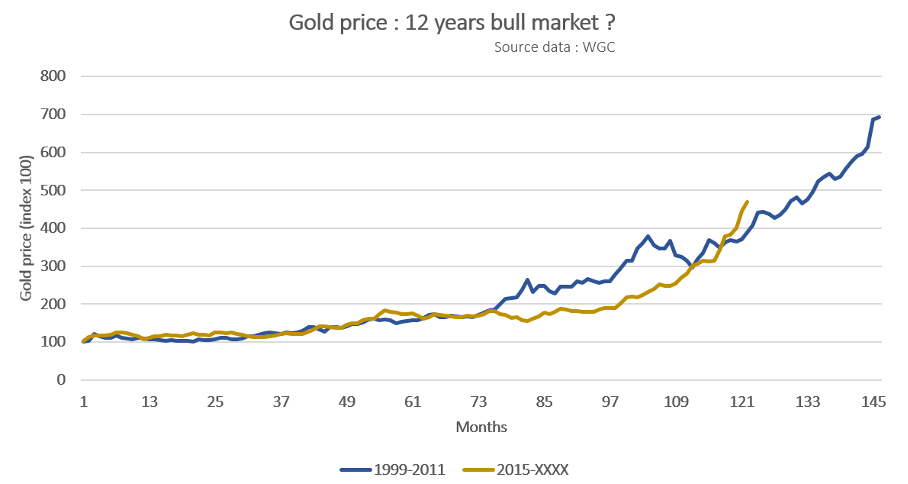
Data source: WGC
The current bull market in gold prices shows a certain symmetry with that observed during the previous cycle. At this stage, the gap between the two trends remains relatively narrow. Assuming that gold’s performance were comparable to that recorded between 1999 and 2011, the price could still rise by several dozen percent. This upside potential could reach up to 40%, or a price of approximately $7,000 per ounce.
Furthermore, the use of the term “super-cycle” seems appropriate given the exceptionally long duration of this trend, compared to that observed in other financial assets. A supercycle can be defined as a cycle whose duration exceeds that of the traditional economic cycle, with the Juglar cycle generally estimated to last between 7 and 10 years.
The gold cycle could thus span up to two Juglar cycles, potentially encompassing two recessionary phases. In this sense, it extends beyond the strict economic cycle framework.
The uncertainty surrounding the peaks in the price of gold
However, this bullish scenario, although supported by many banks, has obvious flaws. The graphic below shows how the price of gold has moved within an upward channel since 2000. The recent peak aligns with the upper boundary of this channel, though it does not represent an extreme extension of it.
It is also worth noting that this extreme level coincides with the previously mentioned levels ($6,500 // $7,000). Reaching such targets would therefore require a particularly sustained, potentially rapid, and transitory upward momentum. Nevertheless, the length of this price structure, as well as the limited number of anchor points, call for caution and a degree of reserve in interpretation.
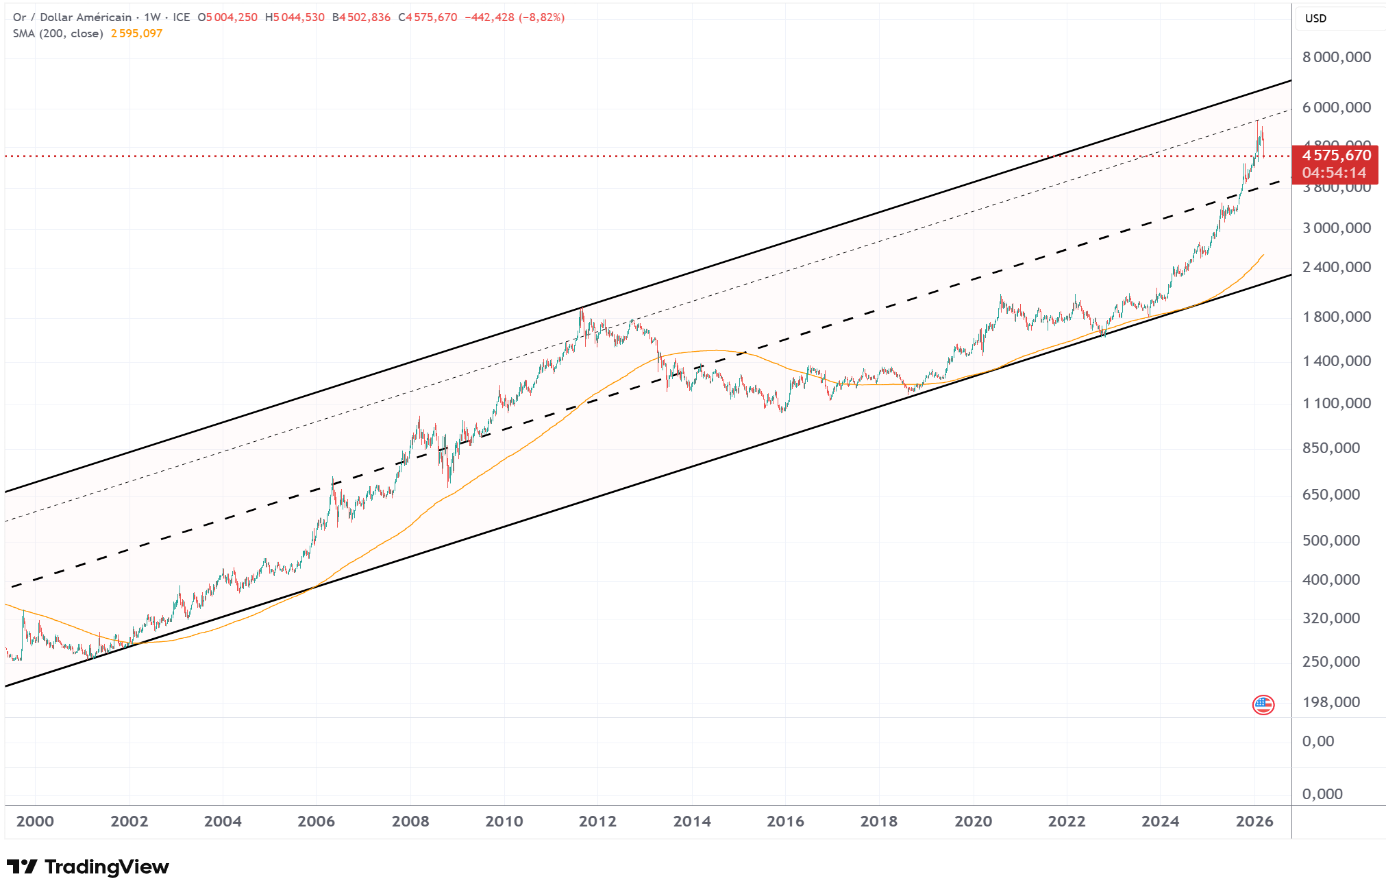
Graphic source: tradingview.com
This caution is reinforced by the decline in open positions, which has historically been associated with downside risks. Furthermore, peaks in the gold price can take various forms. The 1980 peak, for example, was preceded by a first major peak in 1975, while the 2011 peak was followed by a period of stagnation lasting more than a year.
The bull market of the 1980s was heavily influenced by the severity of the oil shocks. High interest rate volatility at the time led to particularly abrupt market movements, alternating between rapid rises and falls. To date, the current dynamics more closely resemble those observed between 1999 and 2011. However, to a lesser extent, the possibility of two major peaks marking the end of this supercycle cannot be ruled out.
Finally, it is worth noting that the peaks of 1980 and 2011 were characterized by reversal patterns that extended the bullish momentum for nearly a year.
How should we respond in the event of a recession?
Since 1980, gold has averaged a return of approximately +4% during U.S. recessions, which have lasted an average of about ten months. However, this trend masks some variations: notably, the recessions of 1980 and 1990 were accompanied by a decline in the price of gold.
Furthermore, gold tends to post positive returns or, at the very least, outperform stock market indices (S&P 500) when the latter experience corrections of more than 10%.
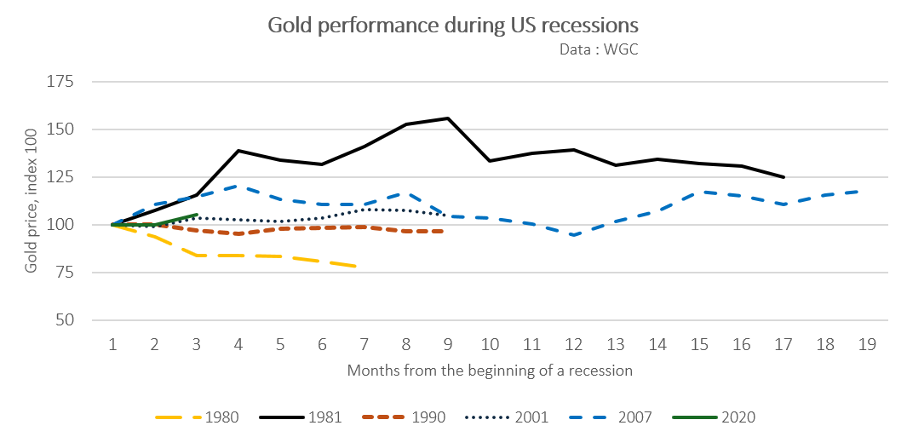
Data source: WGC (average gold price)
Against the backdrop of a declining bond market, gold thus appears to be one of the most effective diversification tools. It is also likely that gold’s volatility will return to more moderate levels. As a result, the gold market could return to a more stable trajectory.
Conclusion
We have shown that the price of gold is currently undergoing a period of technical consolidation. The decline in open positions observed since the fall — and even more markedly since late February — is encouraging profit-taking. Against this backdrop, the broad-based decline in equity and bond markets is exerting downward pressure on the price of gold. However, two factors call for a more nuanced interpretation of this consolidation.
First, our position in the gold cycle. The recurrence of bullish phases lasting approximately twelve years suggests that the underlying trend remains intact to date. Only a sustained break below the $4,000 level would technically call this uptrend into question. While this level could be reached in the coming months, the current environment nevertheless calls for caution.
Second, the nature of peaks in the gold market. Historically, peak phases do not occur at a single point in time but generally extend over more than a year. Therefore, given the likelihood of a recession and a correction in the indices, it is possible that the gold price has not yet completed its upward phase. The challenge now lies in assessing the magnitude of a potential rebound, the confirmation of which will depend in particular on a signal regarding open positions.
In short, the current decline in the gold price is mainly due to a gradual withdrawal of investors, combined with increased volatility across all financial markets. A return to more stable conditions could thus favor the repositioning of gold as a hedging asset during market corrections or even an economic recession.
In this regard, maintaining key technical levels is a determining factor for a rebound to materialize.
Reproduction, in whole or in part, is authorized as long as it includes all the text hyperlinks and a link back to the original source.
The information contained in this article is for information purposes only and does not constitute investment advice or a recommendation to buy or sell.


