The night of March 31st to April 1st saw a spectacular turnaround in the gold market. As reported in the monthly bulletin reserved for clients of GoldBroker, published the very next day, COMEX posted an unprecedented figure at the close of March 28: 106,662 gold future contracts expiring in April remained open, equivalent to 10.66 million ounces, or around 332 tons. This volume corresponded to almost 51% of the “eligible” stocks available in the COMEX vaults (20.7 million ounces), raising fears of a massive and immediate demand for physical delivery. Such a scenario would have constituted an unprecedented stress test for the market infrastructure.
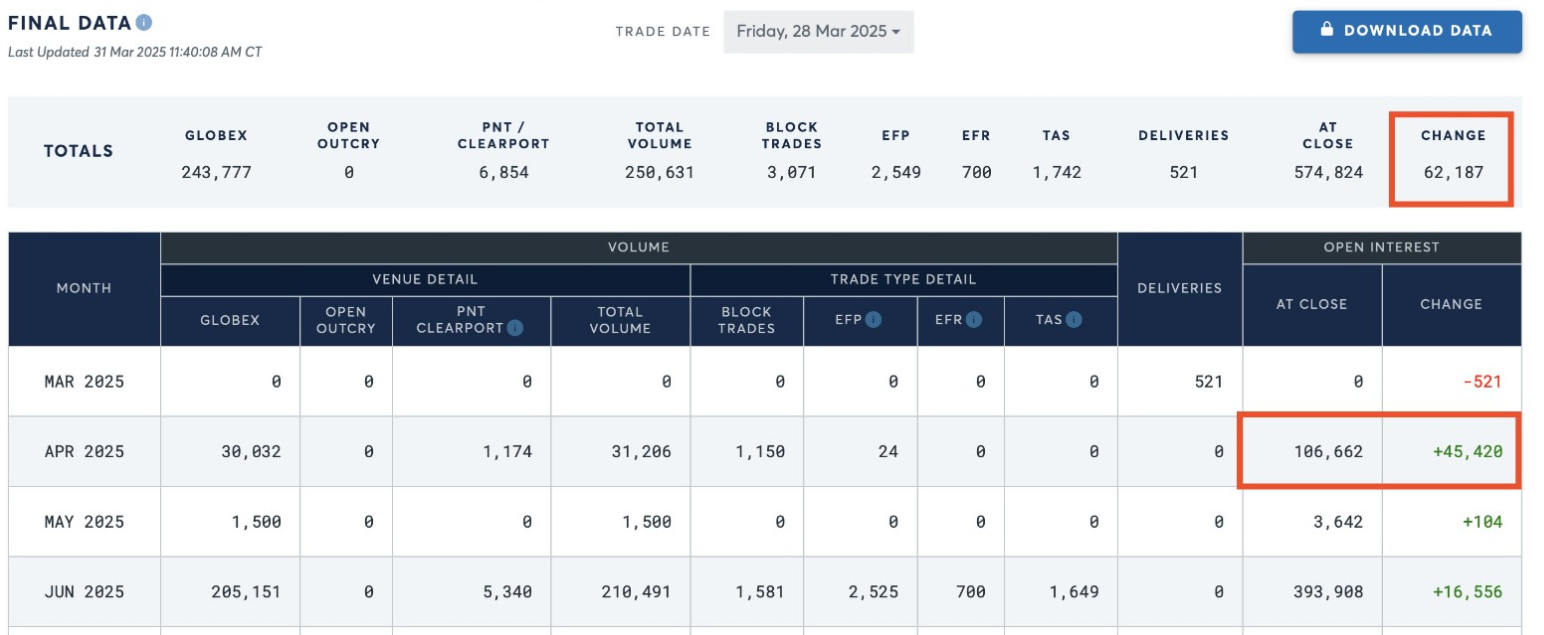
However, in the very last hours before the switch to April, the situation changed dramatically: almost 90,000 contracts were closed, cancelled or “rolled over” to other maturities. In the end, only 34,865 contracts, or 3.49 million ounces, were officially released for delivery on April 1, reducing actual demand to around 16.9% of eligible stocks.
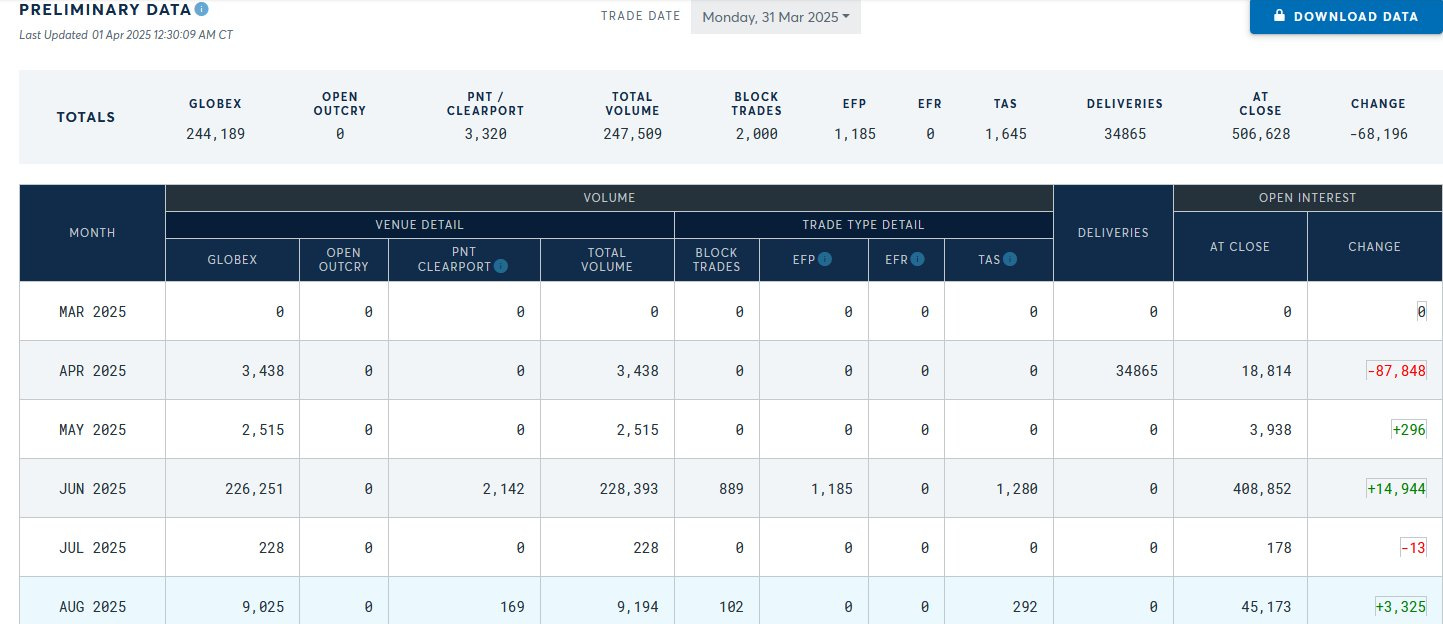
This sudden withdrawal avoided an immediate logistical shock. However, the abruptness of this turnaround raises several questions. Was it a classic end-of-term strategy? Was it an attempt to put pressure on the market, without any real intention of asking for delivery? Or was it the result of discreet interventions - between major institutions, or with the support of regulators - to defuse a high-risk situation?
Although final demand remains strong, this reversal shows just how far the system can wobble under physical pressure. It also highlights a gradual loss of confidence in purely financial settlements. The episode may have been mastered, but the tension has not dissipated. It wasn't a collapse, but a warning.
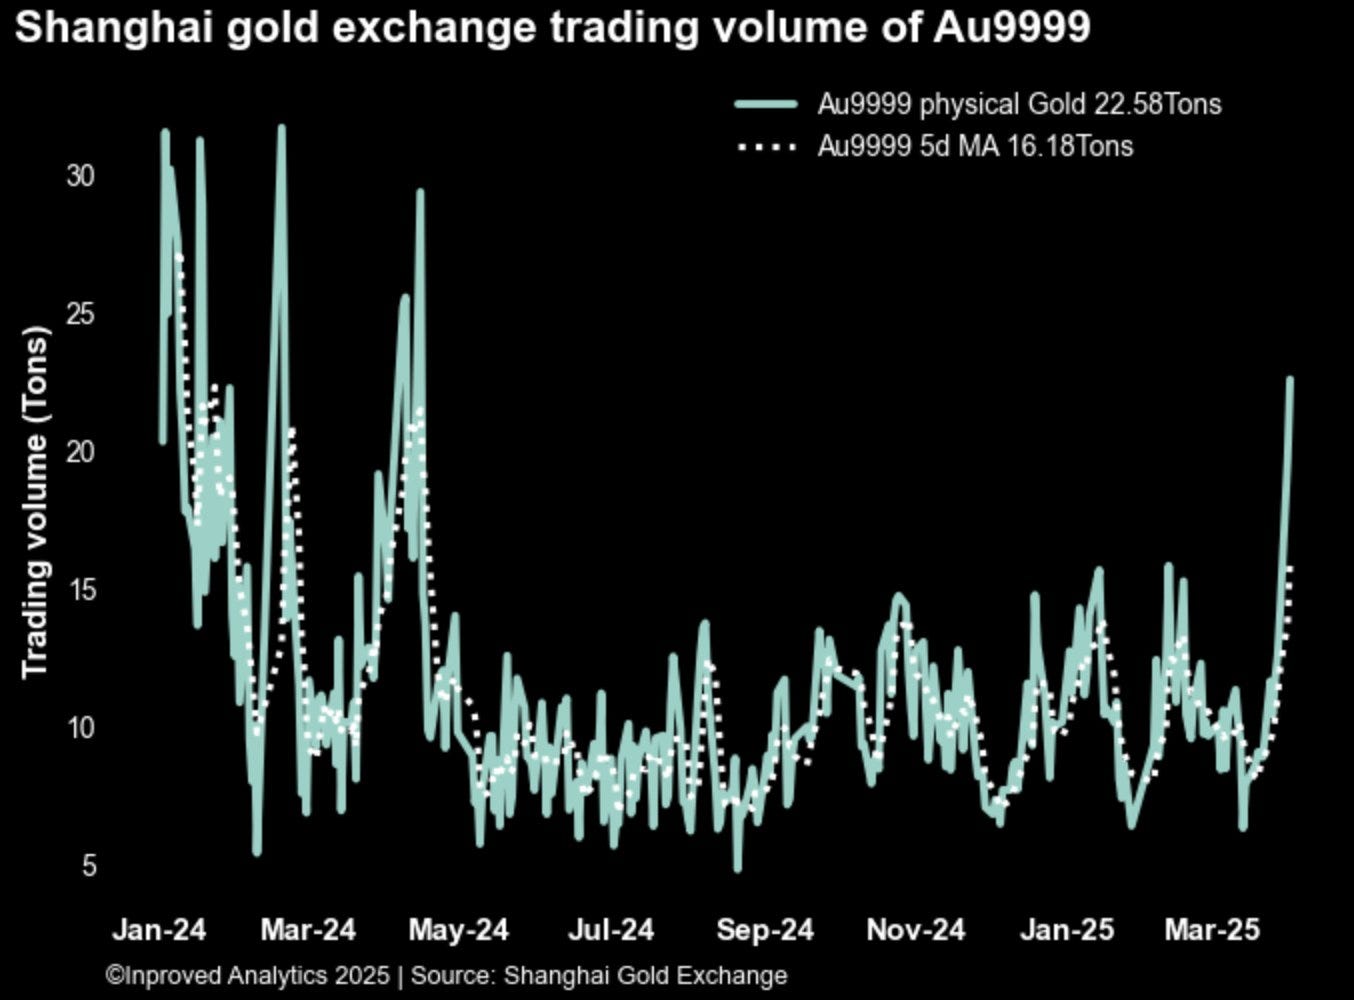
The recent frenzy of physical gold purchases in the United States seems to have rekindled interest in China. For the second consecutive session, trading volumes in the AU9999 contract - the benchmark for physical gold on the Shanghai Gold Exchange (SGE) - were particularly high.
The March 31 session recorded 22.6 tons of gold traded, marking the highest level since April 2024. This renewed activity confirms a marked return of appetite for physical gold on the Chinese market.
Gold continues to rise against an economic backdrop that is increasingly resembling a stagflationary scenario.
This week's graph illustrates this reality at a glance in the United States: economic growth is slowing down, while inflation remains high. It is precisely this type of environment - weak economic momentum and rising prices - in which gold has historically acted as a safe haven for investors.
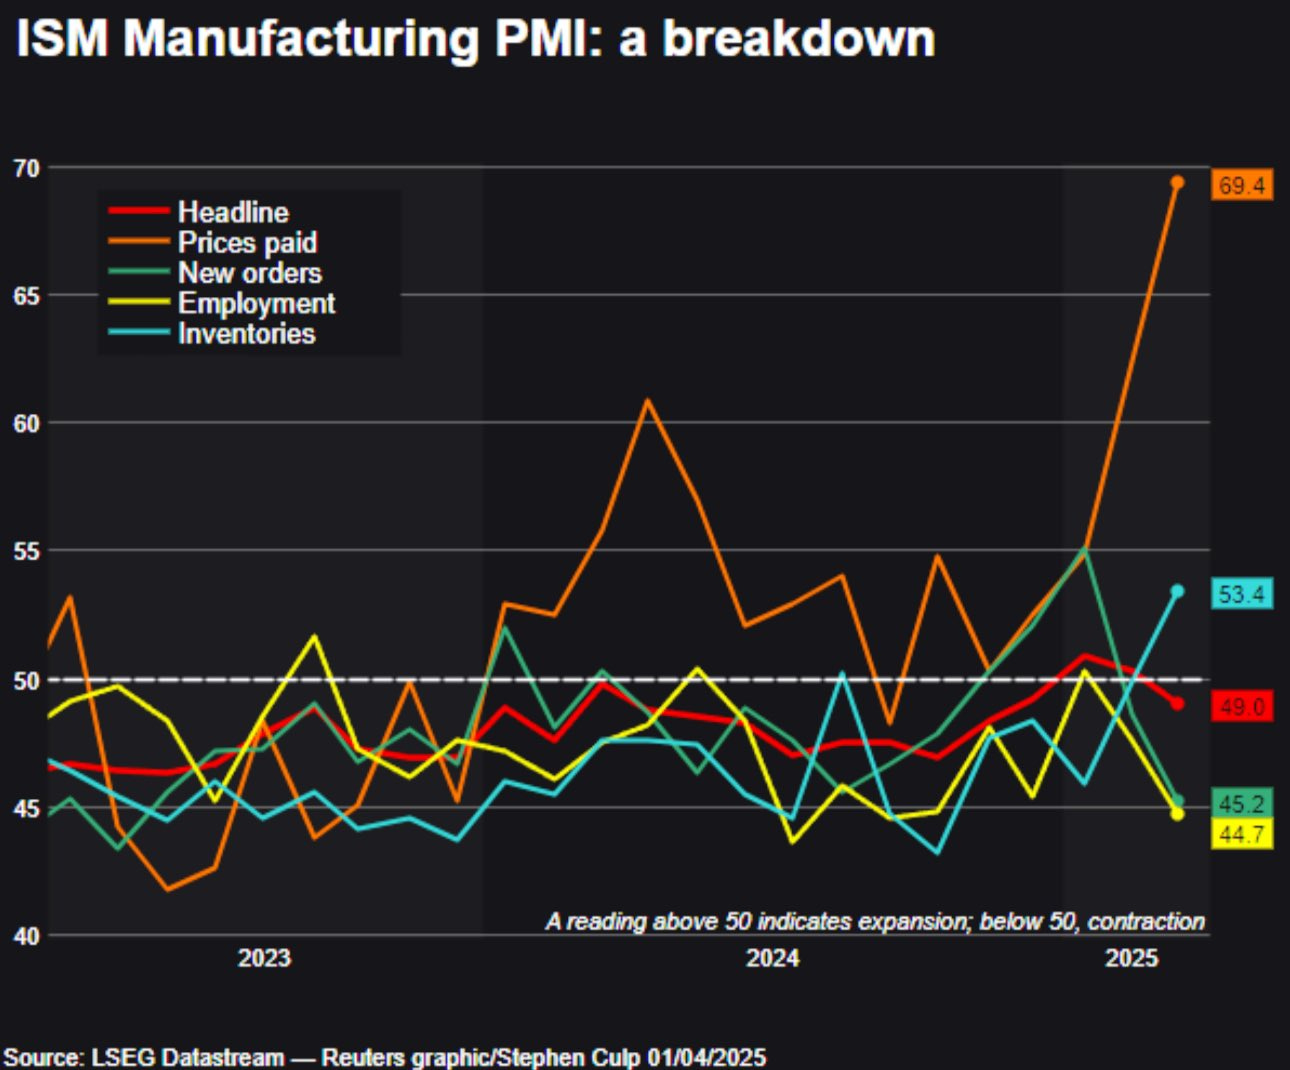
Prices paid by producers are on the rise again, even as signs of a slowdown are mounting: deterioration in the job market, a drop in new orders and rising inventories.
What is making the markets particularly febrile is the outlook for consumption between now and the end of the year. In an economy largely underpinned by household demand, the slightest weakness in consumption has immediate repercussions on growth expectations - and, consequently, on corporate valuations.
These measures, which are likely to fuel a new wave of inflation, heighten concerns about a weakening consumption, especially as household confidence indicators are already trending downwards.
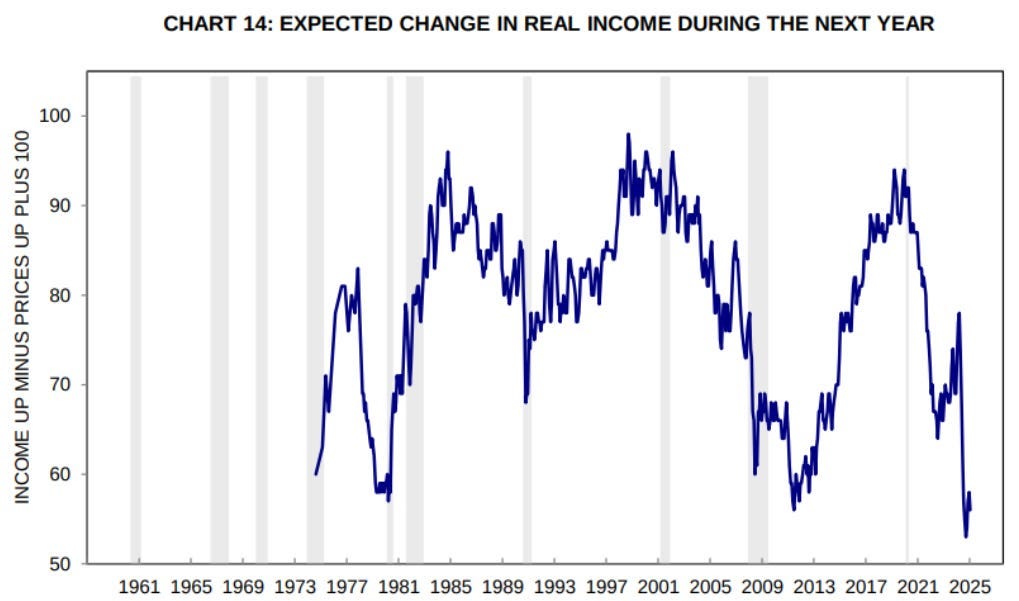
Indicators show that households have a historically low level of confidence regarding their medium-term income trends. While this perception does not necessarily reflect the objective reality of the economy, it does have concrete consequences: it directly influences consumption and savings decisions.
When households anticipate stagnating or even falling incomes, they tend to adopt a more cautious attitude. This translates into a reduction in discretionary spending, a postponement of major purchases, or an increase in precautionary savings. This phenomenon can occur even in the absence of any immediate deterioration in the labor market or real incomes.
In an economy like that of the USA, where household consumption accounts for around 70% of gross domestic product, this type of behavioral change can considerably slow economic growth. The risk is then of falling into a vicious circle: falling demand affects the outlook for businesses, which may in turn curb investment or reduce hiring, thus fuelling household pessimism.
In short, weak consumer confidence is not just a psychological indicator. It can have concrete effects on activity, especially in a context already marked by high interest rates and limited visibility on macroeconomic trends.
Added to this is a major trade risk: on April 2, 2025, Donald Trump announced a series of tariffs, including a 20% tax on products from the European Union, as well as surcharges targeting several Asian countries. China is particularly targeted, with increases of up to 54% on certain electronic equipment and industrial components. Vietnam faces surcharges of up to 46%, particularly on textiles, while Indonesia is hit by duties of up to 32% on its clothing and furniture exports.
Another major factor weighing on US consumer sentiment is the marked underperformance of major technology stocks since the start of 2025. These stocks, widely present in household portfolios via retirement plans (such as the 401(k)) or consumer ETFs (notably those indexed to the Nasdaq), have historically played a central role in what is known as the “wealth effect”. But this dynamic is being reversed: new trade tensions, notably the new tariffs, are increasing the pressure on equity markets. Small caps, already weakened, corrected sharply - and even the technology giants, the famous “Magnificent 7”, were not spared. The decline is self-reinforcing, reducing households' sense of wealth and further fuelling their pessimism about the future.
When these stocks rise sharply, as was the case between 2020 and early 2023, households feel wealthier - even if they haven't yet realized it - which encourages more dynamic consumption. On the other hand, when these values correct, this feeling is eroded, and precautionary behavior resurfaces.
However, since the start of 2025, the Nasdaq has lost over 12%, with even sharper corrections for some of the technology sector's iconic figures.
Stocks such as Nvidia, Meta and Tesla have fallen by 30-40% since peaking at the end of 2024.
This drop in valuation comes after a year of euphoria around artificial intelligence in 2024, and a massive repositioning of portfolios towards US megacaps.
The mechanism is therefore twofold: on the one hand, households see the value of their financial assets plummet, prompting them to save more to compensate for this perceived loss. On the other hand, this brutal downturn undermines confidence in the strength of the stock market engine and, by extension, in the future health of the economy. This is particularly true in the United States, where the stock market culture is deeply rooted in the middle classes.
Why won't a growth stock go up, even if the company's sales and free cash flow (FCF) are up?
Because these figures can be misleading.
A business can grow, but if every euro invested yields less than it costs, it will lose money in the long run. It's a bit like opening a second restaurant when the first isn't profitable: the bigger you get, the bigger the hole you dig.
On the other hand, many technology companies pay some of their employees in stock rather than cash, a practice known as “stock-based compensation”. Although this is not reflected in daily expenses on financial reports, it does dilute the sgareholders, as more shares are put into circulation. In some cases, this compensation can exceed the money actually generated by the business. So, even if the company shows a nice “free cash flow”, in reality there's almost nothing left once all the real costs have been taken into account.
So it's not enough to look at revenue growth and FCF on paper. What really matters is whether the company is creating value without compromising profitability or excessively diluting shareholders. Otherwise, sooner or later, the market will take notice... and the share price will suffer. This is precisely what is currently happening with certain growth stocks.
It is against this backdrop that US GDP growth forecasts for the first quarter have been massively revised downwards.
Even excluding the temporary impact of gold imports, which artificially inflated some trade statistics, the Atlanta Fed's forecasting model now estimates that US real GDP could contract by 1.7% in the first quarter.
This marks a sharp turnaround compared with the initial forecasts, which until recently were anticipating moderate growth. This type of revision reflects a clear slowdown in the US economy, against a backdrop of persistently high interest rates, residual inflation and tensions on the labor market.
If this figure is confirmed, the US economy would tip into negative growth territory, reinforcing the stagflation worries raised in recent weeks.
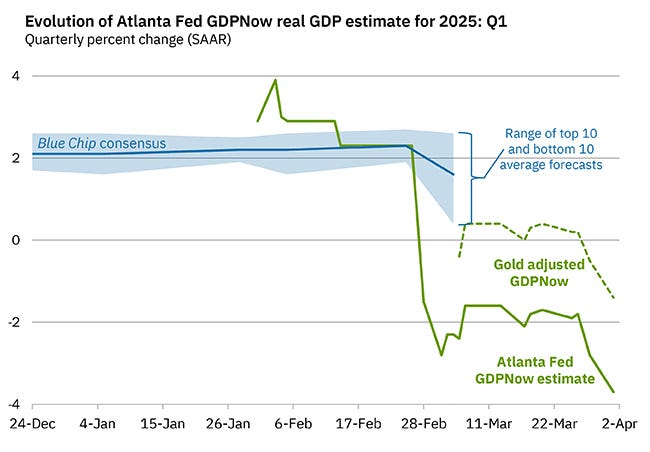
With US GDP likely to fall, equity markets are correcting, while gold prices are rising. This movement illustrates a capital rotation typical of stagflationary phases: faced with sluggish growth and persistent inflation, investors abandon risky assets in favor of safe havens. If macroeconomic indicators continue to deteriorate, this trend could become even more pronounced in the months ahead.
Reproduction, in whole or in part, is authorized as long as it includes all the text hyperlinks and a link back to the original source.
The information contained in this article is for information purposes only and does not constitute investment advice or a recommendation to buy or sell.


