In the 1960s, Milton Friedman wrote: “Inflation is just like alcoholism. In both cases, when you start drinking or when you start printing too much money, the good effects come first. The bad effects only come later.” (Inflation and Monetary System, 1969).
Central banks are now facing inflation as high as in the 1970s. The detailed study of economic statistics shows indisputably the important role of money creation in the current inflation. The fact is not only that the political players have forgotten most of the elementary monetarist rules that used to underpin the European economic order. The limits in terms of debts, deficits and inflation have gradually been crossed. Let's decipher the role of money creation in the current inflation that benefits safe havens.
Price index and money supply...
Beyond ideological preconceptions, it is possible to measure the mathematical relationship between prices and the money supply. The money supply is primarily a phenomenon specific to the financial system. Inflation, on the other hand, is a phenomenon that manifests itself in the real economy and has a direct impact on the standard of living of the population, either upwards or downwards. The idea that an increase in the quantity of money in circulation has no impact on prices is historically and mathematically wrong. As we will detail exclusively here, it is important to understand the mechanics that link money creation and inflation over time.

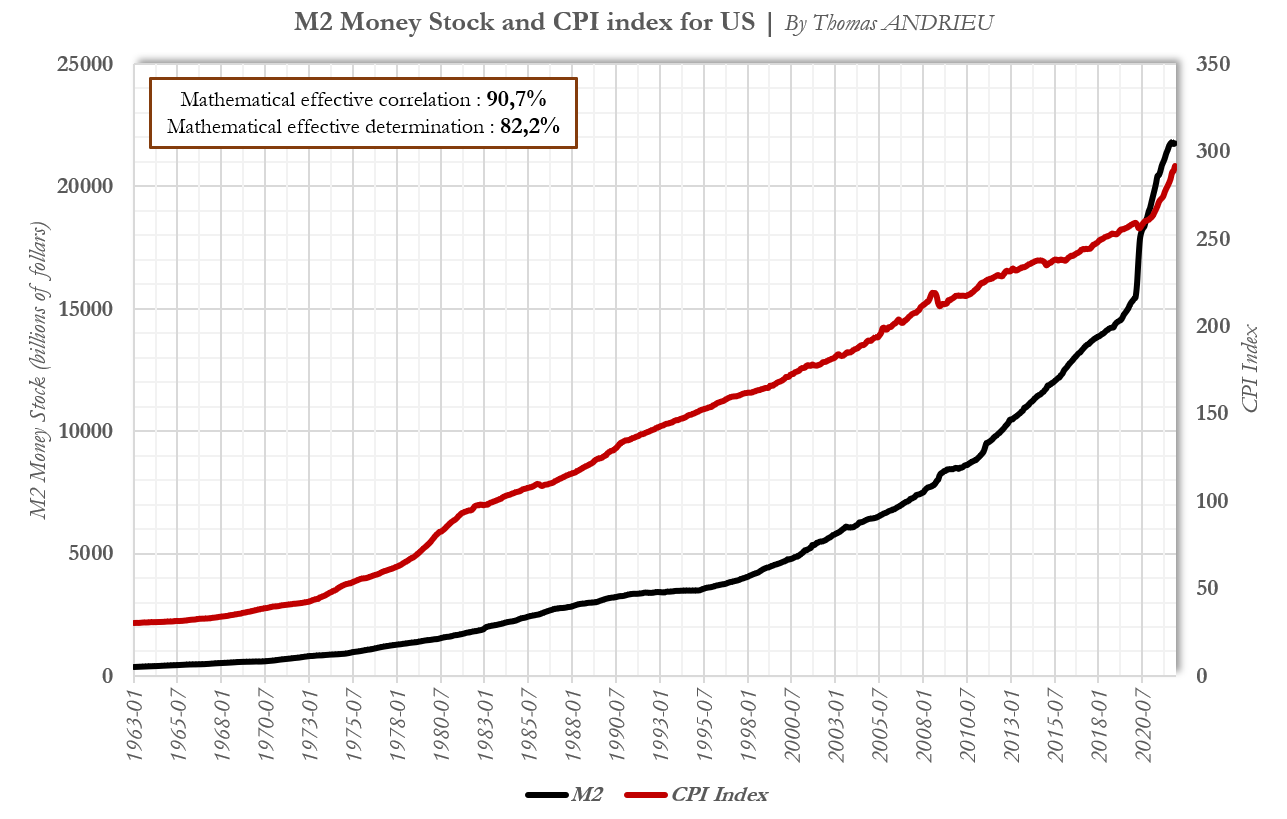
The graph above compares the consumer price index (CPI) and the money supply (M2) for the US. The correlation between the two variables, between 1963 and mid-2022, is nearly 91% (versus 82% mathematical determination). This means that a very large part of inflation is indeed the theoretical result of the increase in the quantity of money in circulation. It is also worth noting the gradual increase in the rate of money creation since August 1971, when the gold standard for the dollar ended at a rate of $35 per ounce. However, this money/inflation relationship does not stop there and responds to very precise mechanisms.
How long does it take for money creation to generate inflation?
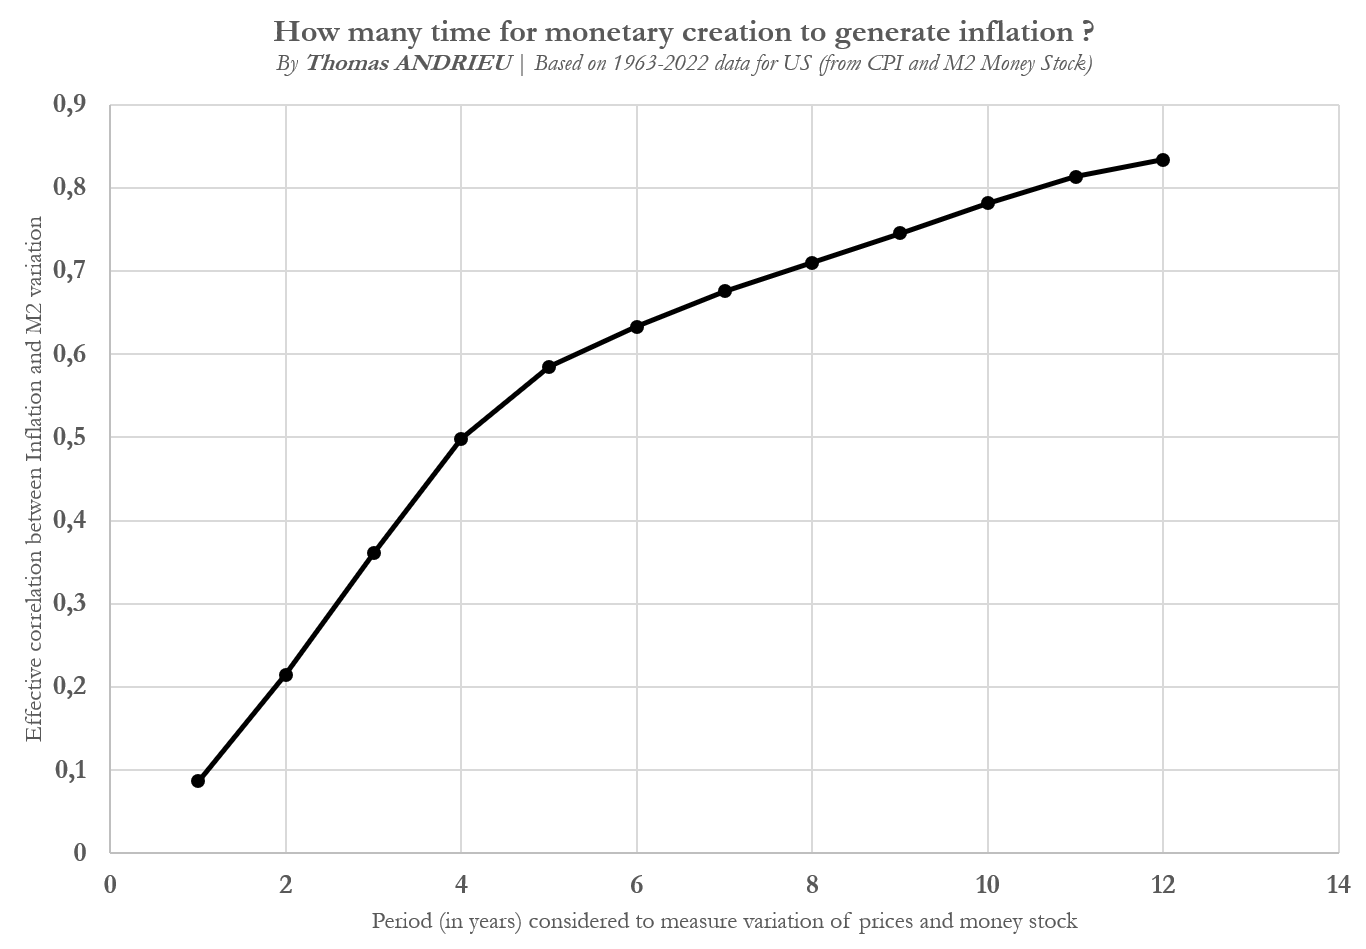
An even more interesting study concerns the temporal mechanics of this monetary phenomenon. To study the rate at which money creation is transformed into inflation in the economy, we have produced the graph below. This study takes into account data for the United States from 1963 to 2022, and therefore has sufficient hindsight to assume its reliability. The conclusion of this study is firstly that money creation has inflationary effects in the long run.
To measure over which time horizons the money/inflation relationship is strongest, we measured several correlations. On the x-axis, we plotted the period considered for measuring the change in the money supply and the price level (ranging from the one-year change to the twelve-year change). On the y-axis, we have plotted the correlation measured from the annual change in the money supply and annual inflation, to the correlation from the twelve-year change in the money supply and twelve-year inflation.

Thus, there is almost no link between inflation and money creation in the short term. In other words, the creation of 10 trillion today will not significantly increase prices in one year. Conversely, the relationship between money creation and inflation becomes absolutely significant in the long run. Moreover, we notice that the "full effects" of money creation on price increases are reached almost ten years after the increase in the quantity of money in circulation.
The diffusion time from money creation to inflation in the real economy thus respects about three phases:
-
First, a first phase of "hidden effects". The diffusion of the quantity of money at the price level is not significant for two years.
-
Second, a second phase of "concrete effects". During this phase, the diffusion of inflation to the real economy is strongest. It is necessary to wait five to six years before the majority of the inflation induced by monetary creation is seen in the real economy.
-
Finally, a last phase of "full effects". After a decade, money creation has spread widely and prices are rising only very moderately in the economy.
This observation is not neutral, since it confirms the hypothesis of a ten-year inflationary cycle. The fact that the diffusion of inflation in the economy has a "logarithmic" curve demonstrates the presence of a cycle. Money creation leads to an increase in the price of assets, which, once sold, are bought in favor of other assets, and so on... At each stage, a part of the result of the sale is hoarded or destroyed by economic agents, which prevents the price increase from spreading exponentially. We find this idea of the multiplier described by the "logarithm" curve. It is only when money creation is sustained and continuous, that the cycle cannot be completed, and that hyperinflation appears.
Inflation: A monetary policy mistake?
Once we have analyzed the ins and outs of inflation, we can legitimately ask about the role of economic institutions. There will inevitably come a day when historians of contemporary economics will ask themselves the question of the inherent sources of the inflation of the "2020s". In fact, it is known that inflation in the eurozone induced since and by the war and shortages of raw materials represents a minor part of current inflation (probably between 15% and 20% of inflation at most)1.
Moreover, the current inflation spike is the concordance of several phenomena. The main cause was first the forgetting of most monetary constraints, starting with the end of the gold standard in the United States in 1971. Subsequently, most of the monetary criteria introduced in the 1990s in the eurozone were also forgotten. Deficit criteria were first neglected, followed by debt criteria, and now the contagion is affecting inflation criteria and the independence of monetary authorities.
The fact that central balance sheets gradually became more expansive from 2008 and 2012 has profoundly altered monetary balances. The absence of inflation despite the increase in central balance sheets biased the monetary policies that followed. The monetary authorities neglected almost everything about the temporality of the economic consequences of these policies. The main reason for this bias is the observation that the money supply translates into inflation in the long term, not in the short or medium term. Thus, current inflation comes from a variety of sources:
-
The first source of money is probably the money creation observed between 2010 and 2020. As we have seen, money creation takes about five years to translate into a maximum acceleration in prices.
-
The second monetary source is the second acceleration in the pace of money creation starting in 2020. This unprecedented money creation shock did indeed show its first effects within two years, as our statistical model suggests.
- The final explanation is the business cycle and the shortage of energy and raw materials. From 2018 onwards, economic dynamism slowed and prevented the existence of strong inflationary pressures, which were contained until the next recovery in 2021. The absence of strong underinvestment in raw materials precipitated, in addition to the breakdown of just-in-time and production in 2020, a shortage inflation.
Gold: monetary insurance?
As is often the case in history, periods of high inflation are often linked to problems with public debt. The presence of a structural dilemma in the eurozone thus reinforces the opposition between the stability of the euro and the stability of public debts [see our previous publication]. Moreover, it is important to remember that the money supply does not only have an impact on inflation. In fact, there is also an almost absolute determination between the money supply and public debt, or between the money supply and the financial markets.
The relationship between these variables is essentially one of time scales. The money supply has a short-term impact on stock prices. Conversely, the money supply has a long-term impact on prices. Thus, this observation explains why stock markets correct sharply when the money supply contracts in the short term despite a high level of inflation. This pattern is often seen during periods of stagflation.
In this context, gold has two major qualities. The main "political" quality of gold was the monetary rigor it imposed. Many have tried at their peril to break away from it in history. It was not until the 1970s that the end of "hard" rigor was put into effect, by replacing gold with economic rules. These rules only delayed the process. Today, we find ourselves in a succession of short-term crises compensated by economic policies whose effects will accentuate the long-term instability of the economy. Nevertheless, the course for the economic authorities must now be to maintain constant targets for monetary and fiscal rigor. Otherwise, many economies will fall under their own weight in the coming decades.

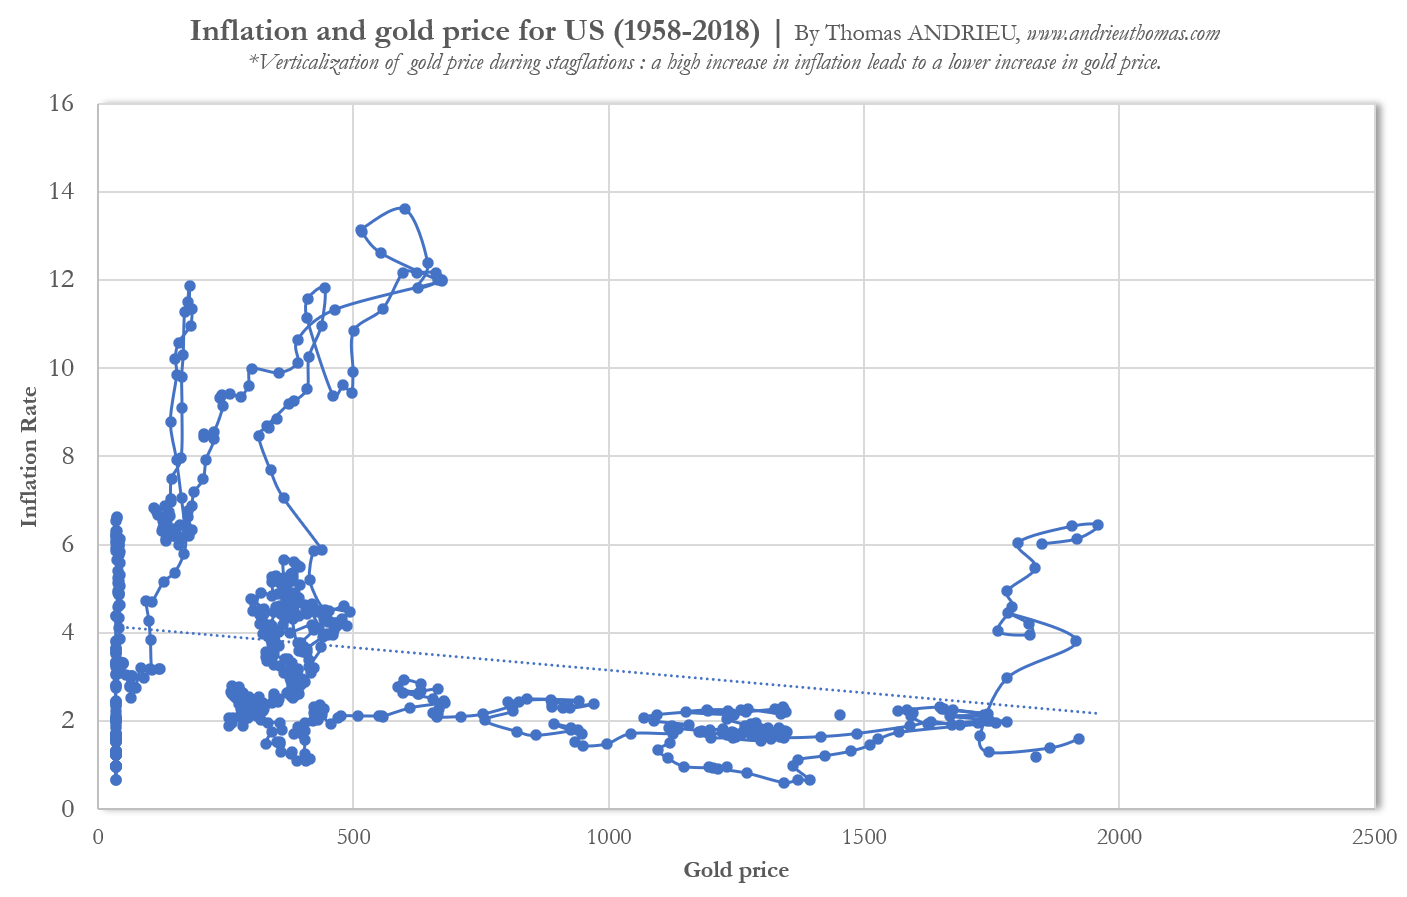
Thus, the other quality of gold is its "safe haven" character during stagflation. Gold benefits from rising price levels rather than rising inflation. In other words, gold benefits from long-term inflation rather than from inflationary shocks per se. The chart above compares the price of an ounce of gold with the rate of inflation between 1958 and 2018. During stagflationary periods, there is a "verticalization of the gold price". In other words, rising inflation does not necessarily imply accelerating gold performance. Gold is on a slow growth path that is often not accelerated by inflation. However, the presence of long-term structural inflation remains a very favorable indicator for the gold price over time.
In conclusion
Finally, we have seen that there is an effective link between the money supply and the general rise in the price level. However, an in-depth study of the money/inflation relationship shows the importance of the time parameter. In effect, there is no relationship between the money supply and inflation in the short run. Conversely, the financial markets react in the short term to monetary phenomena. Moreover, money creation turns out to be a progressive source of inflation. The empirical study of the economic data available to us shows that it can take more than ten years for money creation to have its full effect on prices. It is now easier to understand why economic policies are not necessarily relevant because they omit all or most of the temporality of economic mechanisms. An economy of short-term "shocks" (oscillating between periods of strong monetary or fiscal creation and destruction) has nothing in common with a stable and sustainable economy.
Moreover, the study of the structure of inflation tends to confirm the hypothesis that structural inflation will most certainly be maintained during this decade. In the short term, inflation is therefore not beneficial for the financial markets because it implies a reduction in available liquidity. In the long term, the structural rise in the price level generally benefits financial assets, including mainly safe havens.
1 The current inflation rate in February 2022 was 5.8%, including 2.7 points of underlying inflation (45%). In May, these rates were 8.1% annual inflation, including 3.8 points of underlying inflation (60%). In technical technical terms, we obtain: [(inflation May– inflation February)-(underlying inflation May - underlying inflation February)]/(current inflation)=[(8.1-5.8)-(3.8-2.7)/(8.1)=15%]
Reproduction, in whole or in part, is authorized as long as it includes all the text hyperlinks and a link back to the original source.
The information contained in this article is for information purposes only and does not constitute investment advice or a recommendation to buy or sell.


