A year ago, I wrote that physical gold had become a more reliable option than Treasury Bills.
Central banks' buying frenzy has reinforced gold's status as a reserve asset. According to Bank of America, gold has now overtaken the euro to become the world's second largest reserve asset, after the US dollar, accounting for 16% of the reserve pool.
How did T-Bills manage to lose their historic status as a safe-haven asset in portfolios to such an extent?
The World Gold Council recently published an article explaining why, by 2024, gold is set to become the ultimate defensive asset, replacing bond assets.
The study's main chart, published on page 3, illustrates the risk contribution of the two asset classes, equities and bonds:
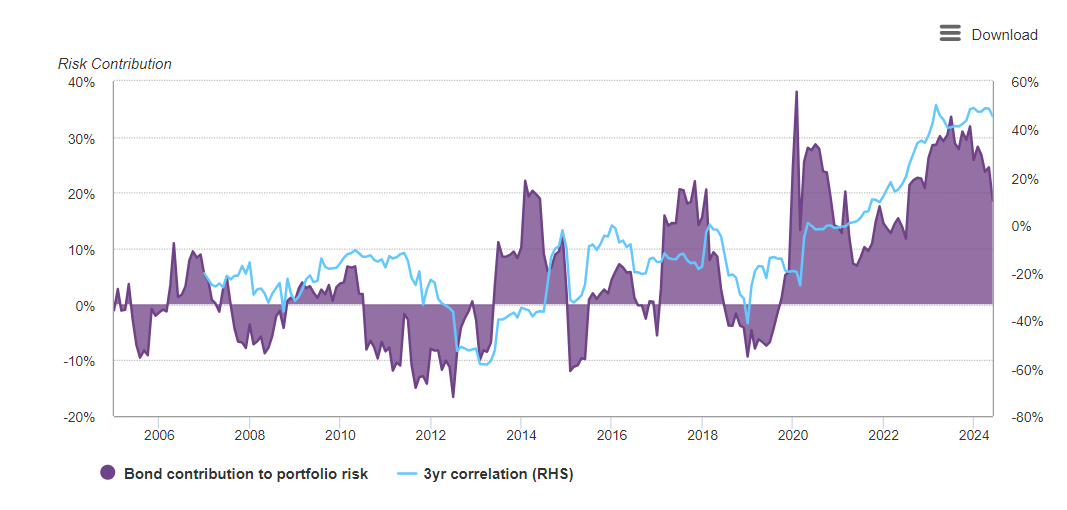
The purple part of the chart shows the contribution of bonds to total portfolio risk, expressed as a percentage. There has been a marked increase in this contribution over time, especially after 2014, with significant peaks around 2020 and 2023, reaching almost 40%. The contribution of bonds to risk has fluctuated significantly in recent years, with several periods of negative contribution (i.e., bonds reducing overall portfolio risk) prior to 2014.
In recent years, the overall trend has been upwards, indicating that bonds are becoming an increasingly important source of risk. Not only do they no longer protect portfolios, they also increase overall risk!
The blue line shows the three-year correlation between bonds and Swiss equities. This correlation, represented on the right-hand axis, oscillates between negative and positive values. When the correlation is negative, it means that bonds and equities are moving in opposite directions, which, in theory, should reduce overall portfolio risk.
In recent years, however, correlation has become positive. A positive correlation means that bonds and equities are moving in the same direction, thereby increasing overall portfolio risk.
A 60/40 portfolio no longer mitigates the risk of market exposure; on the contrary, it reinforces it.
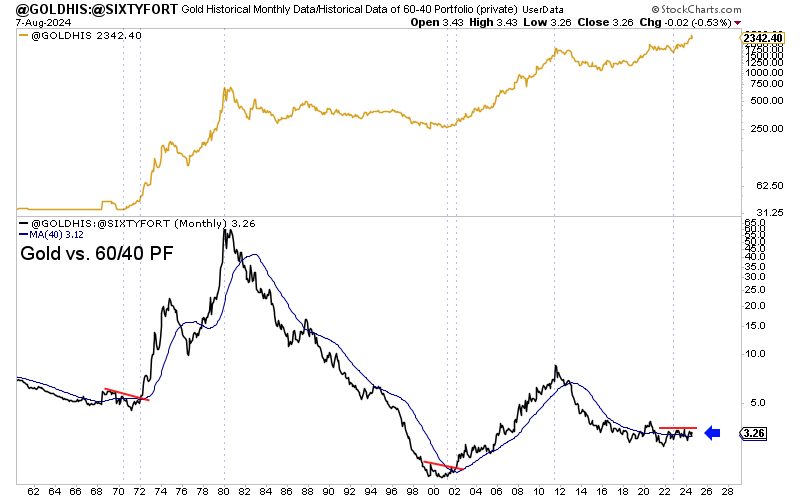
Gold is currently outperforming the 60/40 portfolio, at a time when investors are waking up to this reality. As I explained two weeks ago, gold is breaking through an important limit compared with the “classic” 60/40 portfolio:
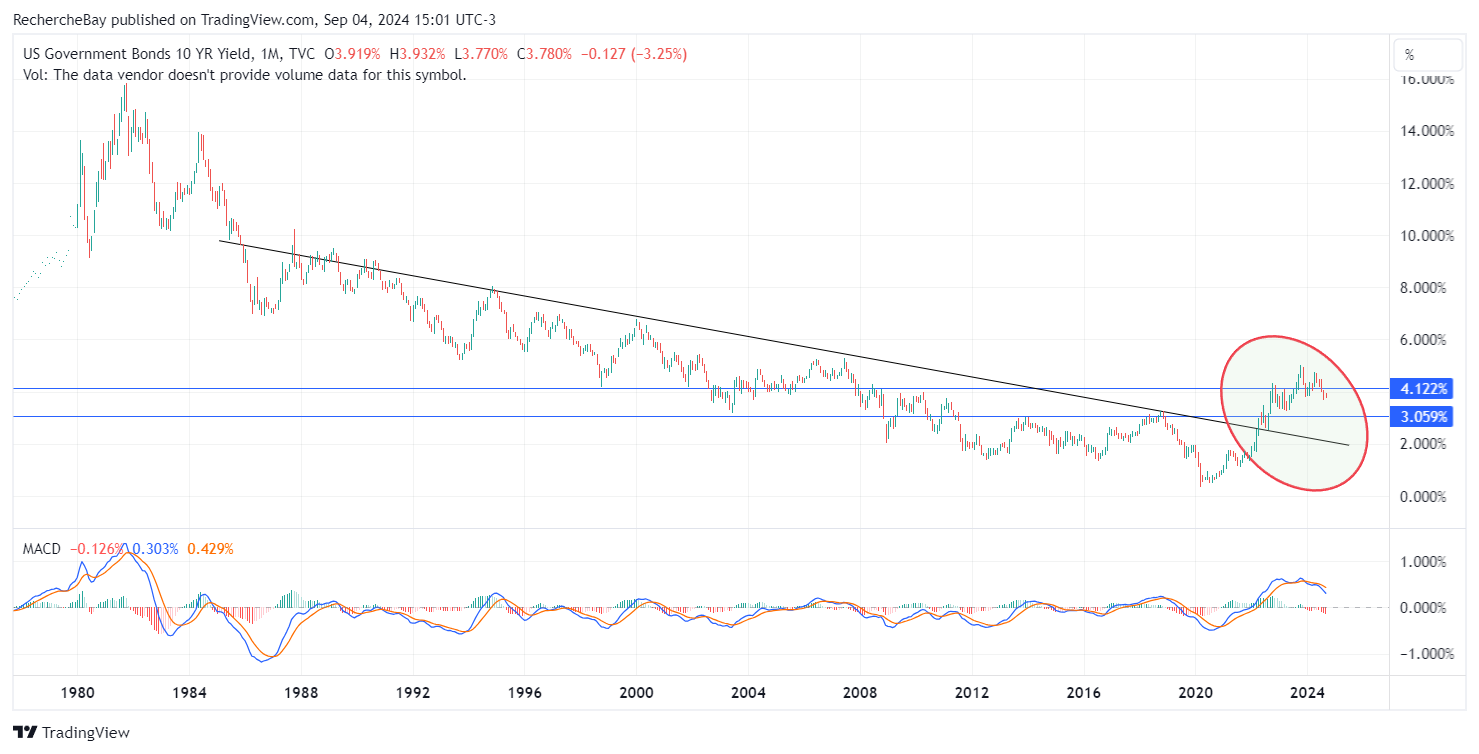
Disaffection with Treasuries can also be explained by the behavior of U.S. yields. In 2023, US 10-year bond yields broke with their downward trend:
TLT attempted a rebound in 2024 on high volume... but the rebound is still far too timid:
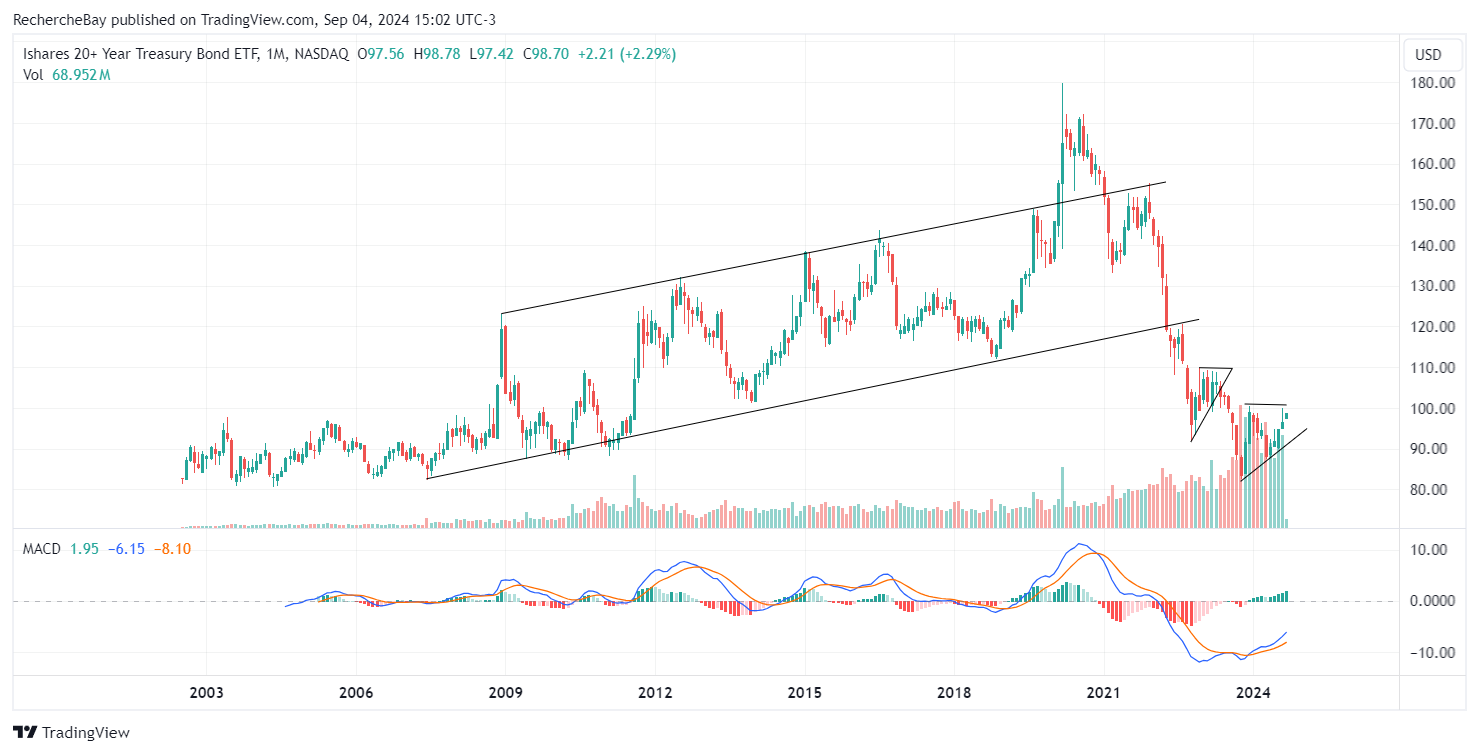
These sharp breaks in the long-term trends of the US Treasury bond market have changed the perception of these assets. Inflation has changed the face of the US bond market.
Doubts about America's ability to repay its debts in a non-devalued currency are growing as the country sinks deeper into stagflation (an inflationary recession). The Fed seems to be failing in its two mandates. Its battle against inflation is not won, and it is possible that the coming months will see the emergence of a second inflationary wave.
Recession also seems to be on the horizon.
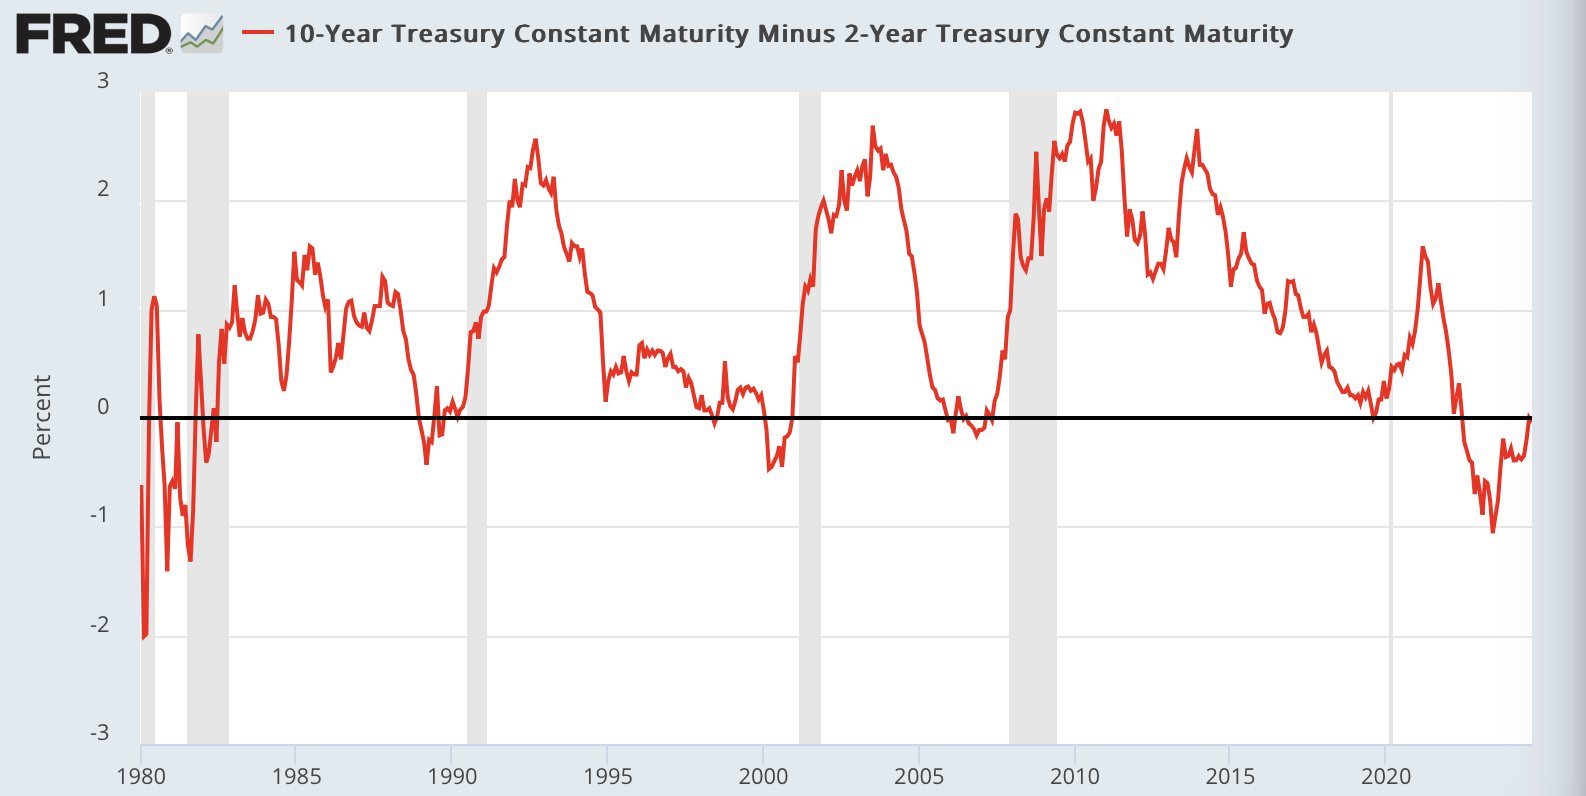
The inversion of the yield curve, an indicator of recession which we have discussed many times in these bulletins, signals an official entry into recession in the coming weeks:
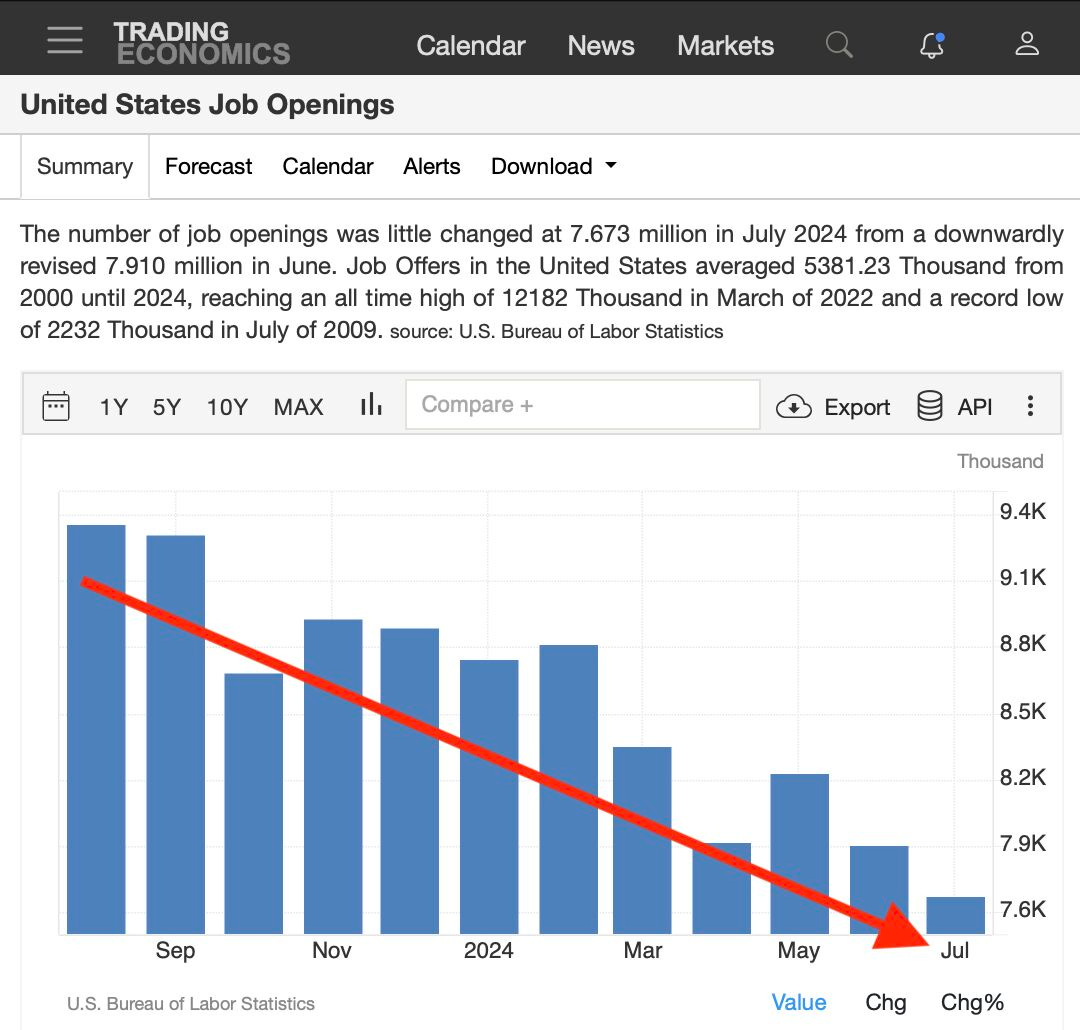
Job openings figures confirm a sharper-than-expected slowdown in the US economy:
But it was above all the latest ISM statistics that sent the markets into a frenzy this week.
The US manufacturing sector is now down for the fifth consecutive month, with the index falling to 47.2 points.
The ISM Manufacturing PMI disappointed forecasts, which were anticipating 47.5 points for last month.
New orders fell to 44.6 points from 47.4 in July, marking three consecutive months of contraction.
Over the past 22 months, manufacturing activity has declined 21 times, extending the second longest decline in history.
The most significant figure among these statistics is merchandise inventories:
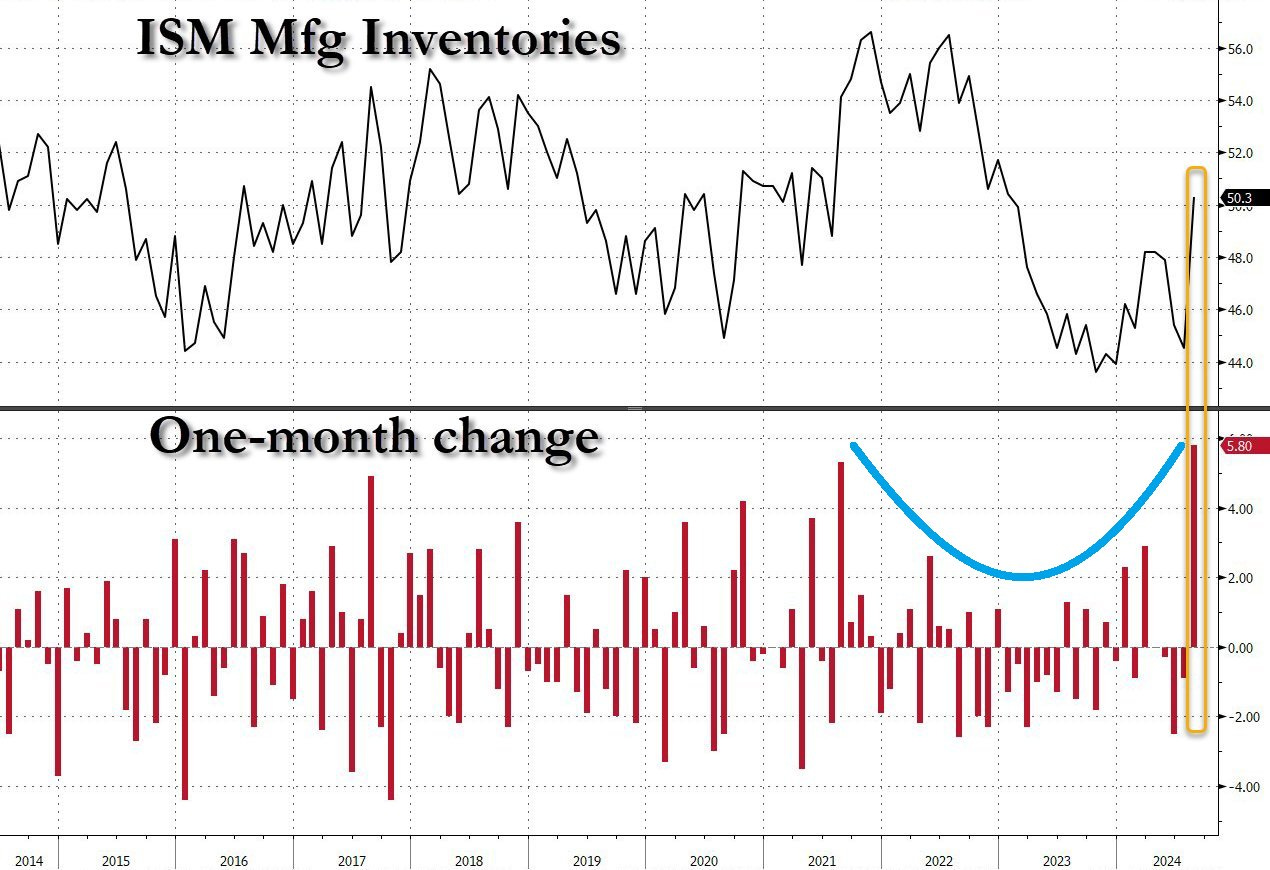
Inventories have exploded upwards, while consumption, the last engine of American growth, is beginning to stall abruptly.
What's particularly worrying is that this drop in activity is now accompanied by a resumption of price rises. While the increase in inventories should theoretically lead to a fall in prices, we are observing the opposite phenomenon.
The prices paid index climbed to 54 points from 52.9 in July, the eighth consecutive month of increases.
Demand has fallen, inventories have risen (due to unsold goods), and prices have climbed (due to labor and transportation costs). This is the very definition of stagflation!
It's the Fed's nightmare, but also that of the most vulnerable consumers, who are now struggling to pay off their debts:
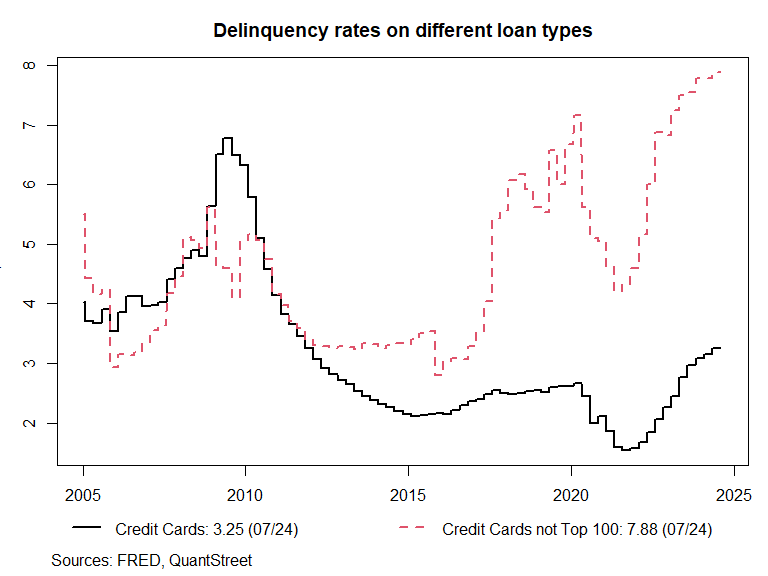
A new cycle of defaults has begun in the United States, against a backdrop of stagflation:
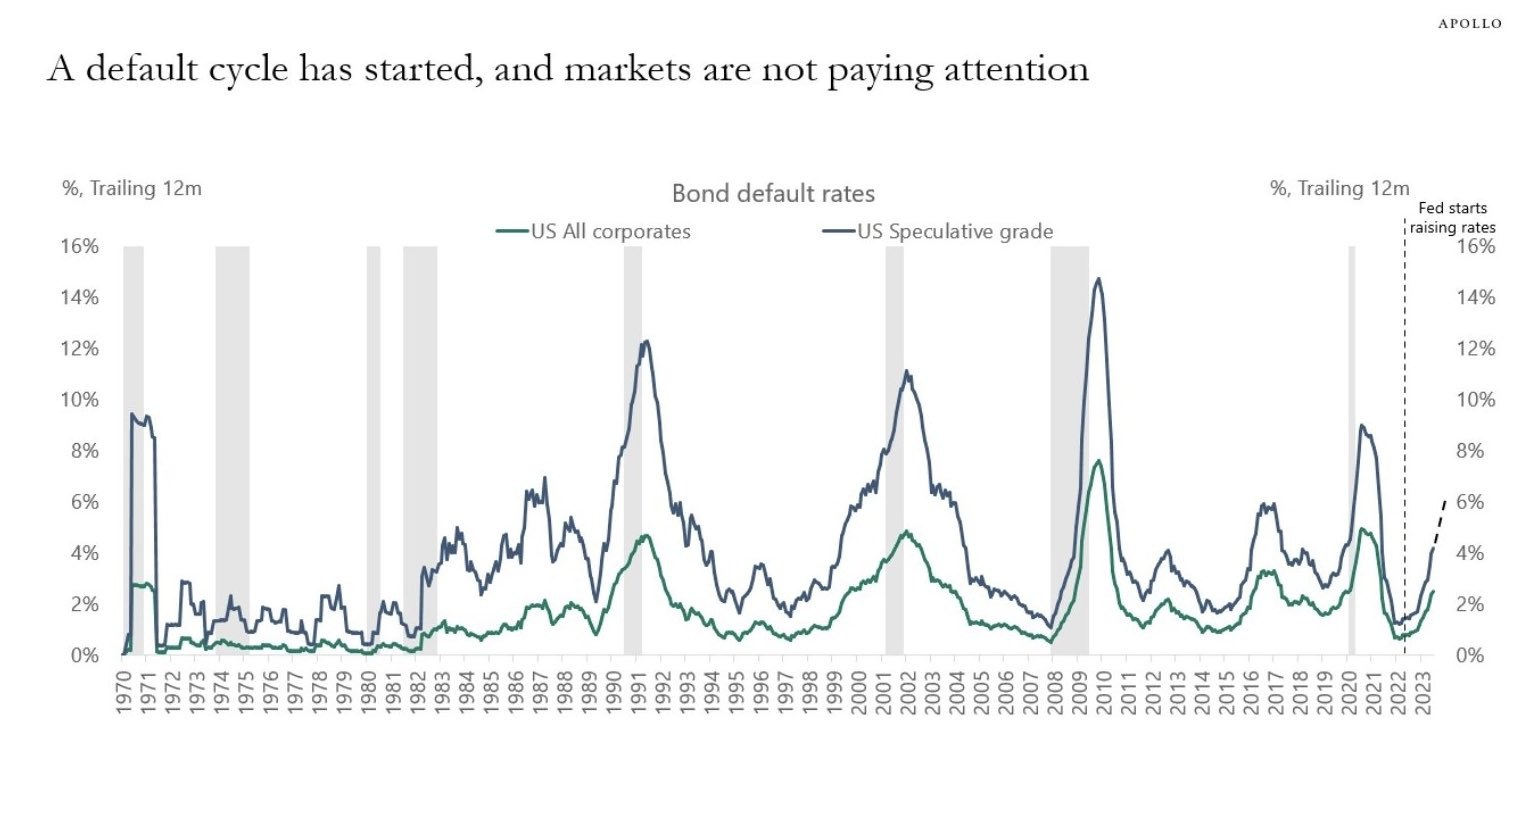
Against this stagflationary backdrop and the start of a new cycle of defaults in the United States, gold is logically attracting new buyers.
Reproduction, in whole or in part, is authorized as long as it includes all the text hyperlinks and a link back to the original source.
The information contained in this article is for information purposes only and does not constitute investment advice or a recommendation to buy or sell.


