This week’s graphic is about the U.S. Treasury bonds market:
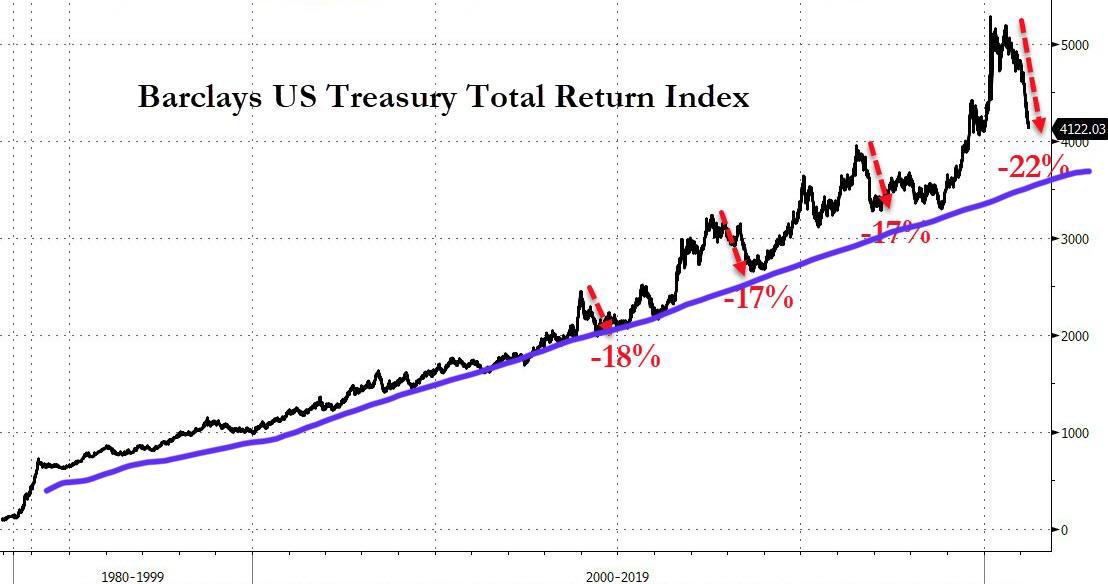
For the past 40 years, the U.S. Treasuries, or short-term Treasury bonds, have been in a regular bull market interspersed with a few transient corrections that give, to the holders of this instrument, the assurance of a safe and protected investment over the short term. For the past few weeks, this index has dropped by almost 25%, which, technically, puts the U.S. Treasuries in their first “Bear market” in 40 years. In other words, Treasury bonds that were, up to now, considered to be one of the most secure products, are now a risky asset. The above chart shows an ascending support, which is about to be attained; the real test of the confidence of these products will take place in the next few days, it is essential that this support must hold, because these bonds today serve as collateral for many financial products; a reassessment of their risk would cause a financial earthquake.
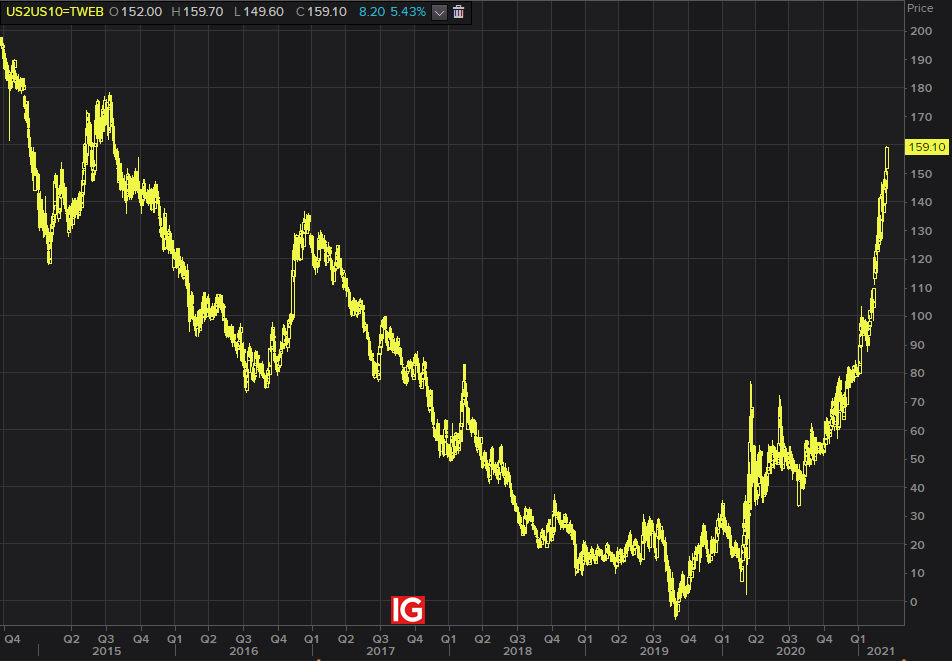
This movement on loan rates affects the entire bond market. The U.S. 10-year rates are soaring.
However, the effect is even more sensitive in short-term maturities. The rate difference between U.S. 2-year and 10-year bonds is increasing spectacularly:
This is a real problem for the central banks, because the States are finding themselves in front of a wall of short-term debts to be repaid in the upcoming months.
These rates are increasing because the growth is too low relative to all the debt that our economy is creating. There are no markets that are intense enough to absorb all this debt.
In order to defend this market, the Fed has no other way but to be a last-resort buyer of this debt in order to avoid a bond crash. This is what they are aggressively doing every time the “trend” described in our first chart is threatened.
The Fed must print more and more in order to buy-back all this new debt issued. And more and more investors will turn away from these products; they might even try to resell their Treasury bonds cheaply before monetary inflation decreases the value of their assets even more, at the end of the day leaving the Fed the sole buyer of the U.S. bonds market.
The Fed must continue printing, whereas the balance sheet of the assets buybacks is enough to make your head spin. Between August 2019 and December 2020, the Fed printed $3.6 trillion, and their balance sheet will continue to significantly increase in the next few months with the Biden's $1.4 trillion plan and the upcoming announced stimulus plans. In barely two years, the Fed will have printed the equivalent of one quarter of the U.S. GDP! The U.S. central bank is on a rate of increase of its balance sheet of $7 trillion over two years, which has never been seen before.
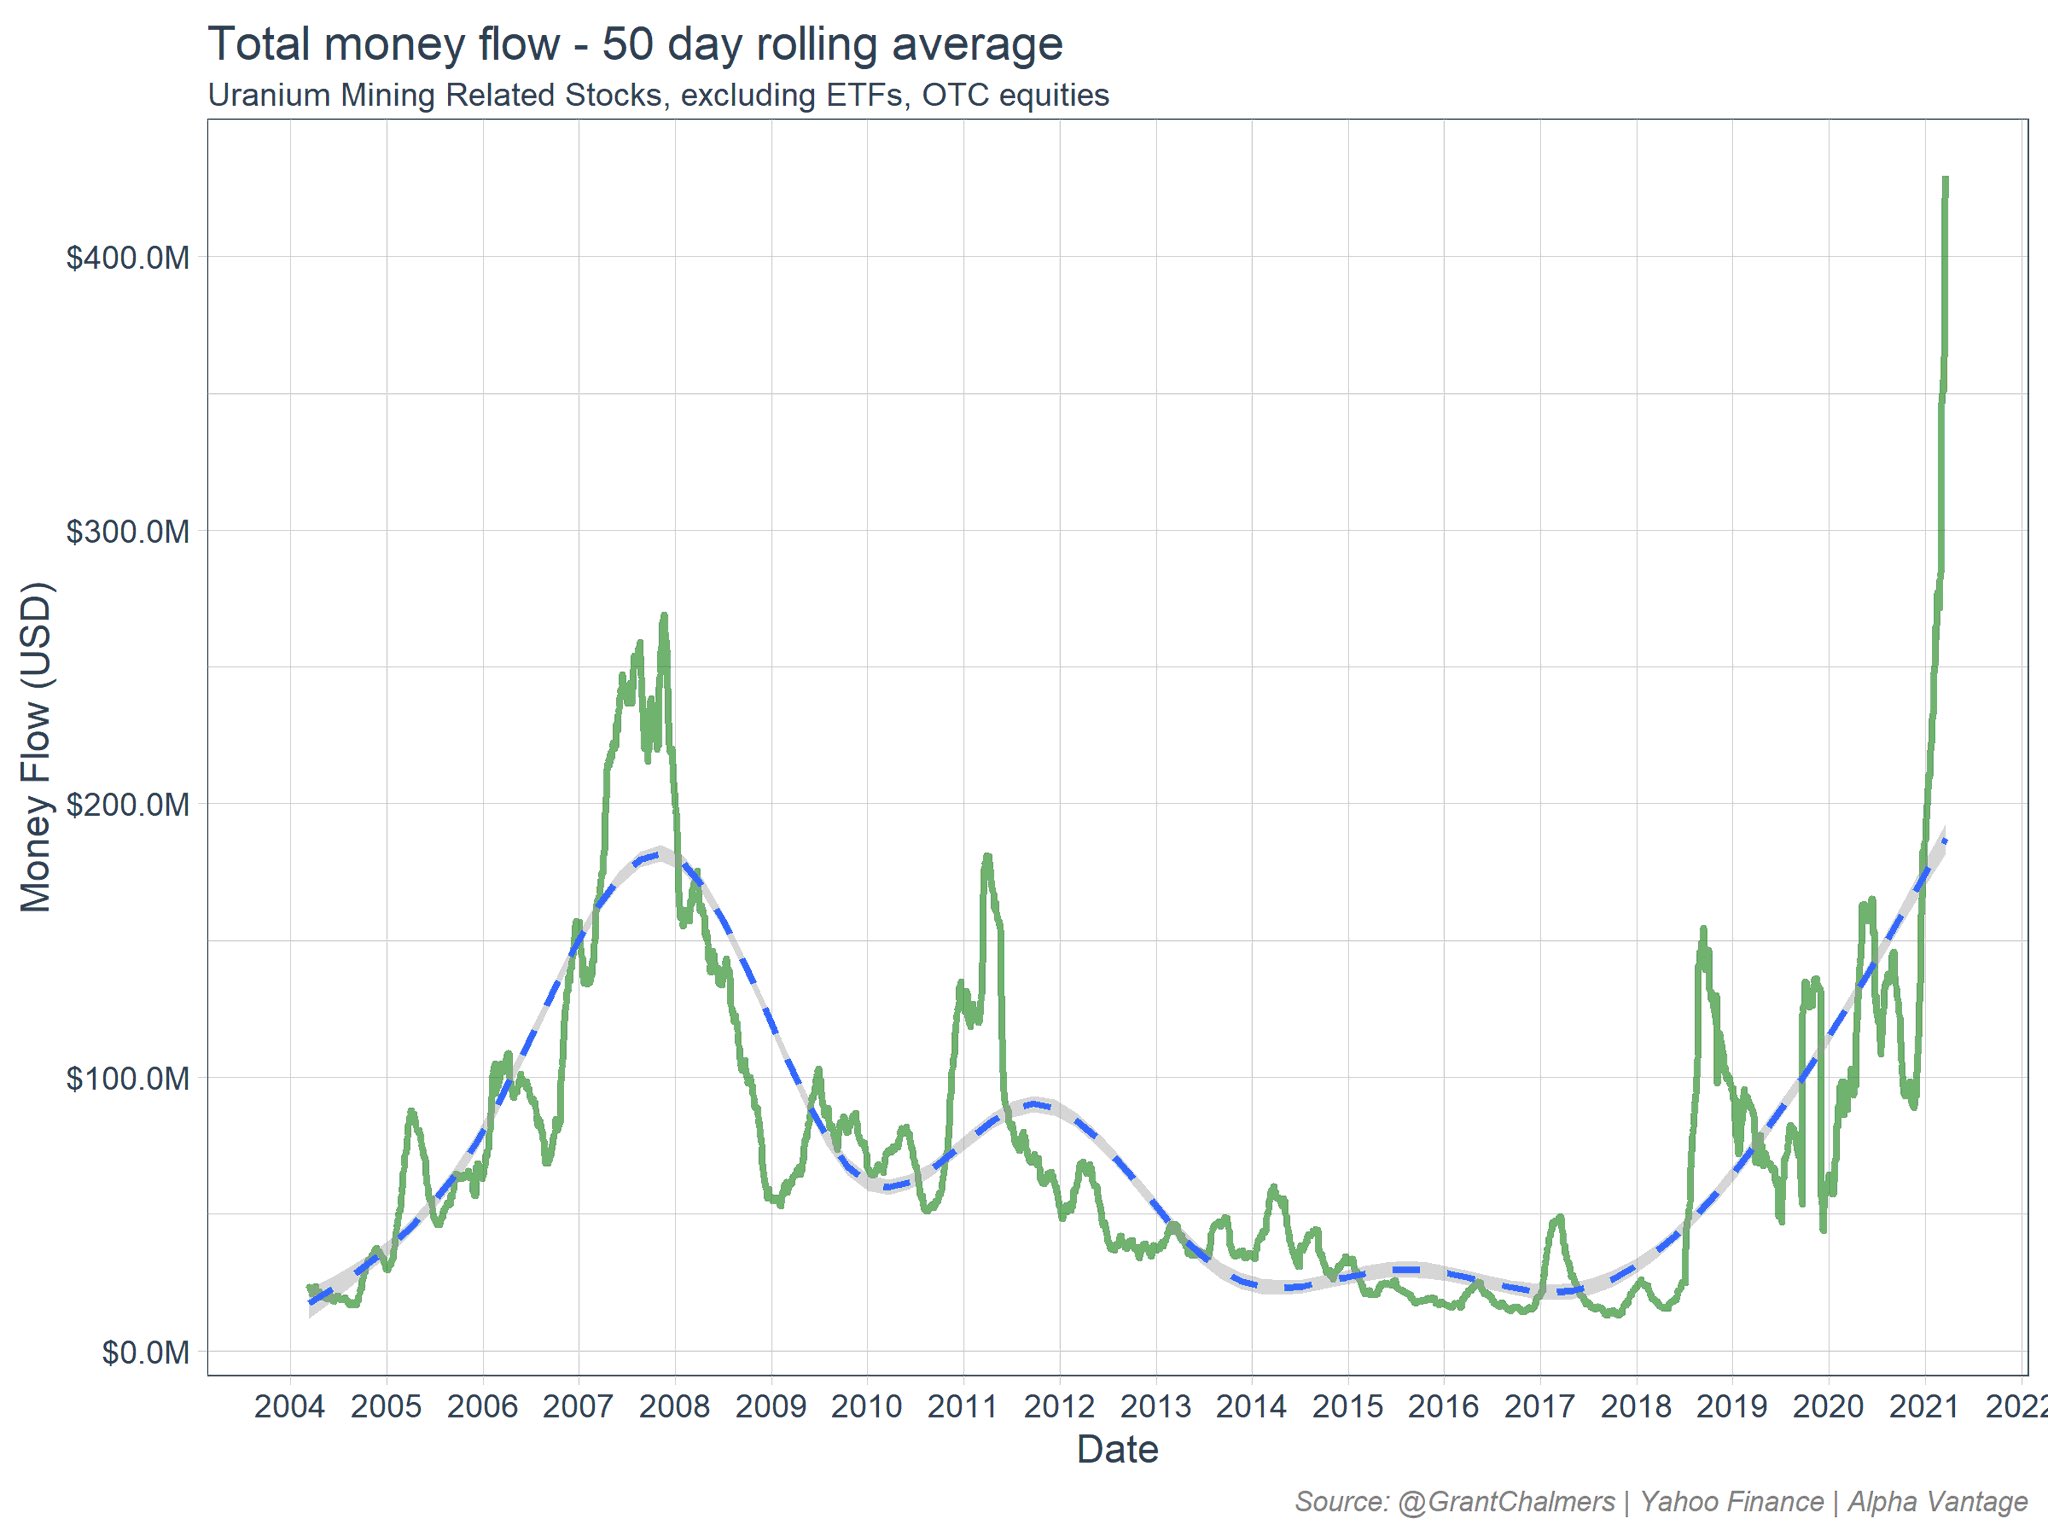
And this monetary madness is creating a real inflation that is propagating itself throughout the economy as we have seen in the past few months. The money created in this way participates in commodities inflation (we have seen it in these past weeks with metals, construction materials, agricultural products, etc.). This week, uranium is soaring:
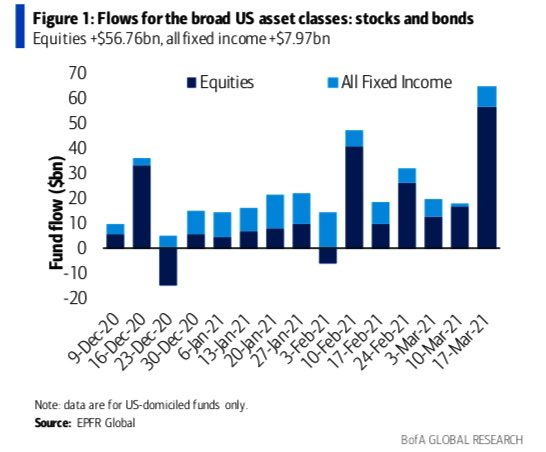
However, this monetary inflation is also feeding the stock market bubble, which has received a record influx of almost $60 billion just last week:
This inflation changes even more the new perspective the investors have, relative to the entire bond compartment.
What is the interest in holding bonds with a 1.5% yield when inflation is over 5%?
In a sign that the perception of this inflation is changing, this week an article in the Wall Street Journal entitled “A Fed With No Fear of Inflation Should Scare Investors”.
Regarding inflation, we have seen time and again, when the psychology changes, the perception of the market tipping rapidly, and it is difficult to turn back. A little like toothpaste when it’s squeezed out of the tube and it can’t be put back where it came from!
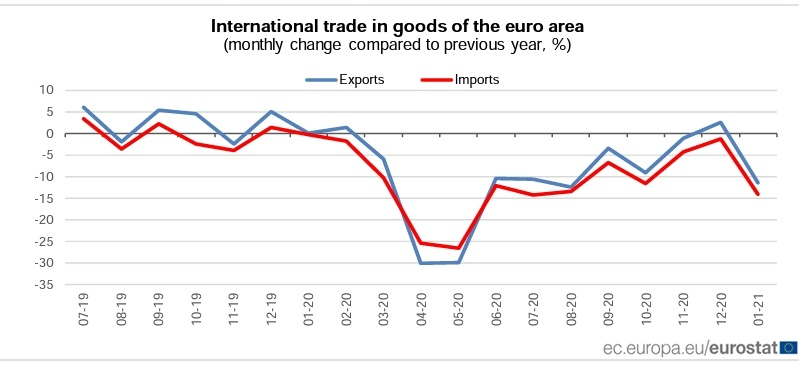
This rise in prices is in any case arriving at the worst possible time in Europe where a recession is occurring again with the third wave of the Covid crisis: lockdowns have been decided upon in France and in Germany starting this week. The exchanges started going down again as the export and import figures show:
However, it is Turkey that has been in the news since Monday: the decision to change the governor of the Turkish central bank has thrown the markets into a panic and propelled the 10-year Turkish bonds upwards with a spectacular takeoff of almost 3 points!
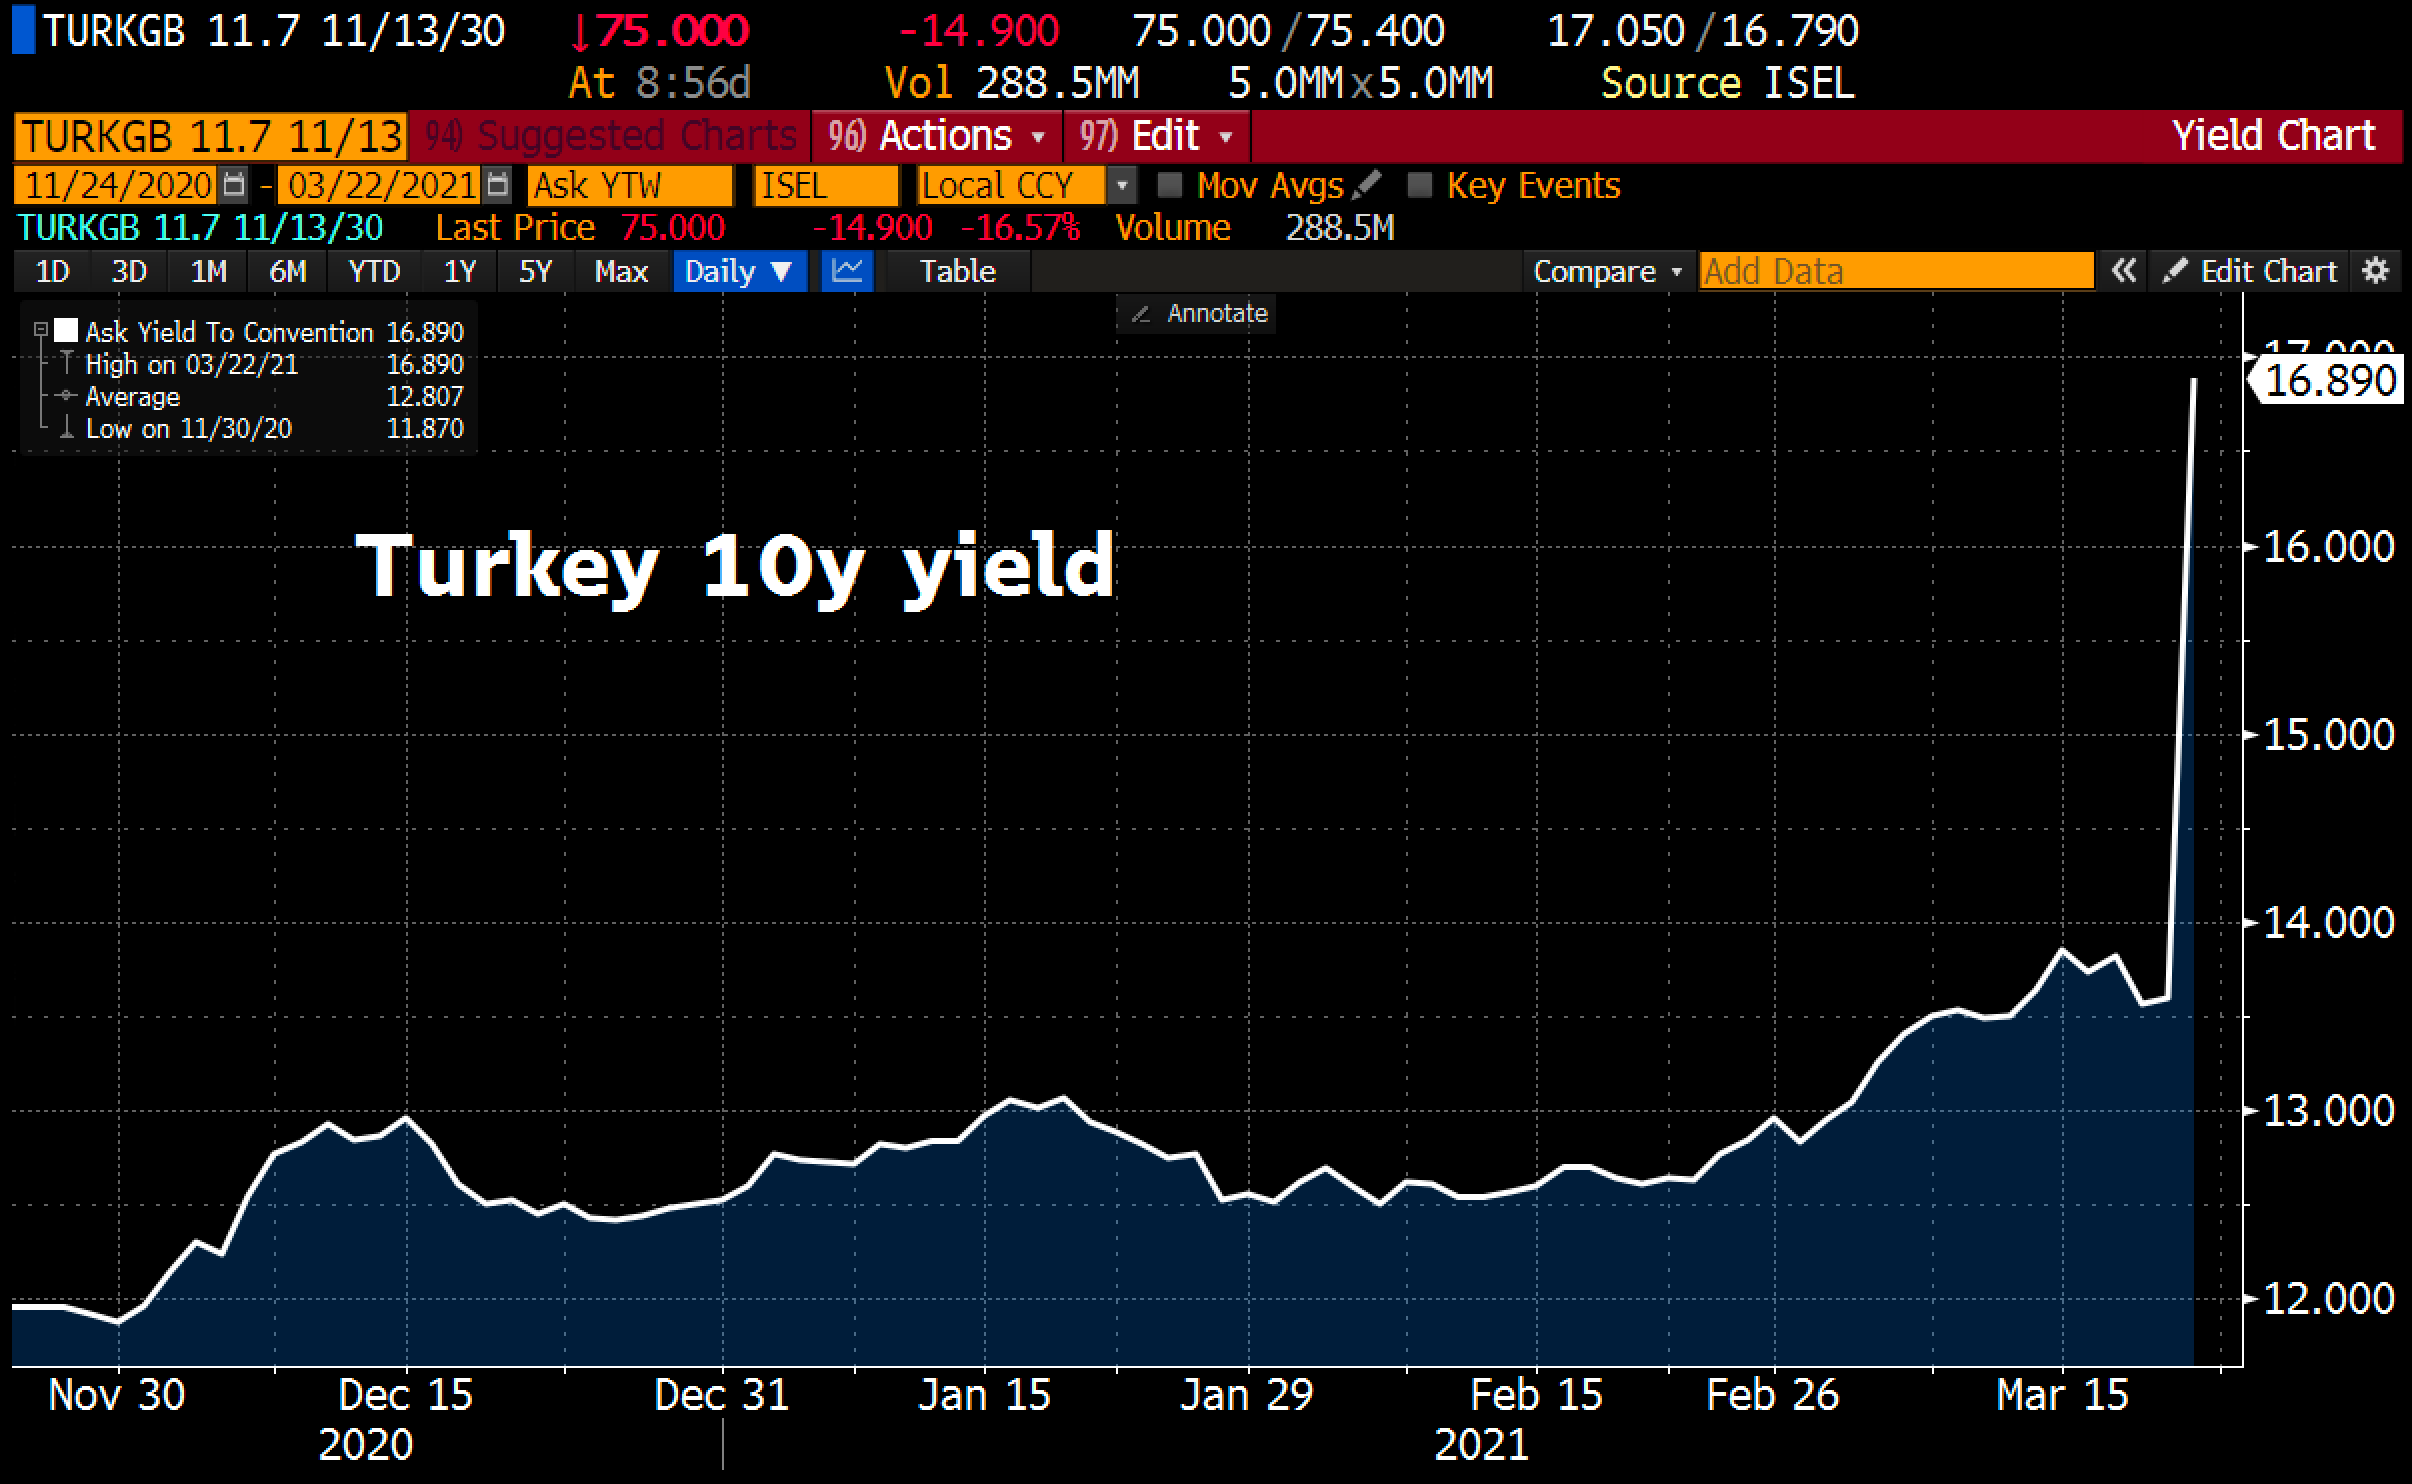
This alert in Turkey is a warning for all emerging countries. The U.S. bonds market make people worrying, but the other emerging bonds markets are even more heckled. The dollar serves as a refuge, as in every other crisis of this type.
As we had envisioned starting in early January, the record of short positions on the dollar caused a short squeeze that was even greater than anticipated because it has to go back up to 2014 to return to an equivalent number of closures of short positions. In barely a few weeks, the Hedge Funds became long on the dollar again, a position that they had abandoned “in mass” since last summer.
And in fact, it was right at the time this short squeeze started up on the Dollar that the false breakout of gold occurred, in late December 2020!
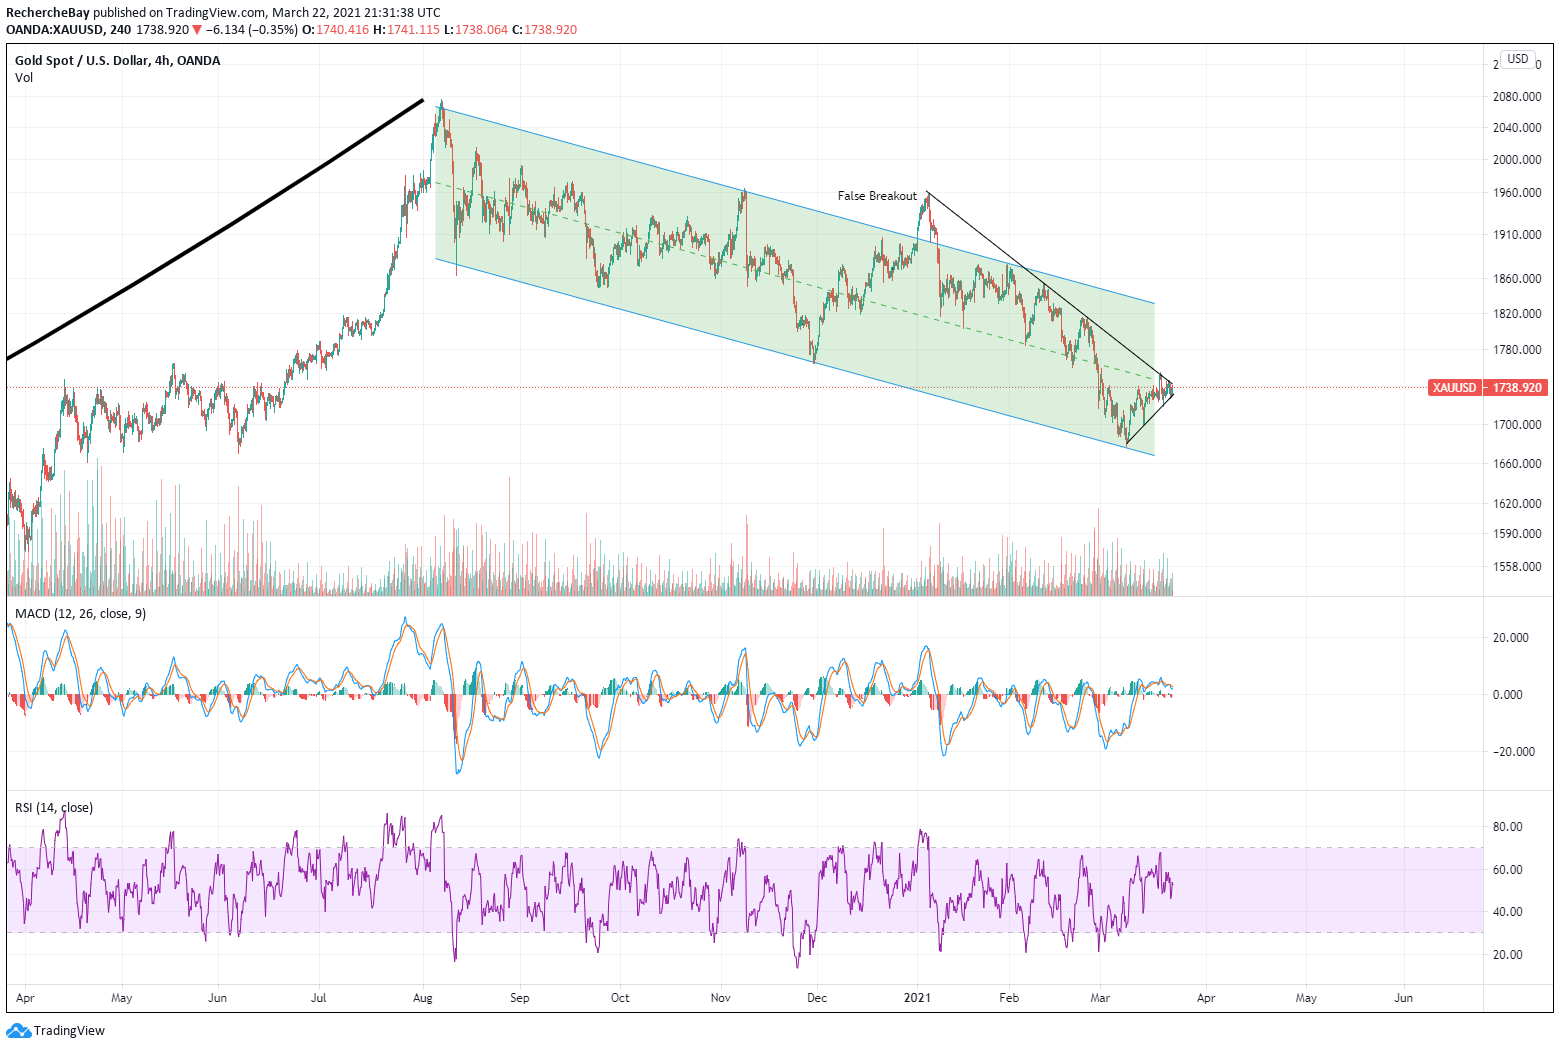
Since January, gold has come back to the bottom of its consolidation flag, then in fact regained its bear trend set off in this dollar short squeeze. This was decision time for gold, at a crucial moment where we are witnessing a exhaustion of the dollar short squeeze and a cracking of the entire bond market, both at the same time. Within the next few days, gold is going to have to decide if it will regain its status as a safe haven.
Regarding the physical silver market, the premiums observed indicate a tension on available stocks of metal. As the director of a major mining company in the sector told me, there is no silver shortage, on the other hand there is a shortage of silver at the current price! The rush on the physical stock continues. If the price of silver remains at these levels around $25 per ounce, the premiums will soon reach 100%: in order to purchase one ounce of silver, you will soon have to spend $25 at the official price and a $25 premium!
The last time we observed these types of premiums on silver, was when this metal cost $11, on the eve of when silver started soaring towards $50.
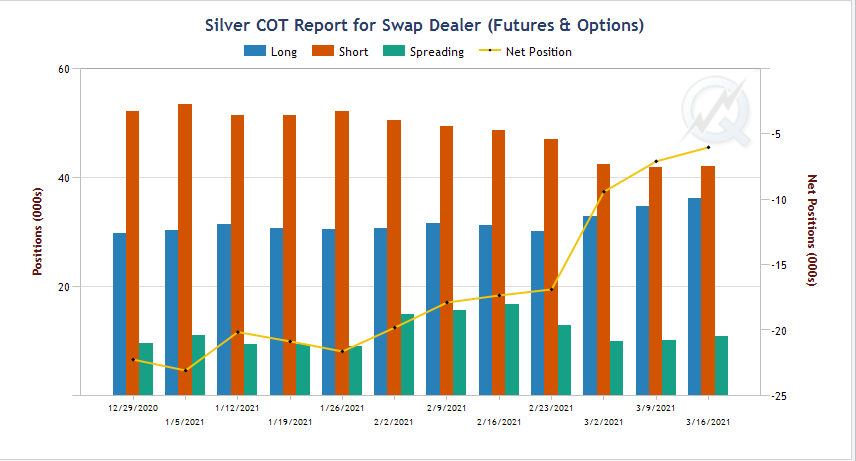
This level of “paper” price, disconnected from physical demand, will in any case allow bullion banks to cover their short positions at lower cost; swap positions are returning to net positive positions:
In any case, this pursuit of consolidation of mining stocks will offer us some fine opportunities for purchasing.
Reproduction, in whole or in part, is authorized as long as it includes all the text hyperlinks and a link back to the original source.
The information contained in this article is for information purposes only and does not constitute investment advice or a recommendation to buy or sell.


