The chart of the week, which went viral on social networks, compares the performance of the markets, represented by the curve of the SP500, and the real yields of the companies listed on this market:
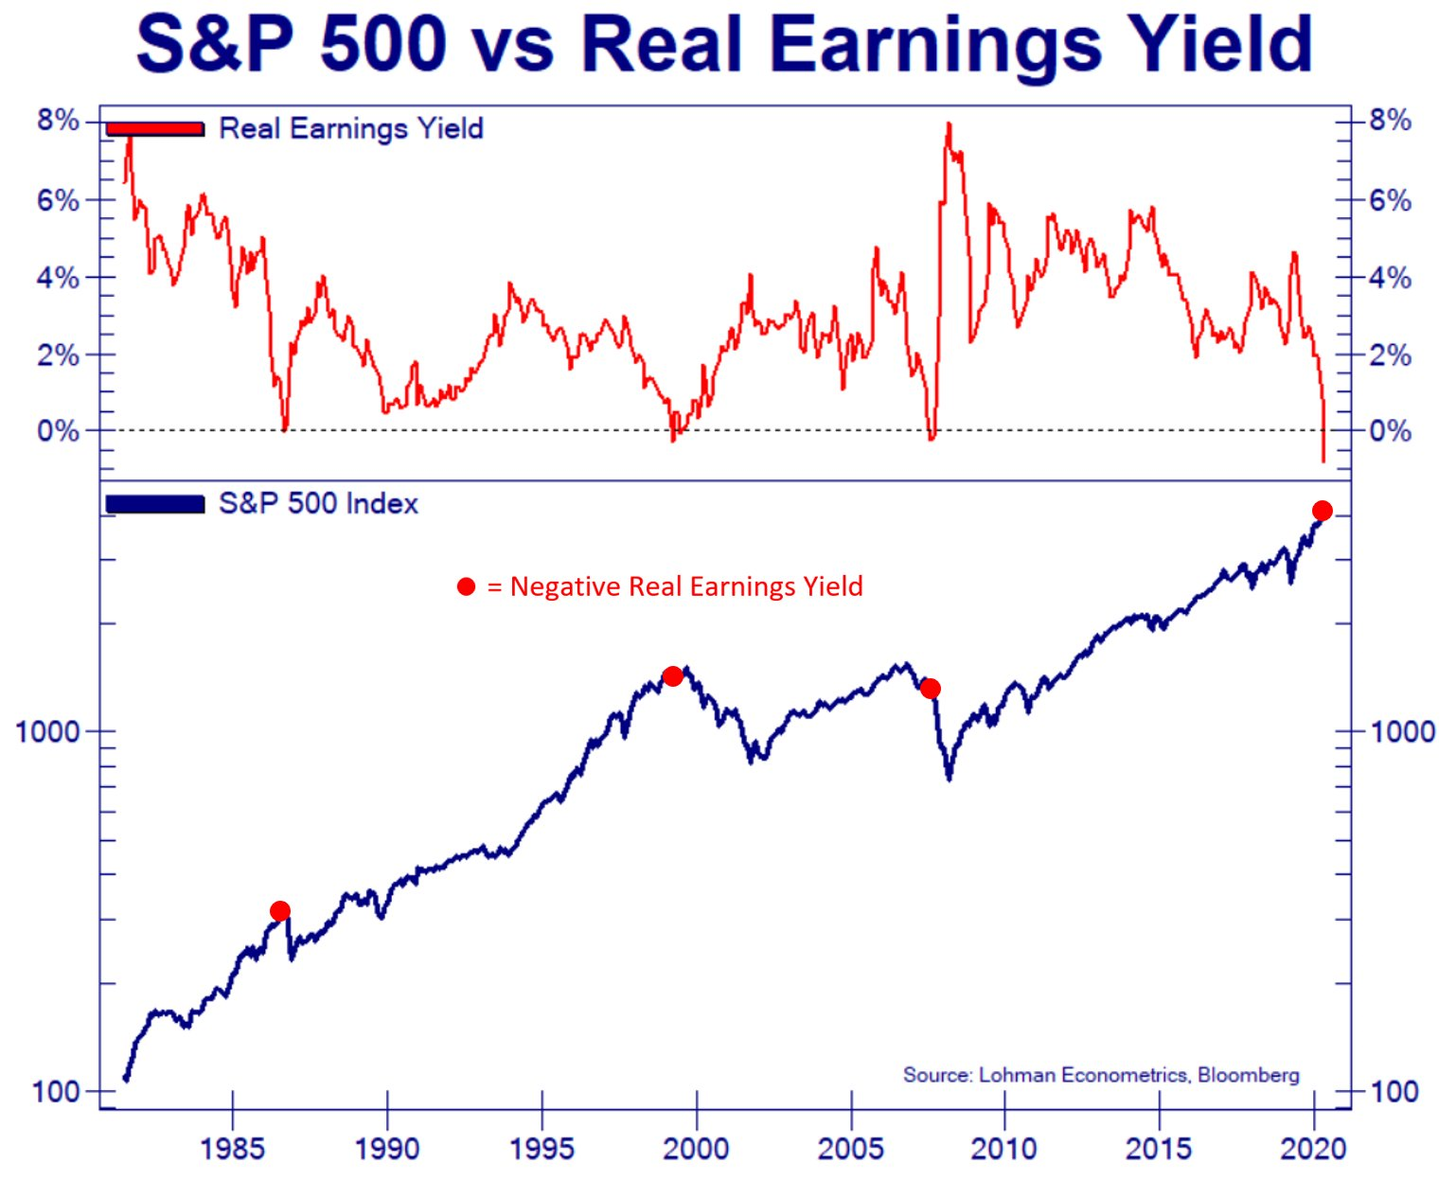
The actual remuneration from dividends in the listed companies in the United States has never been as low as this in the last 50 years. In other words, the remuneration of the listed companies’ shareholders has been gnawed away at by the high inflation we have been seeing for several months. The real yields are now negative, and whenever that has happened in the past, a significant correction of the markets has followed.
Inflation poses a problem on the markets.
But inflation is being exported elsewhere as well, including to countries with weak growth. The hike in energy prices, for instance, doubled the inflation rate (+1.5%) in the United Kingdom in April.
This inflation is now affecting the level of salaries, and the pressure in this sector is getting larger and larger: salaries are at all-time lows when you compare them with other forms of revenues. Indeed, salary compensation makes up the lowest portion of the U.S. GDP calculation since the 1950s!
Nonetheless, these pressures, and an annual inflation rate of 10%, do not appear to be frightening the Fed for the time being. It is true that in the United States, the growth rate in the economy is heading toward figures not seen since the start of the century. Forecasts for GDP growth are now in excess of 7% for this year. These kinds of figures have not been seen since the 1980s. Finally, even “slightly” higher inflation would be acceptable in the context of a strong recovery, all the more so given that it is “transitory” and that the Fed has the “tools” to control it. In summary, this is the message that has been delivered on an almost daily basis by the Fed since inflation first reared its ugly head in the beginning of the spring of 2021.
The explosion in U.S. demand, moreover, is more akin to a genuine rush on all consumer goods. The chart showing the variation in “real” retail sales (which takes inflation into account) is spectacular:
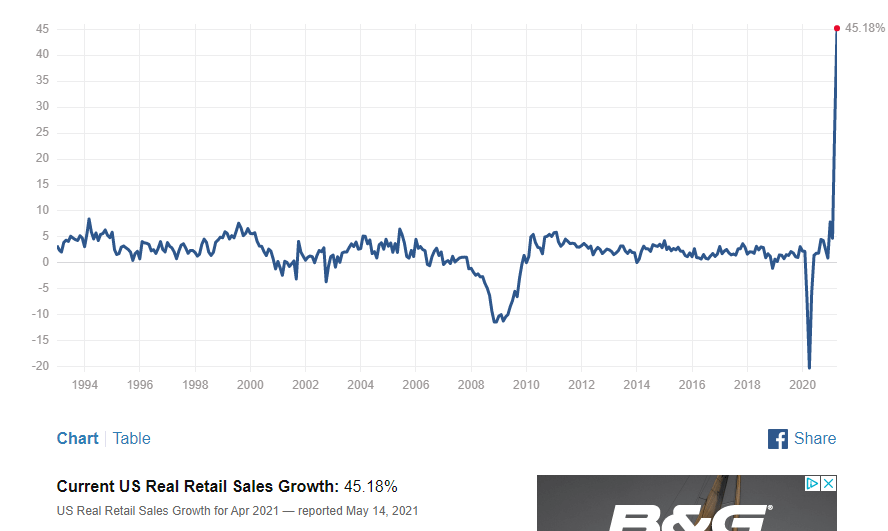
This indicator measures the urgency with which consumers are hastening to buy goods before their prices rise, seeking to benefit, as quickly as possible, from the largesse shown by governments in this context of economic recovery.
Faced with these shocks to the real economy, the Fed is giving the impression that it can “manage” its interventions in a measured and incremental manner. To accept that, however, would be to forget that, for years, its interventions have deeply changed the nature of the markets, and its actions now have a direct impact on the real economy, and especially on the value of the dollar.
The Fed has supported financial assets, “whatever the cost.” Today, inflation is the logical result of the explosion in monetary creation engendered by this policy of supporting assets “at any price.”
This rise in inflation also poses an immediate concern to the U.S. Treasury. The country has bonds to sell and these bonds yield less than 2% interest. If we measure inflation at over 2%, it appears difficult to sell a product that buyers are going to sell, if one follows the math, at a lower price.
Finally, it is up to the Fed to buy the Treasury bonds that everyone is shunning, precisely because of the unacceptably low yields brought about by this inflation. The bottom line is that the Fed is still obligated to step up its monetization program!
Sooner or later, the size of this balance sheet is going to start causing a concern regarding the value of the dollar...
Faced with this brutal and disorderly rise in inflation, the Fed no longer really has a good solution open to it: either it stops monetizing the debt and provokes a financial crisis, or it carries on monetizing the debt, thereby risking a monetary crisis.
The first solution was briefly tested in 2018... In the last few years, the only thing at the Fed that really was transitory was the period of “tapering,” that period when the Fed reduced its monetization. That led to a crisis of liquidity in the banking system, the famous Repos crisis of 2019, forcing the Fed to resume, with renewed vigor, its buying up of assets. The same tensions on the inter-bank markets are resurfacing today. The Fed is once again forced to open the floodgates to support liquidity and its balance sheet is moving upwards again, at the same rate of increase as in September 2019.
In case you missed it: #Fed has ramped up balance sheet expansion. Total assets have jumped by $92.2bn in the past week, most since March, to hit fresh ATH of $7,922.8bn as Powell keeps printing press rumbling. Fed balance sheet now equal to 36% of US's GDP vs #ECB's 76.6%. pic.twitter.com/p7VoM6MDec
— Holger Zschaepitz (@Schuldensuehner) May 24, 2021
The markets are currently testing the value of the U.S. currency. As a matter of urgency, the United States must send other signals on its fiscal policy, particularly if it does not want to see the collapse, plainly and simply, of its currency.
It is in this context, no doubt, that we have started to see a change of tone this week from the U.S. administration, in relation to its recovery programs. President Biden has even gone back on one of his campaign promises, refusing now to bring about the canceling of student debt, at a time when the total defaults on this debt has reached $435 billion... The constraints imposed by the market are visibly greater, now, than the political argument. It is not certain that this will be enough to restore confidence in the U.S. currency’s future. The Fed has no choice, it must allow the dollar to depreciate in order to avoid a new financial crisis.
This explosion in the Fed’s balance and this upcoming crisis of confidence in the central bank’s capacity to defend the value of the dollar mean that far higher gold prices can be predicted.
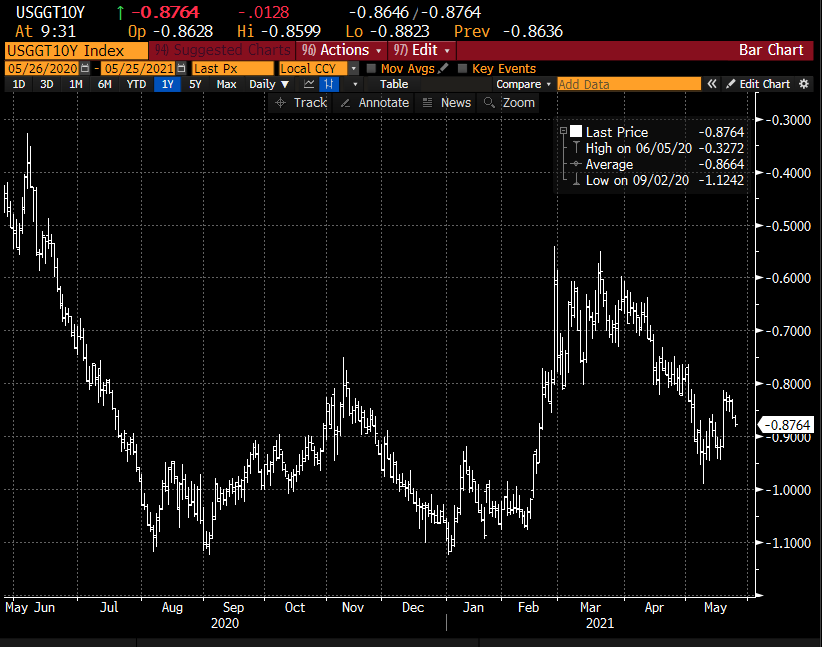
For now, as we have been saying in our analyses for several months, the gold prices are being directly steered by algorithms adjusted for the inverse value of the real yields.
Here is the curve for real 10-year U.S. yields:
And here is the chart for the price of gold, in the same period:
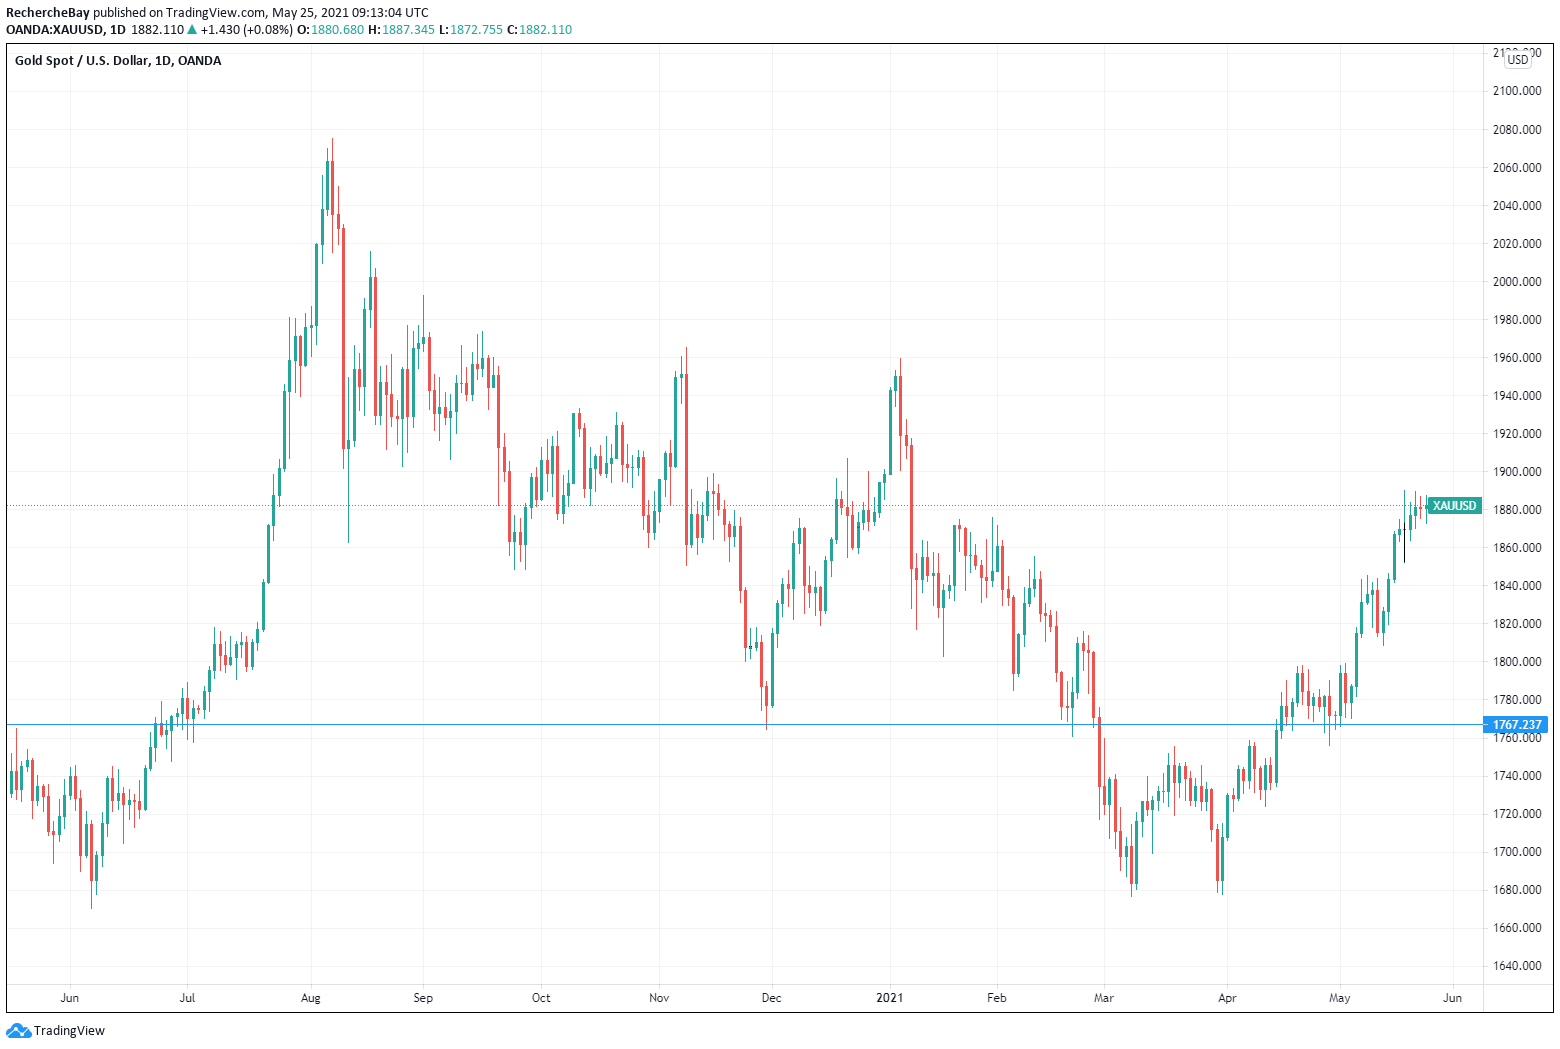
When the real 10-year yields are low, gold rises, and vice-versa, and this mechanism has been in place since the start of the sanitary crisis.
Given the importance of this correlation, in the short-term, it is therefore more useful to look at the control of inflation and the Fed’s rates, rather than the functioning of the futures market and its impact on the physical stocks.
The monitoring we are doing of the state of the physical market and of the tensions on the Comex is nonetheless very important: here, we are of the school of thought that thinks it really is this systemic problem, that of an inability on the part of the paper market to describe the true value of precious metals, that will really make the gold prices take off.
This tension on the stocks and on the functioning of the futures market is even more sensitive on silver. That is why we are shining a particular spotlight on this metal.
Since February 2nd, the date of the Silver Short Squeeze, 1 300 tons of silver have disappeared from the vaults of the Comex. That is 15% of the theoretical stock exhausted in just a few months.
This month, the level of the Open Interest ten days from the end of the listing of the contract is at an all-time high. More than 2000 contracts must be sold or “rolled” to avoid too large a number being transferred to demands for delivery. The massive paper sales on the Comex are aimed precisely at reducing this Open Interest.
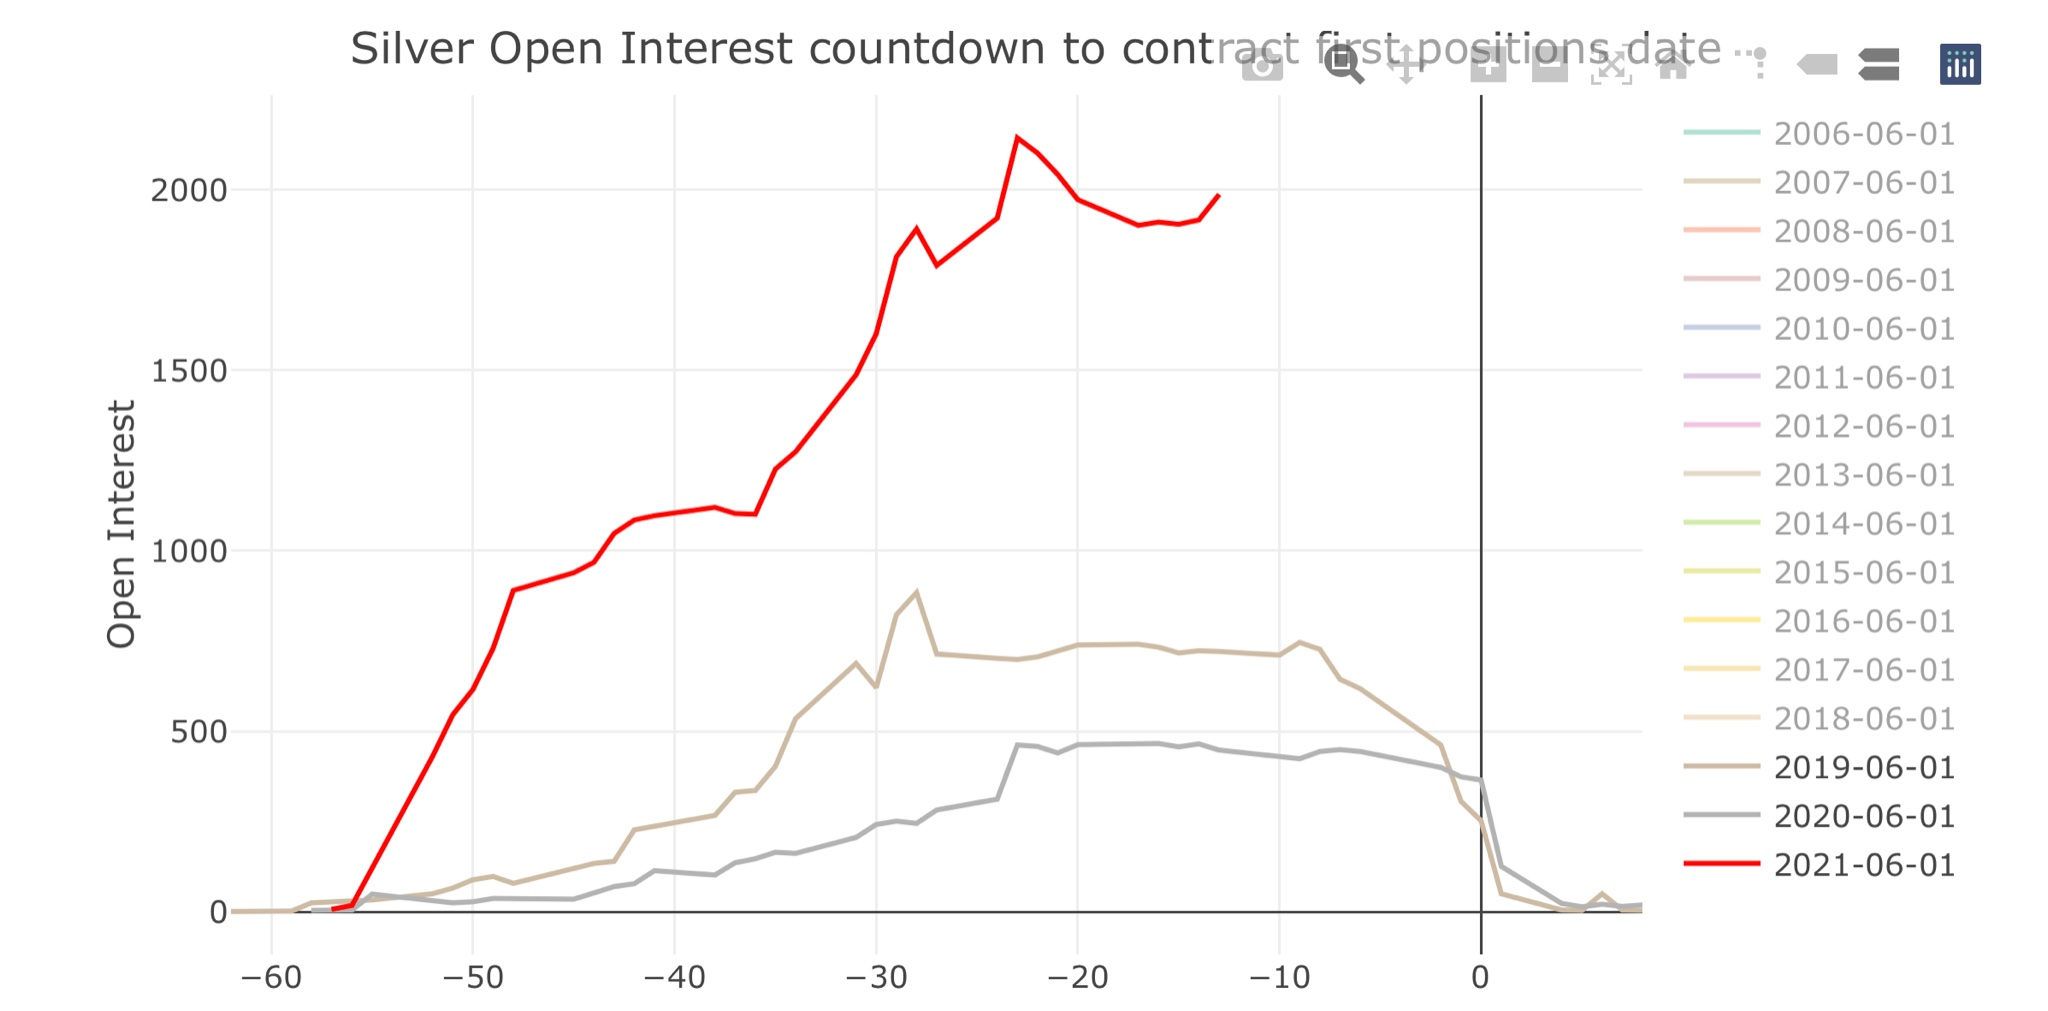
Each month, the effort made by the paper sellers is increasingly important in terms of reducing the volume of deliveries on the stocks of the Comex. It is also less and less efficient every month.
Ted Butler, who has been closely following this market for more than 20 years, is announcing that 4 of the 8 banks participating in this futures market are now in an untenable situation in relation to their short positions, which they are finding increasingly difficult to defend.
According to Ted Butler, the manipulation of these 4 banks is the essential reason that is enabling us, today, to benefit from such a low silver price. Do you know of any other asset whose price has not varied since the 1980s?
The pace of this rush on the vaults of the Comex means that, mathematically, the banks are only being given a few months to cover themselves in an orderly manner. And if this coverage cannot happen in an orderly manner, we could even have a spectacular short-squeeze on this metal that would prompt a brutal rise in the silver prices.
This historic rise in the prices of precious metals is now being announced by certain mining stocks which traditionally anticipate rises in metals.
Last week, we traced the historic chart of Hecla Mining, HL.
This week, let’s take a look at the leader of the “major” producers, Newmont, NEM.
The stock has pierced 3 major supports in the last few days, short-term, medium-term and long-term!
- The support of its bearish trend initiated in 1989
- The support of its trading range channel initiated in 1995
- The support of its bullish flag initiated last summer
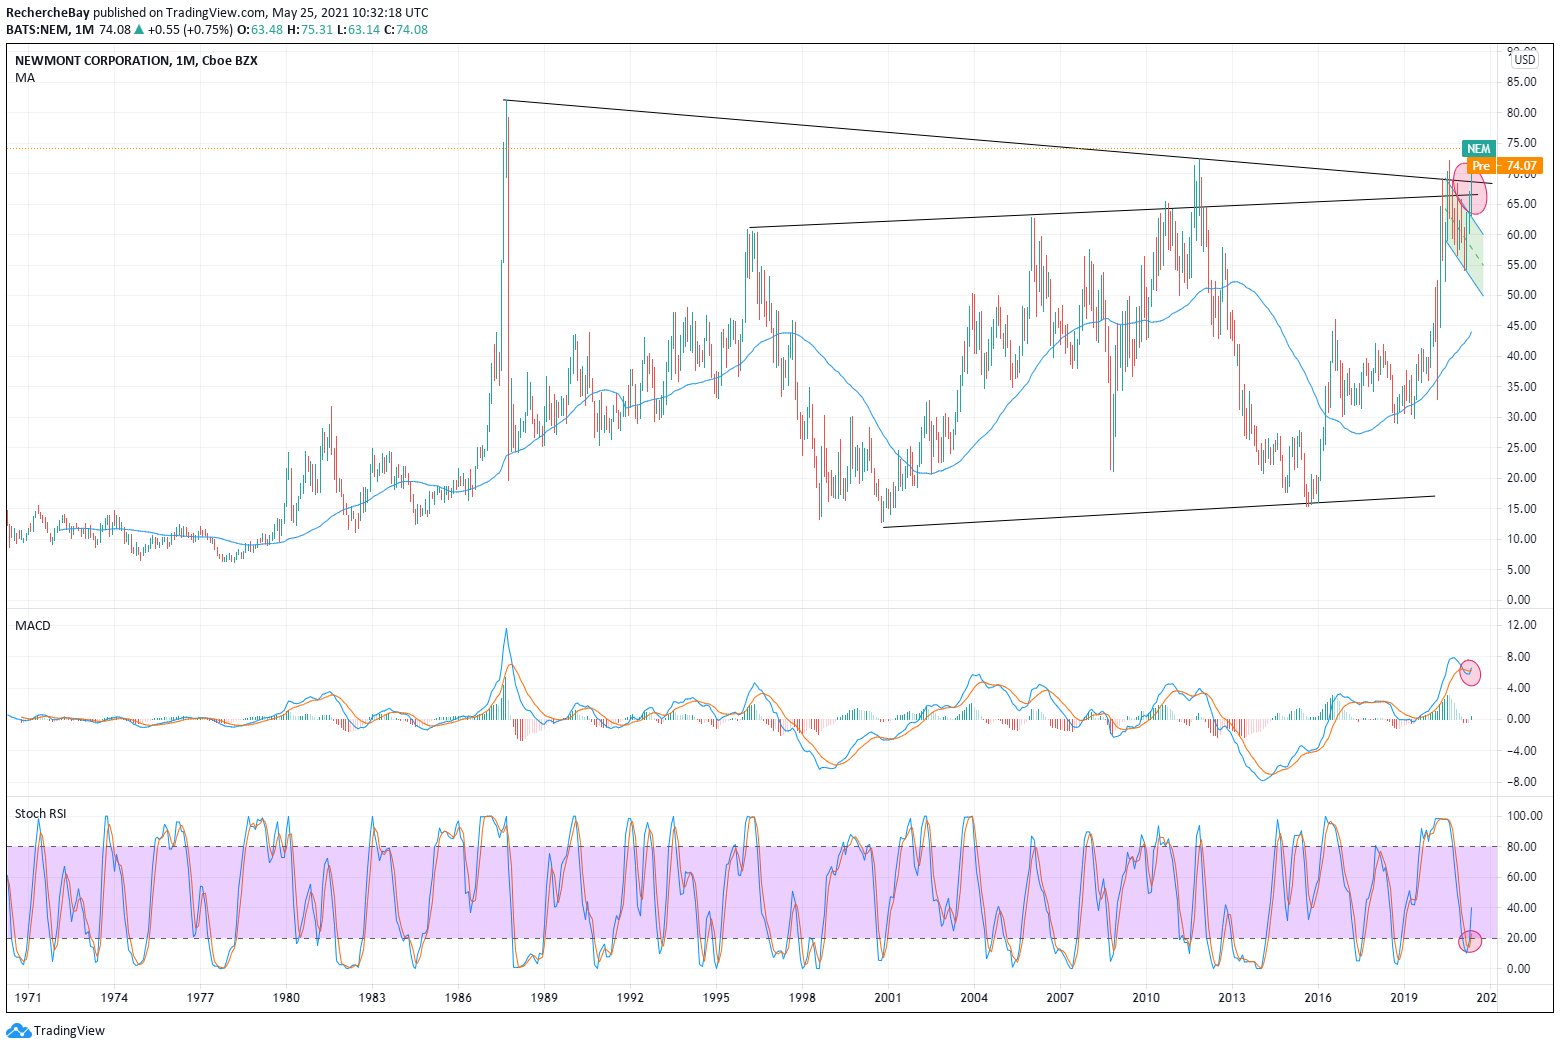
The “breakout” of these three supports was bought, and I note that the volumes of short positions on the equity of producers are now less sustained than during the latest “spikes” in recent months.
For the time being, the market is rewarding the cash flow for the mining stocks and the grammage values for the junior minings. It is on these aspects that our portfolio is focused, though we are aware that at any moment the market may evolve on the basis of other criteria without giving us notice! In any case, this focus on the limited criteria for the valuation of mining stocks allows plenty of opportunities for investments.
Original source: Recherche Bay
Reproduction, in whole or in part, is authorized as long as it includes all the text hyperlinks and a link back to the original source.
The information contained in this article is for information purposes only and does not constitute investment advice or a recommendation to buy or sell.


