The monetary policies of the central banks have contributed to a deep change in the distribution of wealth in Western nations. With a near zero or even negative interest rate policy, savers have seen their incomes gradually reduced to zero as well.
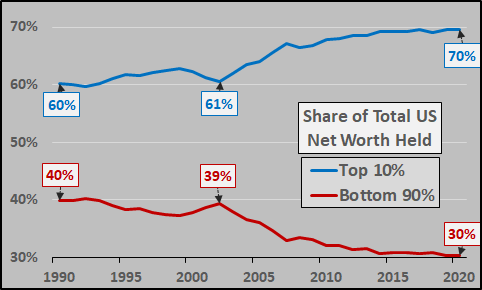
Over the past few years, the gap between the richest and the poorest has also widened. The richest 10% of Americans hold 70% of the wealth of the country, while the remaining the 90% share only 30% of this wealth.
Facing criticism regarding these inequalities, the Fed has committed itself to a concerted action with the Treasury to literally distribute money to the share of the population that has not been able to benefit from the Fed’s expansionary monetary policy.
This largesse by the Fed had, so far, only benefitted the rich, with this newly printed money being “parked” in the assets held by the wealthiest. In real estate, for example, artificially low rates have pushed up prices, effectively excluding the poorest from access to home ownership.
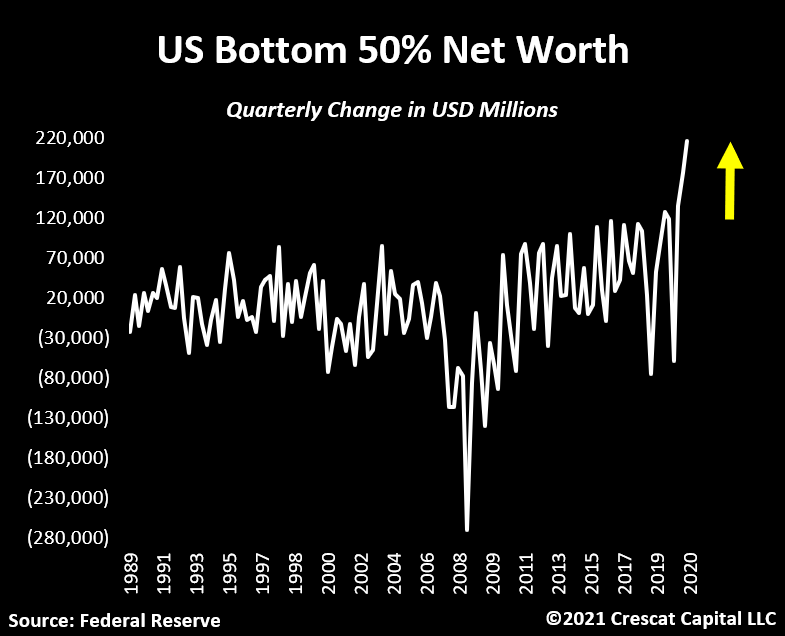
Facing criticism, a more direct approach was needed in order to reach the entire population, hence the idea of “helicopter money”, dumped en masse in the United States over the last year. The effect was not long in coming; 50% of the poorest Americans saw their wealth balloon in a totally artificial manner, despite the health crisis and the economic recession of the prior year:
This increase in wealth has come at the cost of a skyrocketing central bank balance; each week, the amount of money printed by the Fed reaches historic levels.
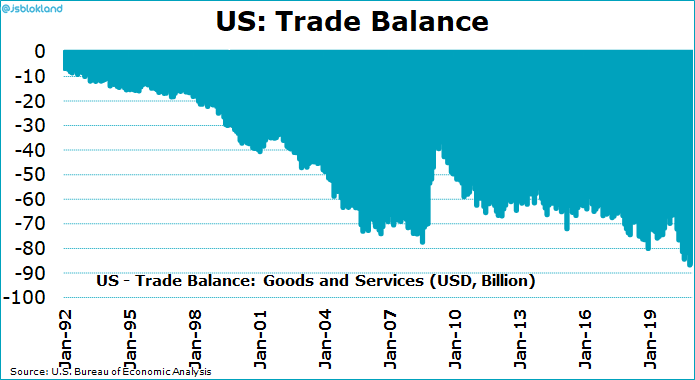
The U.S. budgetary situation has also deteriorated: the budget deficit is exploding and the trade balance is also at a record level: the very generous fiscal policy of the Biden administration has, above all, profited countries that export to the USA.
Biden and Yellen promise that this deficit will be absorbed in the next 15 years. In 15 years, Biden will be 93, Yellen 89. No-one will be demanding an accounting from them at that point. This administration has ended up using the same remedies as the last one. These stimulus measures consist of pushing the problems onto the next generation. These reforms are always considered neutral and inconsequential. They are, but the bill will be handed to our children.
In the United States, the most visible consequences of these recent concerted measures by the Fed and the Treasury are at the inflation level.
The last Markit bulletin shows an increase in inflation to levels not seen since 2011; according to this study, companies are even reporting supply problems and delivery delays that are adding further costs to prices that are already high. The deterioration in the supply chain is notable and has a negative effect on margins. In fact, the margin situation is the worst observed since the beginning of the statistics gathered by this study, going back to 2007. The ISM manufacturing index indicates the same thing: the Prices Paid Index skyrocketed to 86 (+4 points in one month, +40 points - a 100% increase in one year!).
The Fed continues to talk about moderate inflation and promises to use tools to combat this inflation. One wonders at this point if its only tool is to hide this inflation!
After having exhausted savers’ income, barred the poorest from access to property, increased the inequalities between the richest 10% and the poorest 90%, the Fed is preparing to further bludgeon the poorest with inflation that it does not want to measure!
This brutal and soon uncontrolled increase in inflation has had consequences on the bond market: what is the point to hold a product whose yield is lower than the cost of this widespread inflation? Sentiment on 30-year U.S. bonds has collapsed to 2016 levels; the bond market is depressed.
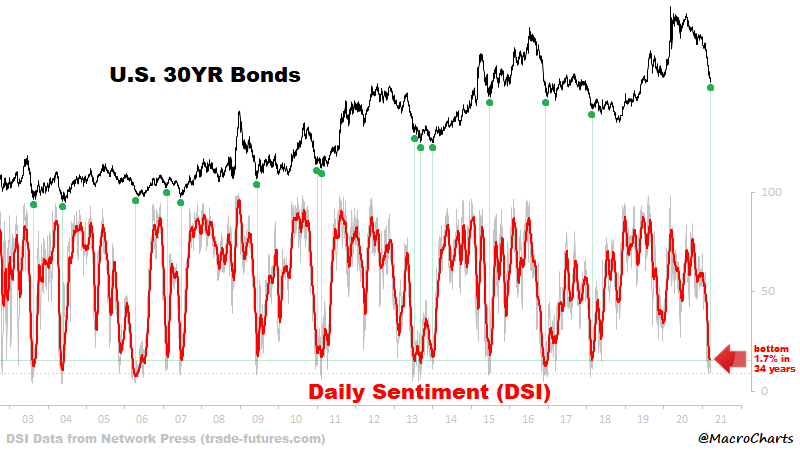
It should be noted, however, that each decrease in this indicator has been accompanied in the past by a stoppage of the bleeding. If history repeats itself, rates should calm down in the short term.
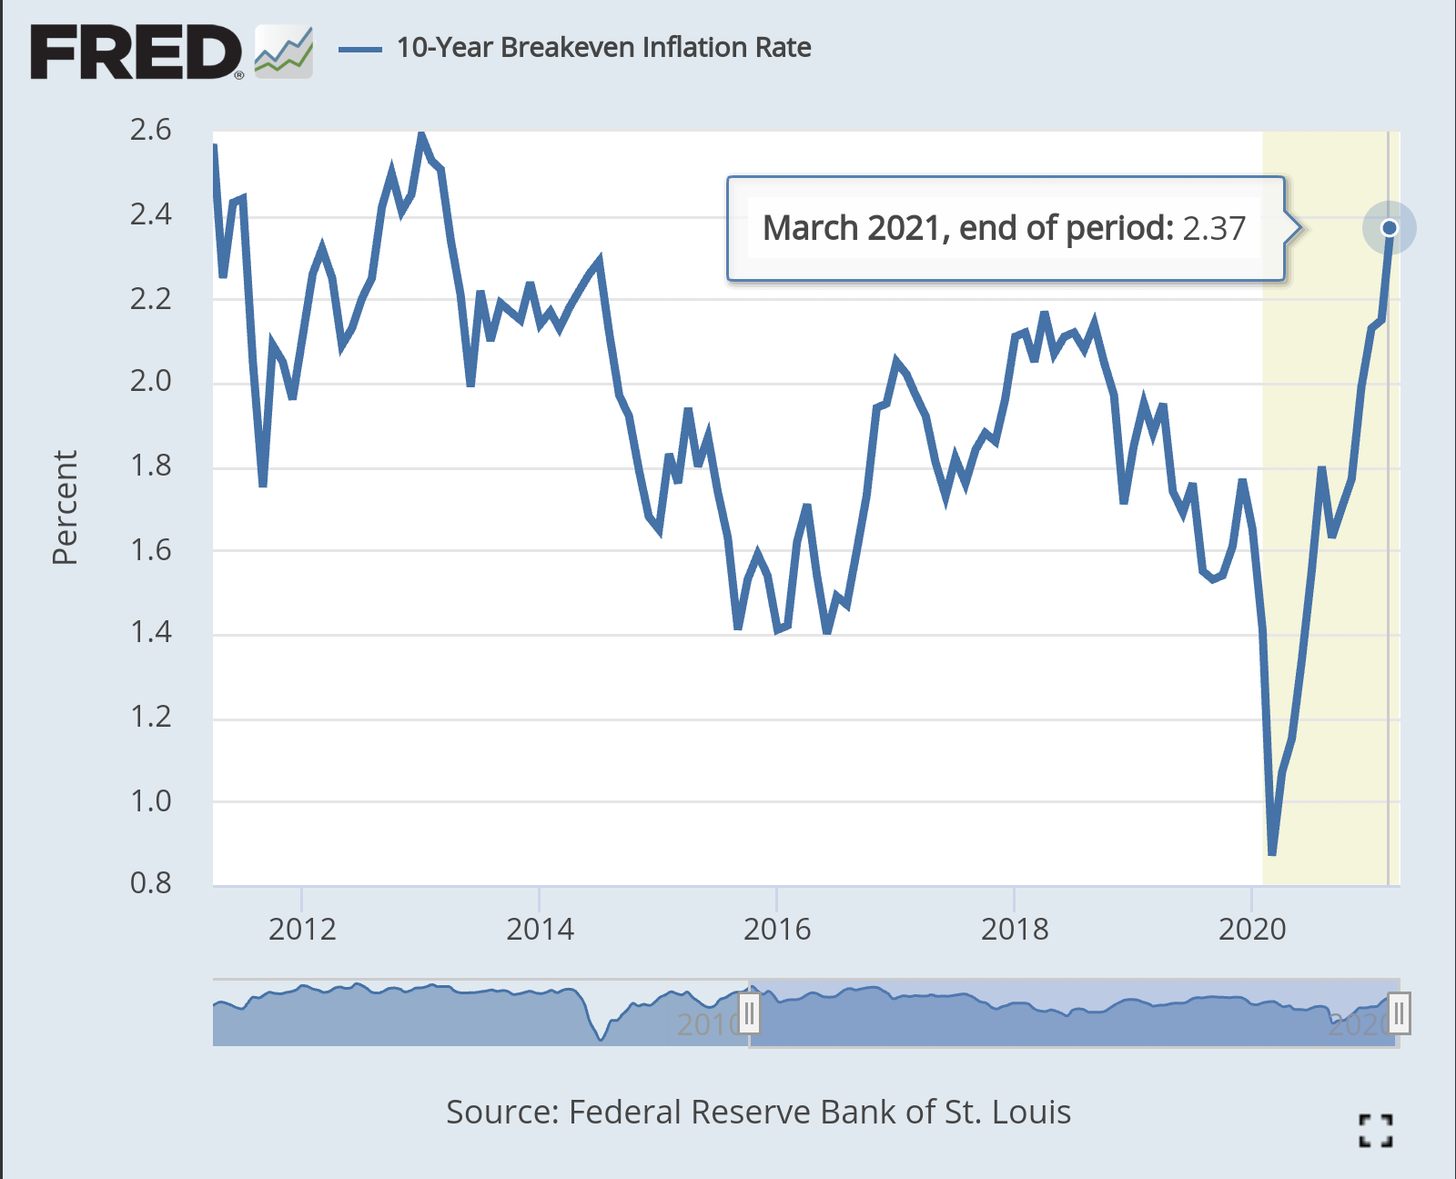
Inflation expectations continue their dizzying increase: the 10-year expected inflation went up from 0.8% to 2.4% in only a few months...
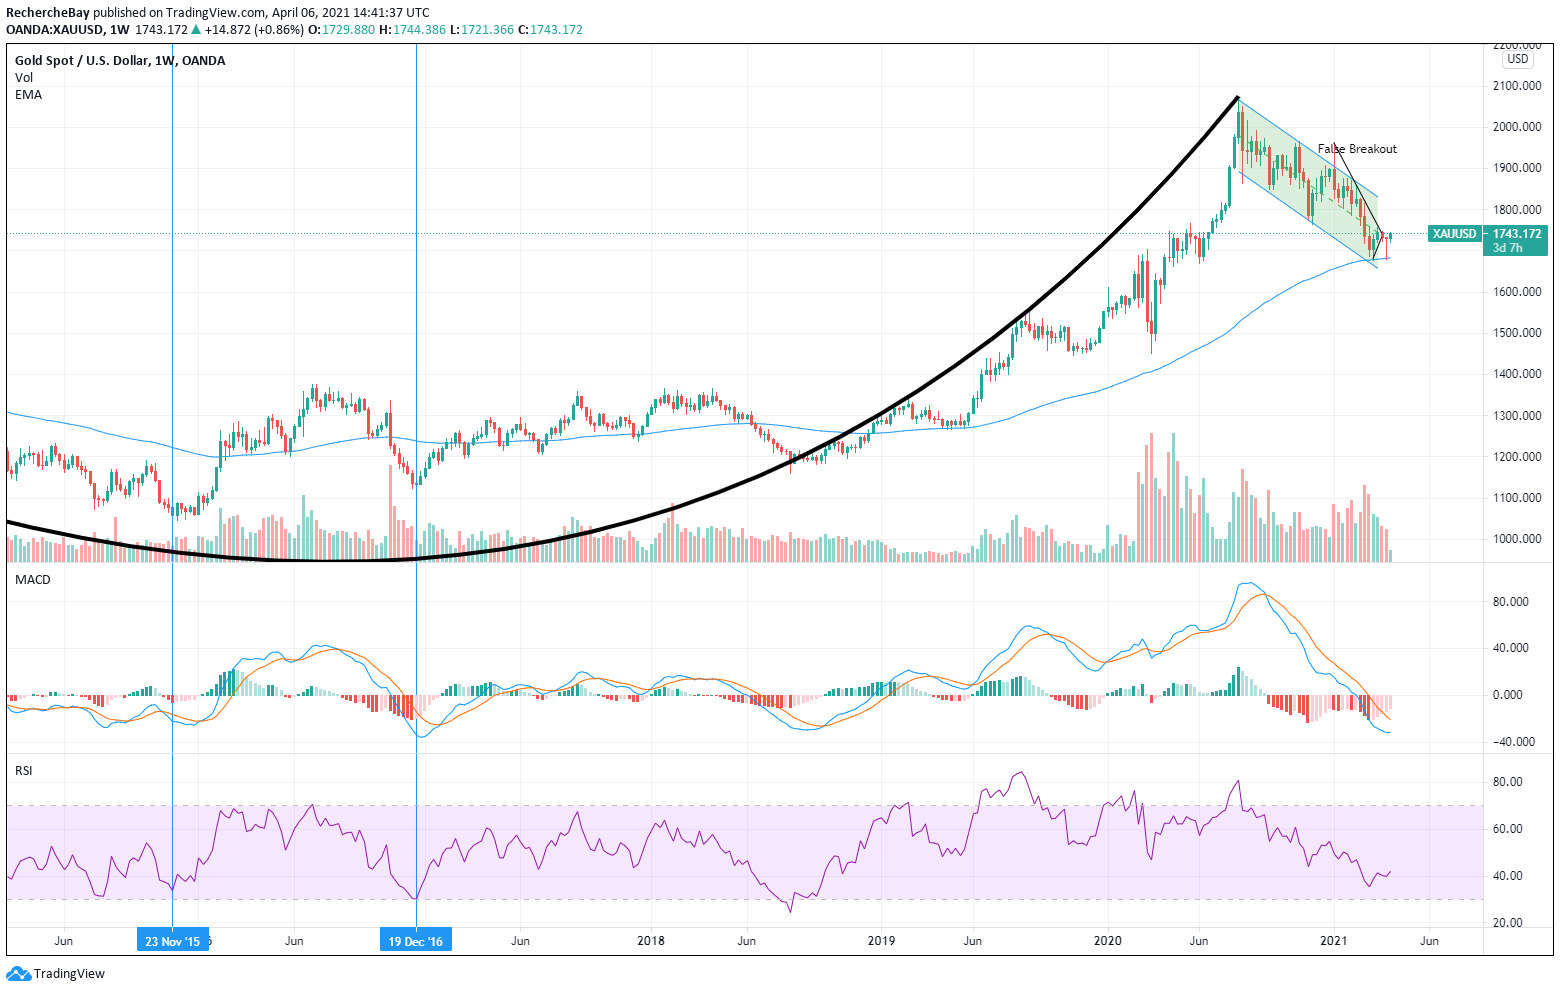
Against such a background, gold has, of course, continued its upward movement, following its worst first quarter since 1982. Gold is getting back its colour once real rates head up again, as happened this week.
And this recovery took place at a time when the “paper” market for gold came to a low.
The total number of open contracts on COMEX is at its lowest since May 2019. The last time we have seen these levels, gold had just entered a new upward cycle, in a classic “take a breath” moment in the futures markets.
On the physical market, gold once became attractive in India again, where imports exploded by 471% in March, in an historic record of 160 tons.
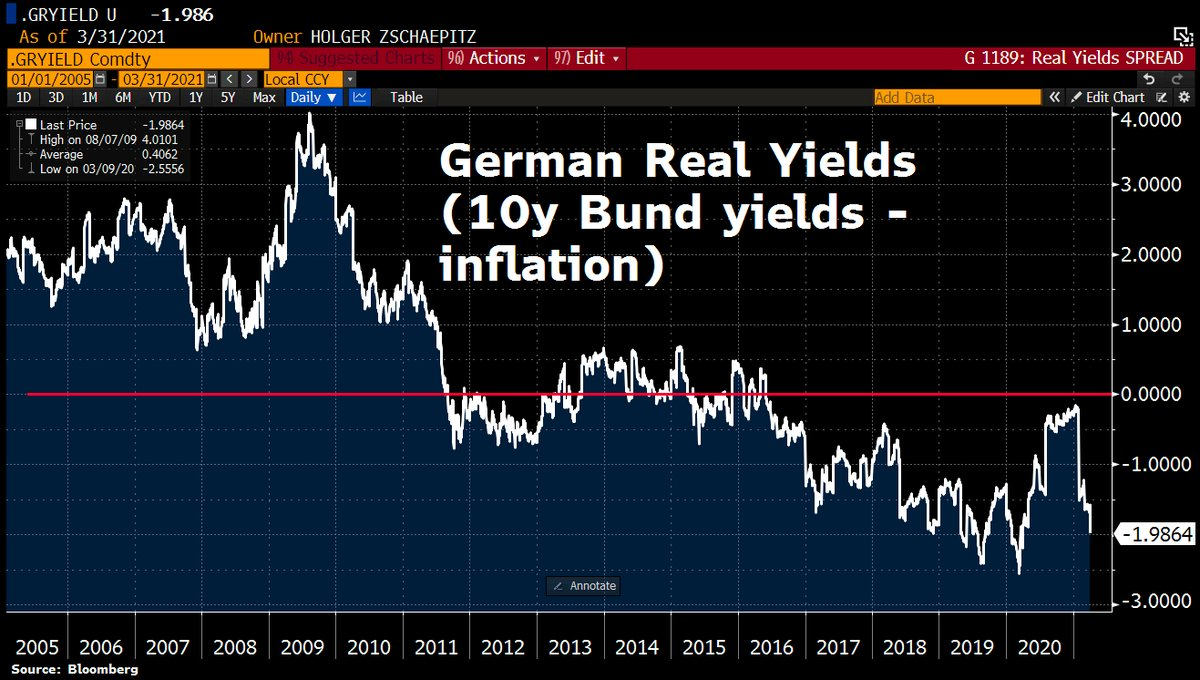
But it is in Europe that gold is the most attractive technically: 10-year real yields are falling in Germany.
While the economic rebound seems to be taking shape in the USA and the UK, the situation is very different on the continent.
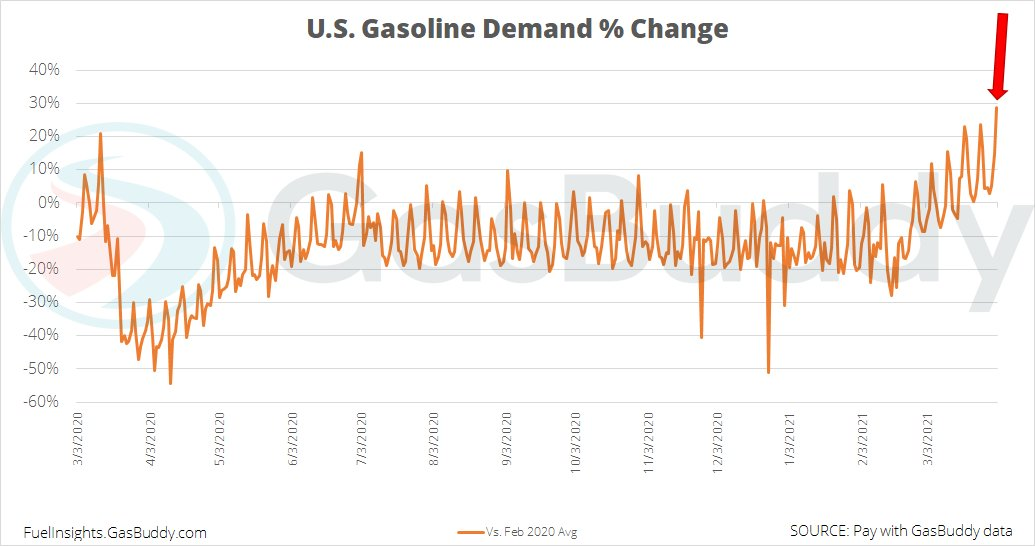
Let’s look at the other side of the Atlantic: gasoline demand is a popular indicator that indicates the first signs of a real recovery in the United States:
Across the Channel, the PMI index in the United Kingdom has increased by a strong 58.9, its highest level in 10 years. Optimism among company heads is at its highest in 7 years and hiring in the manufacturing sector is increasing at a pace not seen since 2014.
But here, in Europe, the situation is very different.
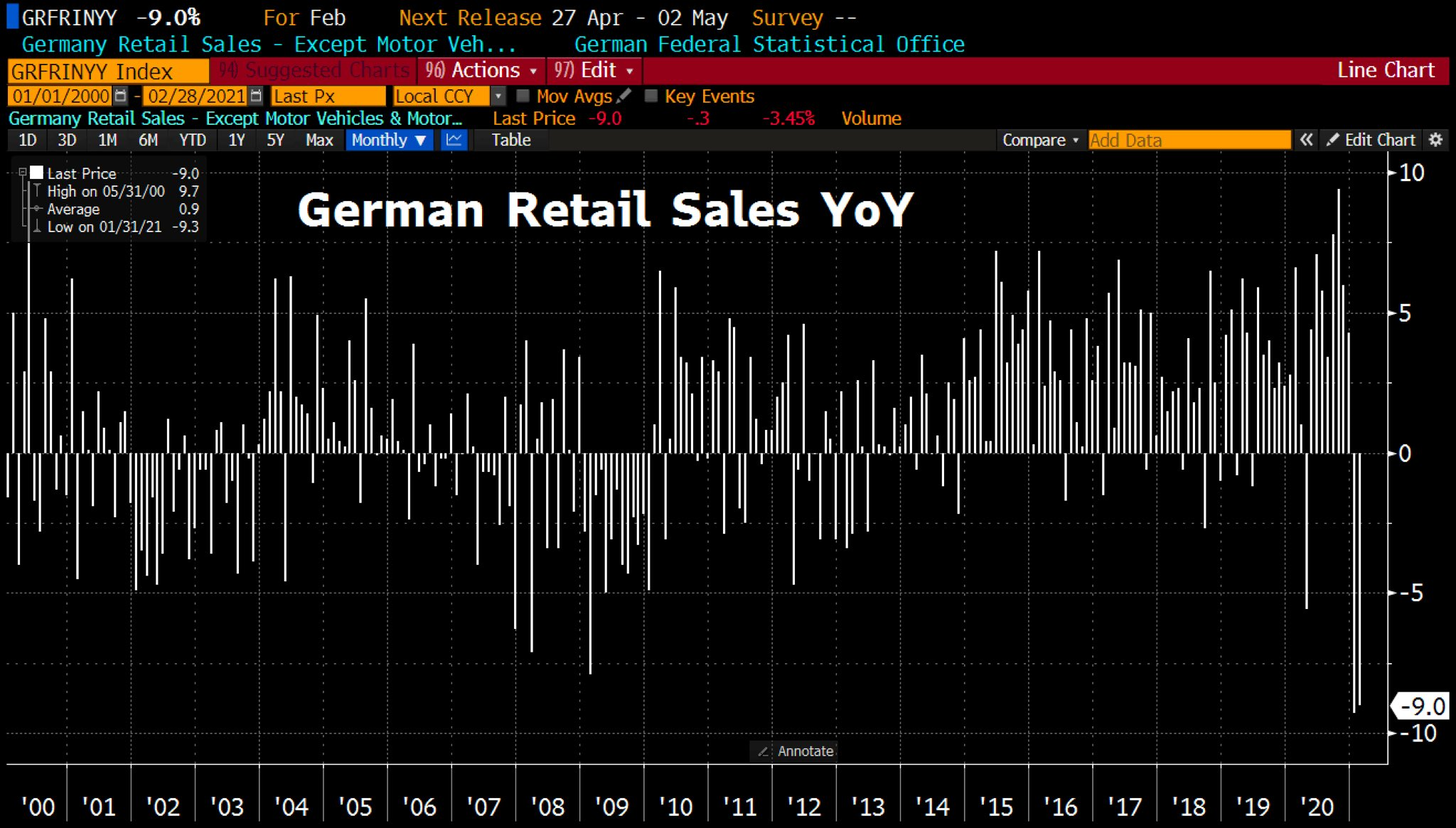
The retail sales figures in Germany are very negative and indicate that the continent is still floundering in a deep recession:
The monetary policy actions of the central bank are still as important as those of the Fed and the BoE, balance sheets are increasing in a coordinated manner, but...
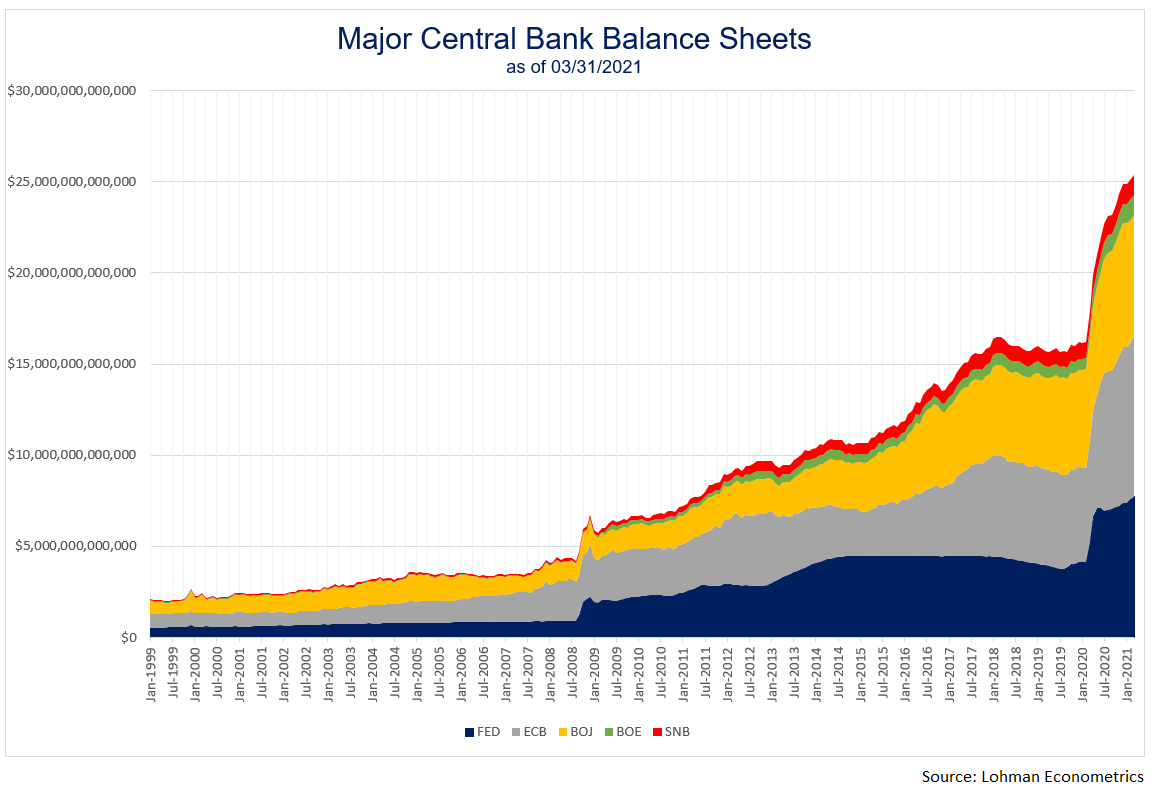
The balance sheet of the ECB is already more than 75% of the European GDP; the gap in the recovery is going to require the ECB to further increase its interventions this year. The ECB is going to further increase its reserves... at a time when its balance sheet is already largely in the red...
Under these conditions, gold is becoming a more attractive investment, even more so in Europe.
As we predicted in the preceding bulletin, gold has increased over the last few days. Chartwise, gold rebounded on the EMA 100 line, forming a bullish hammer that invalidates the downward movement of the triangle detected last week. The MACD is beginning to change direction and the bulls need a strong short-term signal to confirm the new upward leg, which indicates a first market objective towards $1,800, at the level of the “famous” cup with handle support that we have been talking about for a while in our bulletins.
Remember that this very long upward confirmation needs a true breakout of this “handle” to begin a true bull market in gold. We have already had a false signal in the beginning of the year; the true starting point for the increase will only happen when the long-term breakout of this handle becomes effective.
In the charts, mining stocks have also changed their configuration on the chart over these last few months.
Their last low occurred following an upward divergence; this was not the case in February. To illustrate this, look at the GDXJ index (which has nothing to do with a “junior” indicator – but is more representative of the mining stocks as a whole).
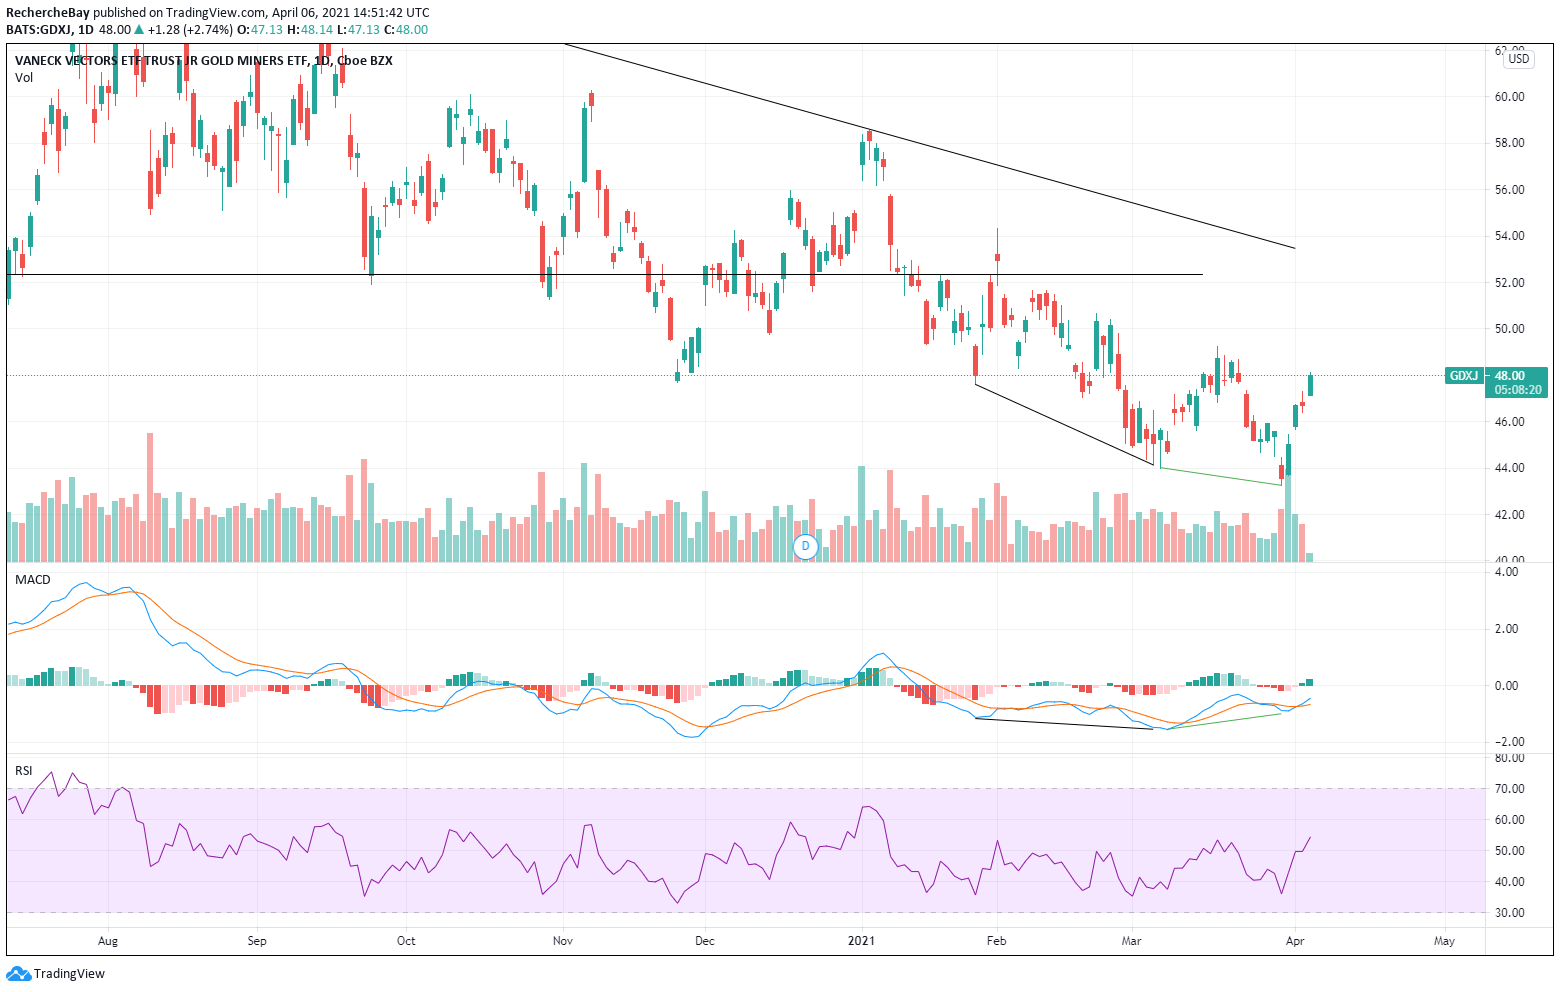
The buy signal that we have used and that I have noted for my subscribers has shown good volume, the highest since last September on this index.
At the end of last month, we already saw an overperformance in this rebound of the values that I have chosen compared to the GDXJ index.

The mining stocks are in any case still largely out of the spotlight, and at this stage one should remain humble; this sector has often given me false hopes of a rebound and even with such an oversold situation and such ridiculous prices, there is still room to regain the confidence of investors in this sector... the road there is still long, after a catastrophic decade in terms of market performance for most of the mining stocks.
Reproduction, in whole or in part, is authorized as long as it includes all the text hyperlinks and a link back to the original source.
The information contained in this article is for information purposes only and does not constitute investment advice or a recommendation to buy or sell.


