Recently, the Silver Institute published its annual report. The report states that silver could rise by more than 30% in 2021, primarily as a result of the spike in demand. The unprecedented context of the crisis has shaken up the market, and seems to be bringing an end to a long, persistent period of under-valuing. The following statistics appear to demonstrate clearly that silver ought to benefit over the next few years.
SILVER SUPPLY
The silver supply fell by 4% in 2020, primarily as a result of a fall in mining production (-6%). In the long term, the supply tends to remain stable. The Silver Institute estimates that the supply should increase by 8% in 2021, mainly due to the rise in mining production.
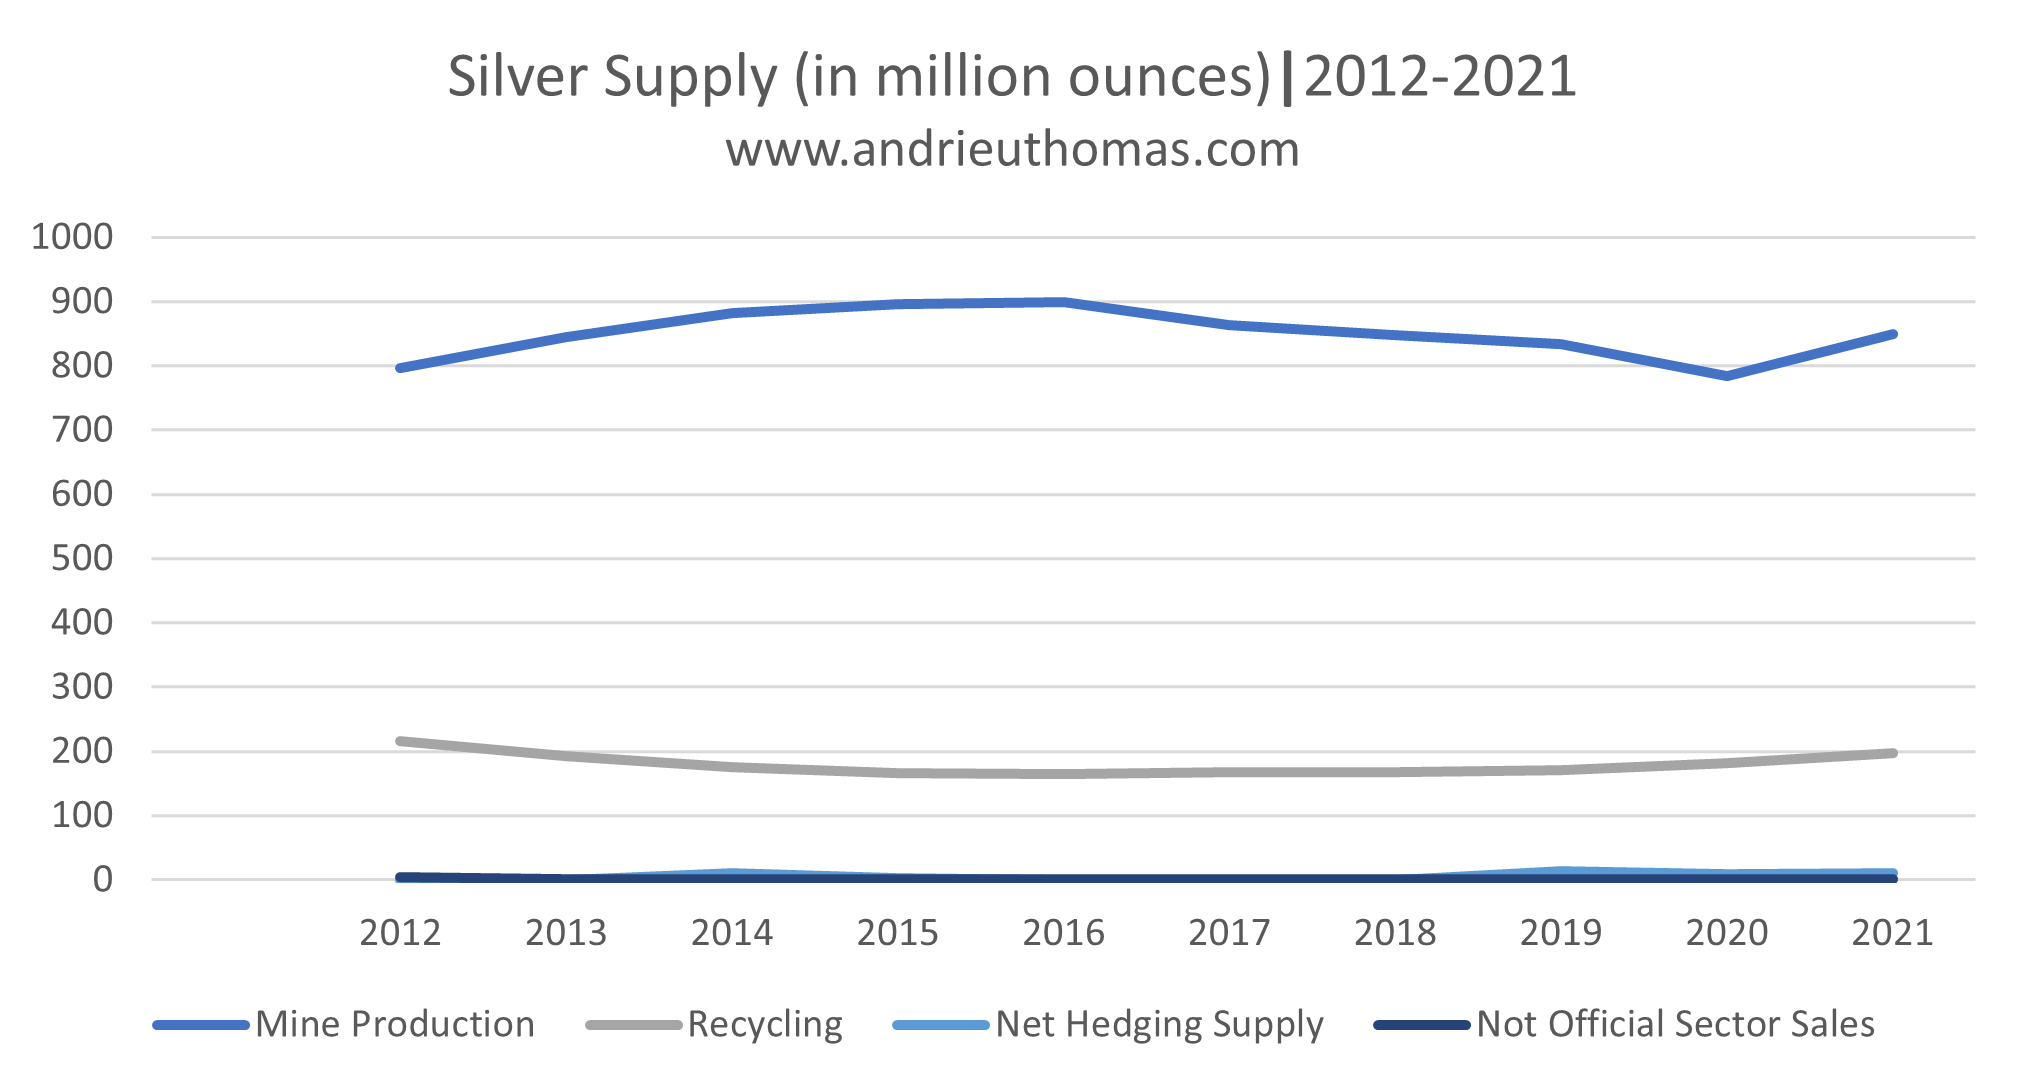
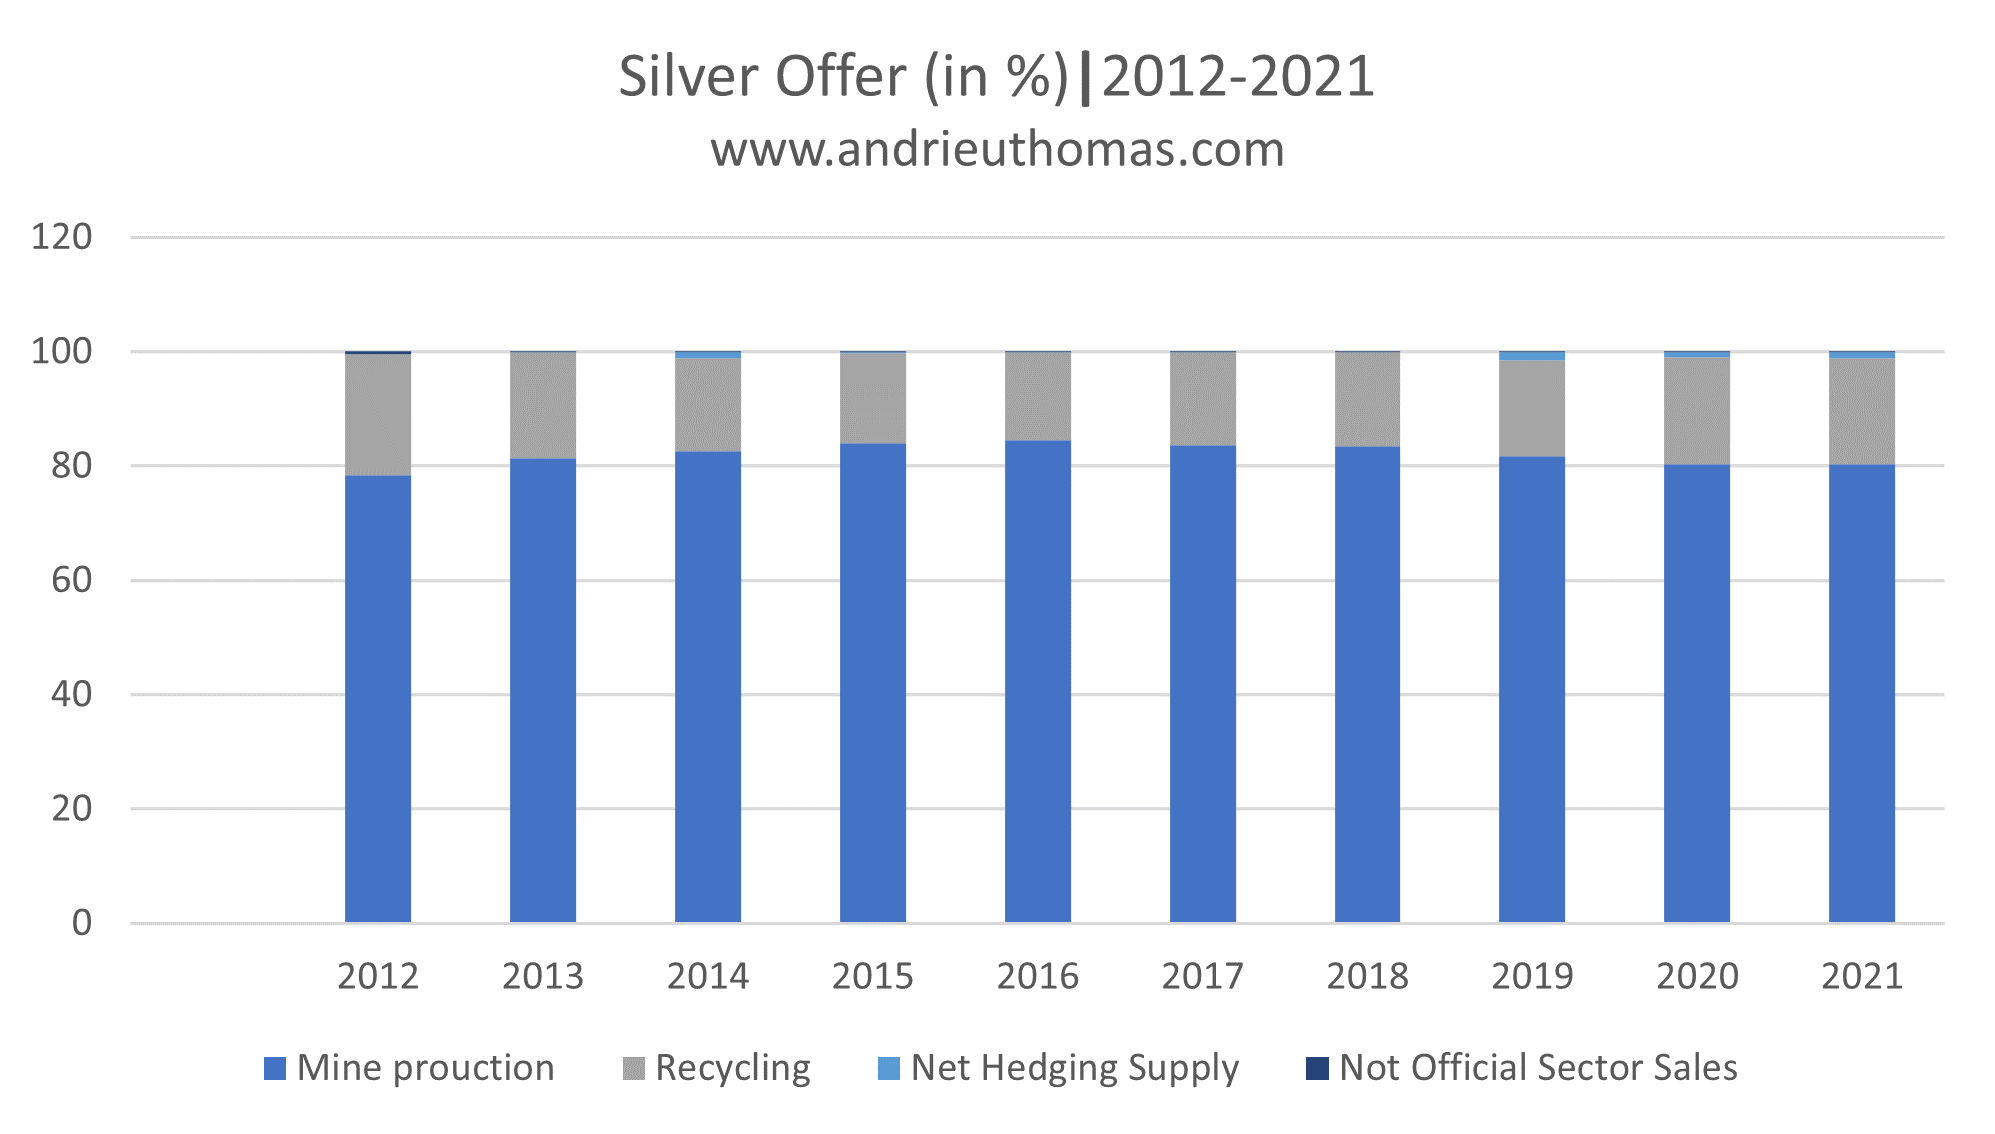
As shown below, silver is maintaining its extreme dependency on mining production. In 2020, 80% of the silver supply originated from the mines. The rest came from recycling. The silver supply is thus highly concentrated, more so even than gold (70% of the gold supply comes from the mines). The growth in supply is extremely substantial as far as silver is concerned. Indeed, one can see an implicit long-term link between variations in the price of silver and mining production.
Mining production is, first and foremost, the remit of South America and Asia. 22% of the total mining production of silver around the world comes from Mexico. As for the countries of South and Central America, they account for 50% of total mining production (Mexico, Peru, Chile, Bolivia and Argentina). China, Australia and Russia account for 13.7%, 5.5% and 5.4% of silver mining production, respectively. Among the leading companies supplying part of the silver supply are Fresnillo, KGHM Polska Miedz, and also Glencore and Newmont. Most of the production costs, per ounce, are between $10 and $15.
All for the natural silver resources identified, these amount to 226 000 tons, i.e. 7.3 billion ounces. In my book, I highlighted the fact that the SNMPE had estimated the amount of natural silver available at 570 000 tons, which corresponds to just over two decades’ worth of the current demand.
SILVER DEMAND
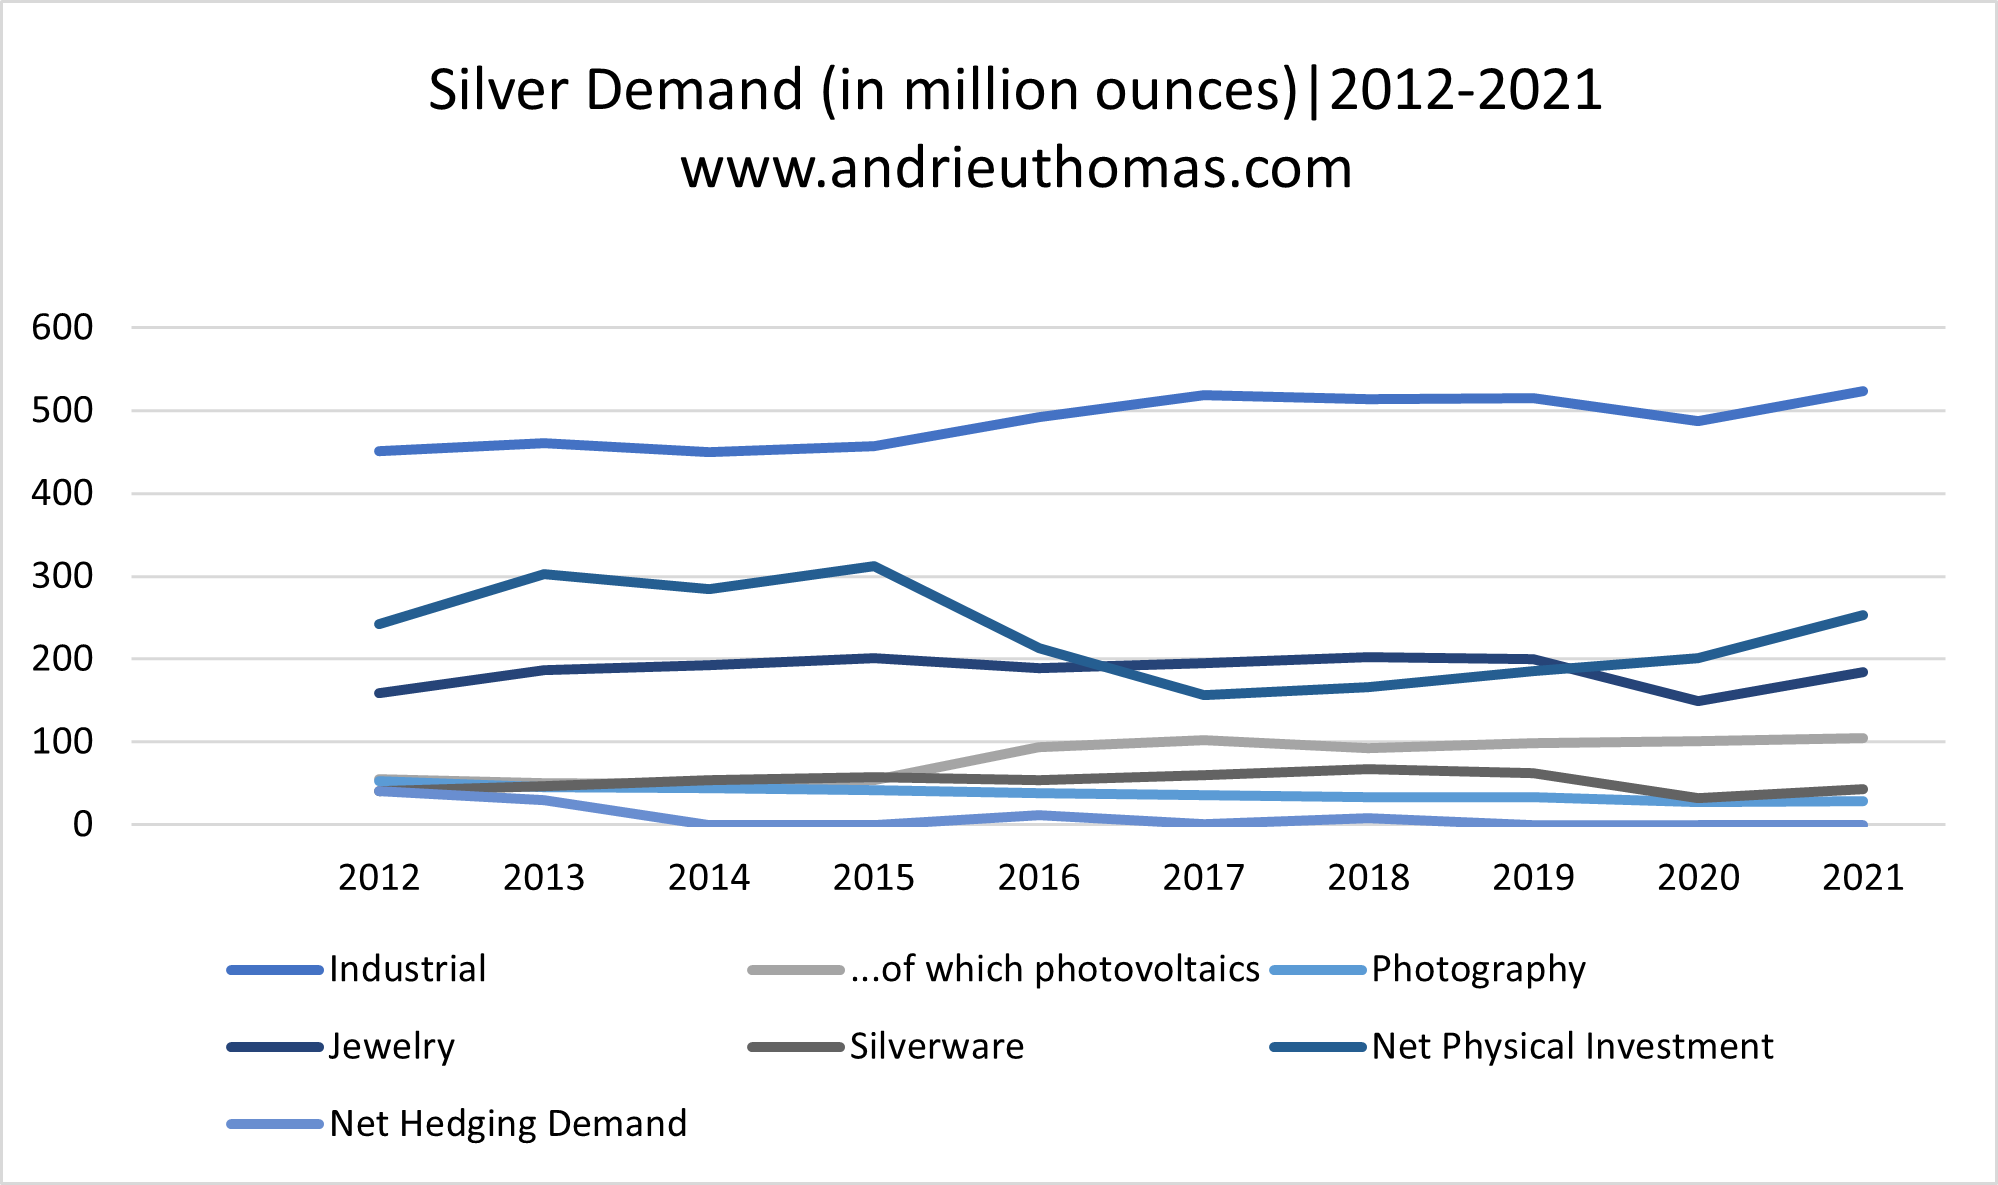
As the chart below shows, silver demand fell by almost 10% in 2020. As for the expectations for a rebound in demand in 2021, they stand at 15%. The drop in demand in 2020 was primarily powered (and this comes as no surprise) by a reduction in industrial demand (-5%) and jewelry (-26%).
The Silver Institute insists that silver ought to be used at the industrial level, for new technologies such as 5G or wireless charging. Industrial demand could thus rise by 8% in 2021, primarily thanks to Asia, which accounts for more than half of the industrial demand.
Moreover, it will be noted that the Shanghai Futures Exchanges has overtaken the activity of the COMEX on silver. The ETPs (Exchange Traded Products) made progress in 2020, taking the market to over 1 billion ounces (31 000 tons). To put that more clearly, the amounts handled on ETPs are as sizeable as the amounts handled annually on the physical market.
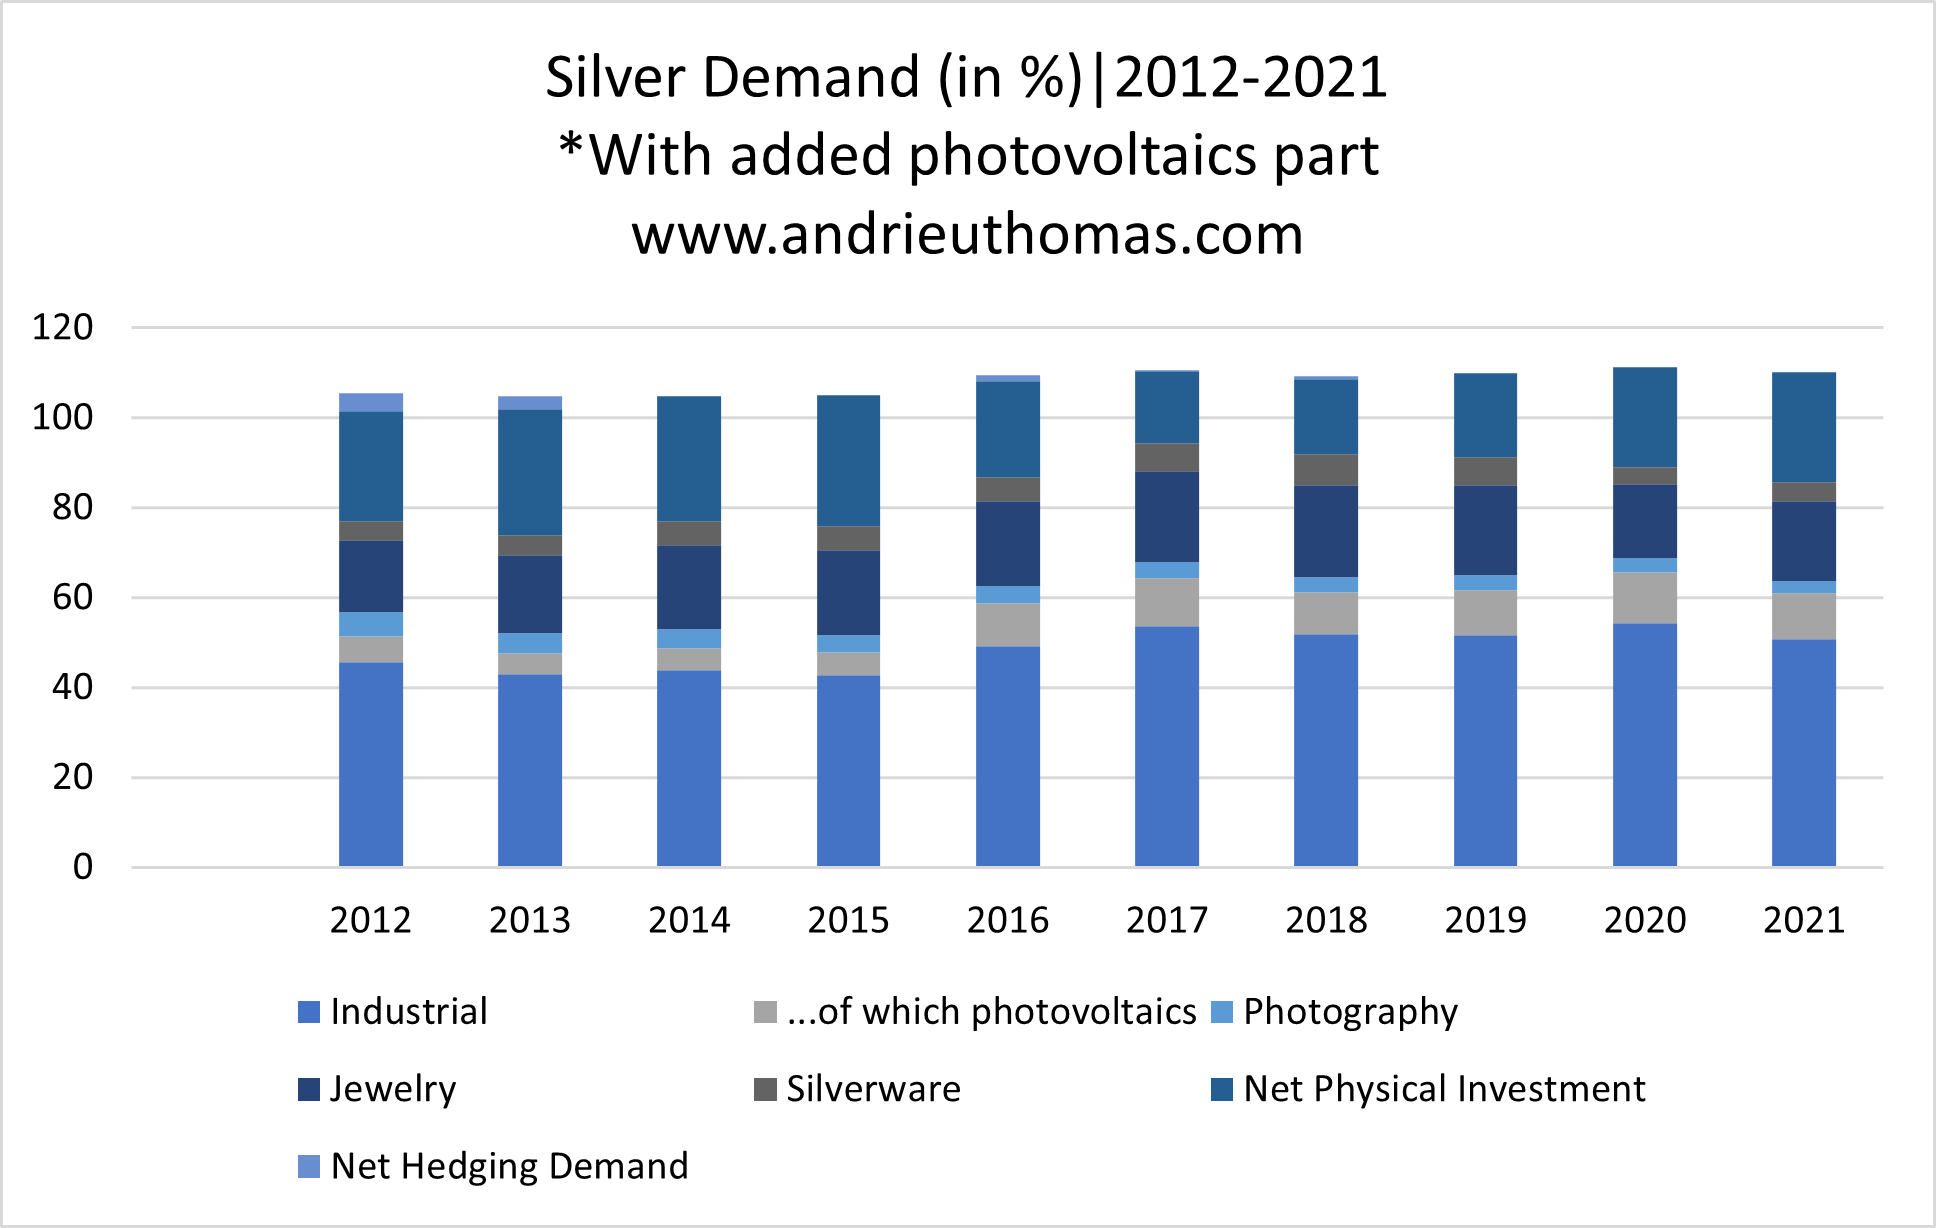
Furthermore, it will be noted that there has been a change in the distribution of demand. The share of industrial demand in the market is continuing to grow. Industrial demand accounted for 45% of demand in 2012, as against 50% in 2020. It will also be important to note the strong progress in the ‘ecological’ demand for silver. Demand for silver for the manufacturing of solar panels accounted for 5% of the total demand in 2012, as against 11% in 2020! That constitutes a considerable change.
For its part, demand from the jewelry sector accounts for almost 17% of total demand, 25% was accounted for by investment demand, and almost 6% was accounted for by the silverware and photography sectors. It will also be noted that the United States accounts for almost 40% of the investment demand (Europe accounts for 27%). In 2020, the reduction in investment demand is essentially accounted for by India (-85% in 2020).
GOLD VS SILVER?
In my book on gold and silver, I pointed out that gold is a metal guided by investment demand, whereas silver is guided by industrial demand. The upshot of this, statistically, is that silver is more volatile, and therefore outperforms gold in periods when a bullish rally is taking place. That, indeed, constitutes the very structure of the market.
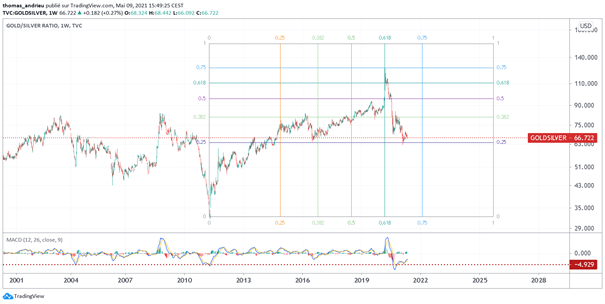
Silver outperformed gold in 2020. As the chart below shows, the Gold/Silver ratio moved from almost 110 in April 2020 to 66 today. That means that the price of silver, in relation to the price of gold, was multiplied by a factor of around 2 in one year. Silver had been under-valued for a number of years.
Silver ought to continue benefiting, on the whole, from a very good trend in its favor for at least a few years. For its part, gold should stay at high levels, resulting in an average revaluation of silver.
Reproduction, in whole or in part, is authorized as long as it includes all the text hyperlinks and a link back to the original source.
The information contained in this article is for information purposes only and does not constitute investment advice or a recommendation to buy or sell.


