According to the Bank of America, for the past year, the central banks have been printing $1.1 billion every hour to be used to buy back assets. Most of these assets are government bonds. In the United States, 57% of federal spending in these past 12 months could not be financed by revenues, and this percentage is constantly increasing. If the country remains on this public deficit trajectory, within 5 years 80% of the functioning of the country will have to make use of borrowing. And why not 100% for that matter? One wonders why the government levies taxes under these conditions!
It is rather natural that, faced with these figures, the holders of the American debt are demanding a little more return for the bonds they are holding. U.S. rates are continuing their dizzying rise. However, it is especially the discrepancy in 2-year to 10-year rates that is experiencing a sharp increase.
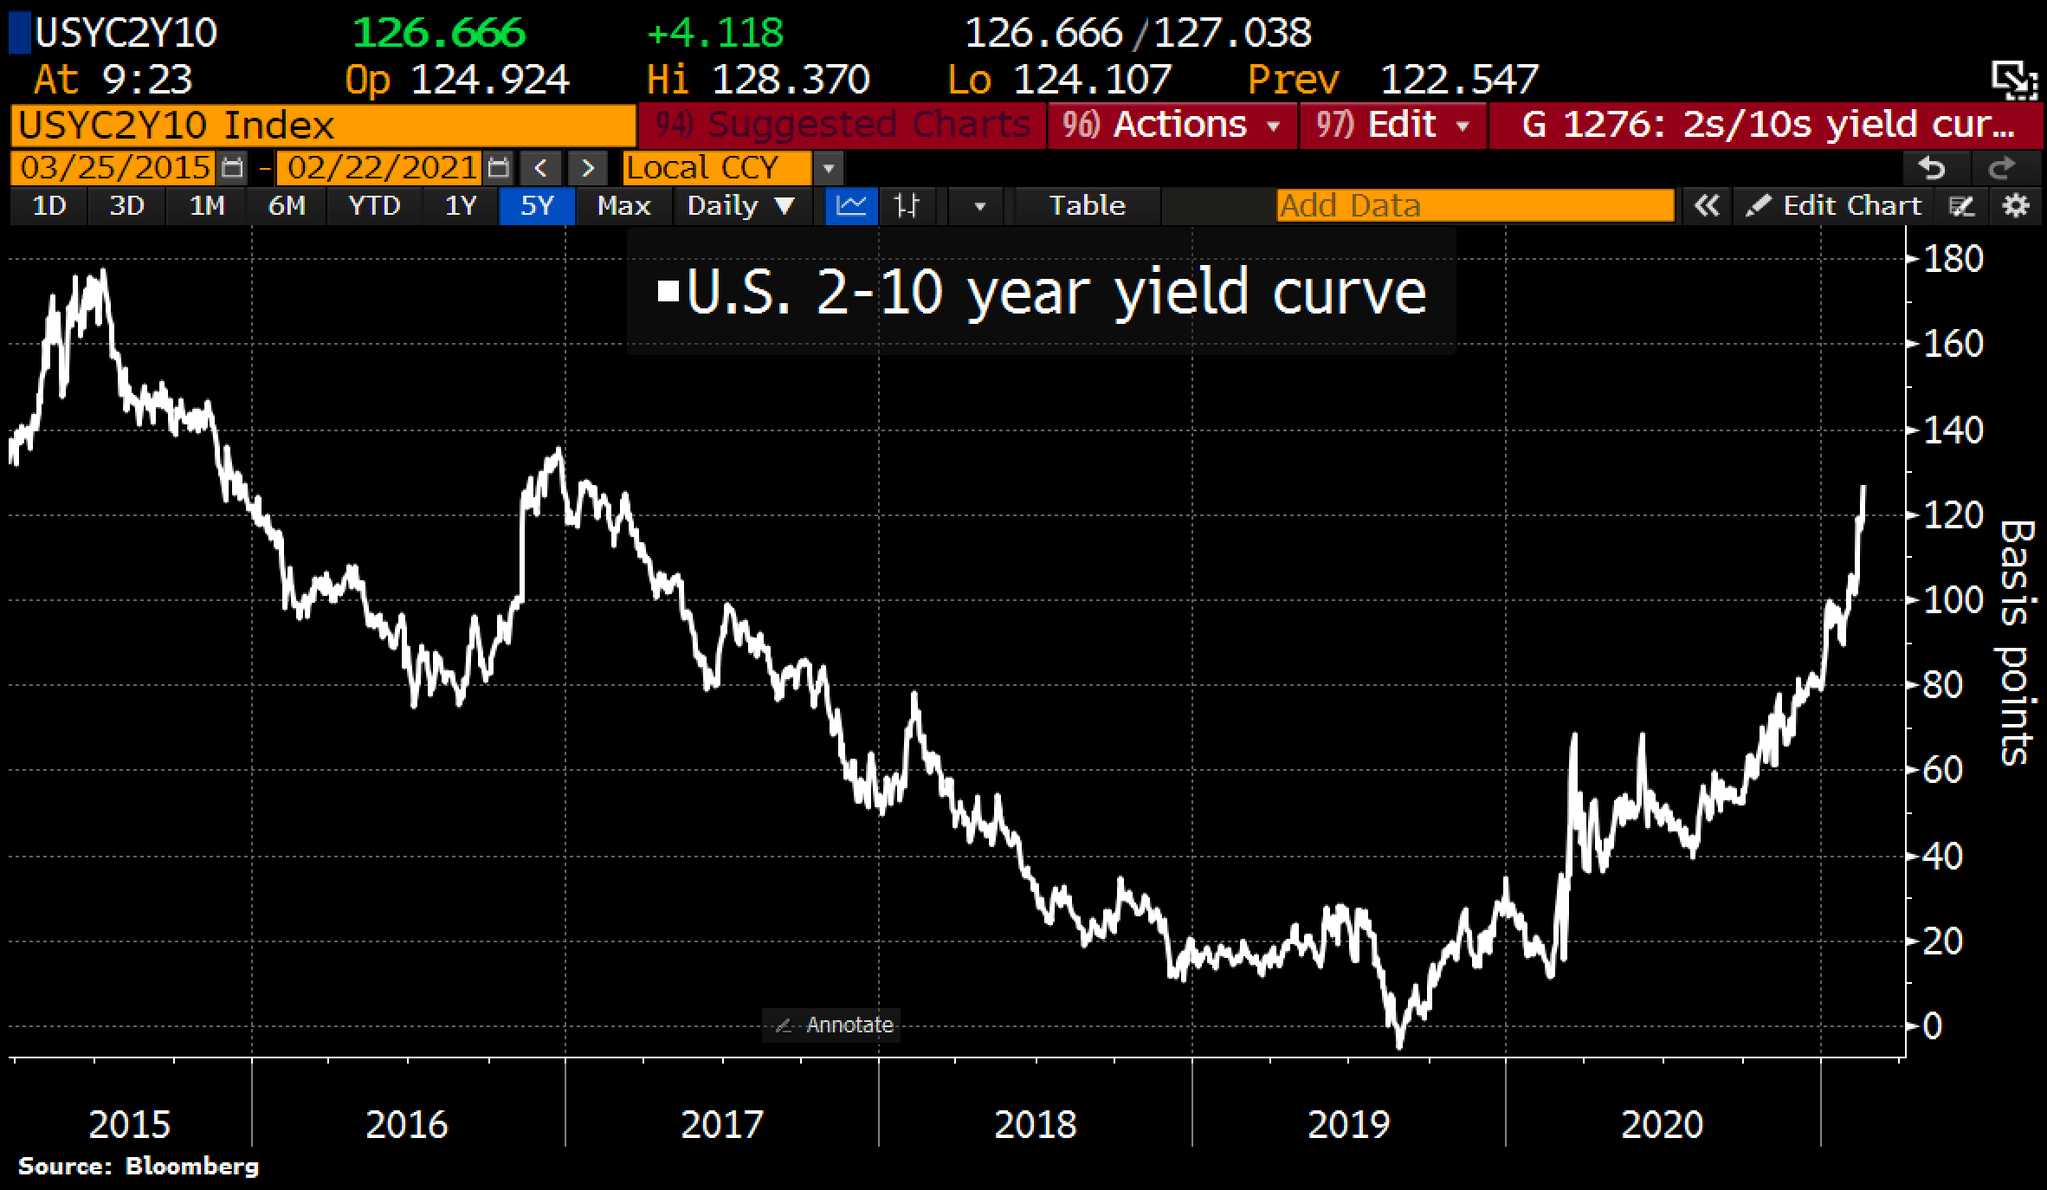
The tension over the 2 Year Treasury Rate is very worrying when you observe the mountain of short-term debts in the United States. How is the country going to be able to repay its debts if the rates continue to increase? This situation is untenable for the country if it persists; the Treasury needs the Fed. And right away. The Fed has already indicated that they are going to take action to control this rate discrepancy; this is the terrain on which the Fed will probably commit themselves at very short term to relieve the markets.
We must act quickly. 30-year real estate rates are going back to over 3% for the first time since last July. The impact of the rate increase also causes a correction of the technological stocks and Asiatic stock markets. The Chinese index has corrected almost 20% this week, almost as much as in March 2020. This morning, very urgently, the Chinese sovereign fund announced buybacks of Chinese shares in order to relieve bear-market pressure.
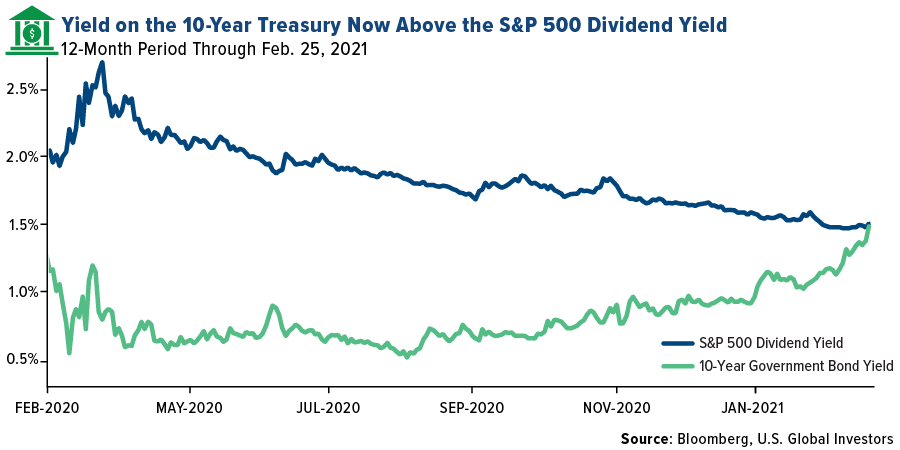
The yield offered by these American stock market securities are moreover currently underperforming the bond yields, this is obviously very bad news for the stock markets:
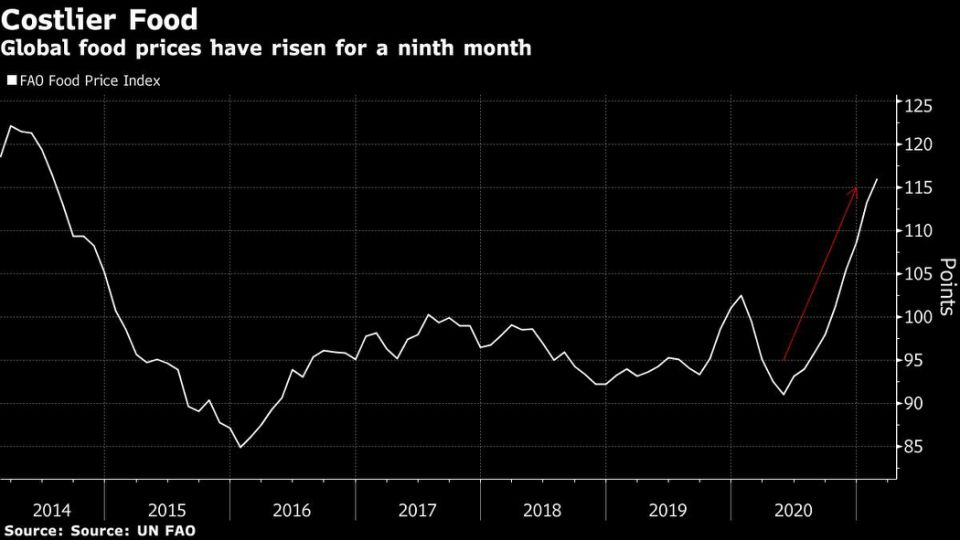
This correction of stock market indices is taking place at a time when inflation of raw materials is spreading to the prices of essential goods such as the price of food, which reached its highest points in 2014:
In Europe, the recession is becoming amplified: in Spain, the unemployment figures literally exploded in February. 4 million people are out of work in the country, that is 16.4% of the population, 900,000 are in furlough, 600,000 independent workers are unemployed. 100,000 businesses have declared bankruptcy in one year in the country, including 13,000 in February alone!
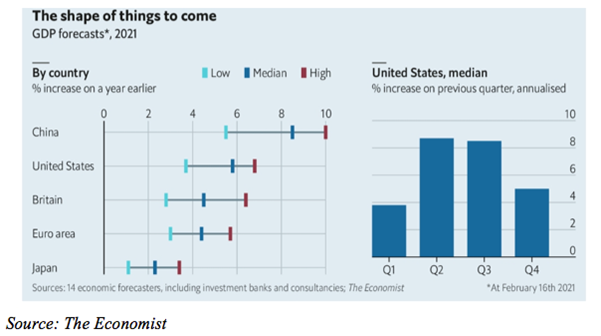
Perspectives for growth are weaker in Europe; the vaccination campaign was not as well managed on the old continent, which will cause an even more sustained intervention of the BCE in the coming months.
The preceding monetary interventions of the central banks anticipated a stock share buyback program whose amount was determined and known in advance. “Quantitative Easings” and other programs that are equivalent to the BCE concerned limited monetary printings. The new volley of intervention will now involve yield curve control.
The movement already started up at the beginning of the month: the Fed has never bought back as many short-term bonds (Treasuries) as in the past week:
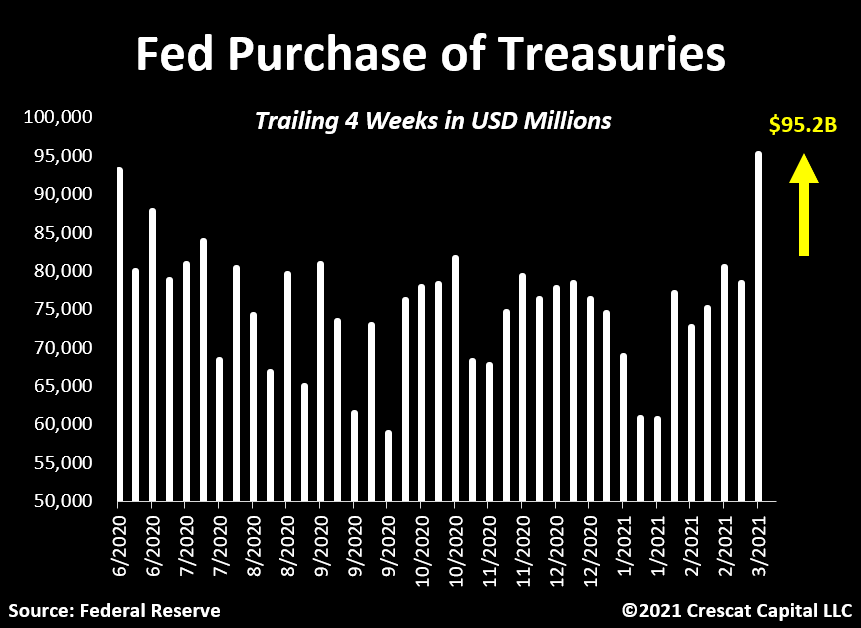
Since last June, 80% of treasury bonds have been “gulped down” by the Fed and these buybacks have accelerated in the past few weeks. In fact, the Fed has already become widely involved in the rate curve control program... In this type of intervention, the amount involved is not defined, it is unlimited. The Bank of Japan has already set up this rates curve control with a surprising result: 65% of the Japanese bonds market was absorbed directly into the BoJ balance sheet. By following this rates curve control “Yield Curve Control” policy, the BoJ has pretty much nationalized the country’s bond market. This type of Fed intervention would totally transform the American bond market. This would obviously be a very favorable situation for gold.
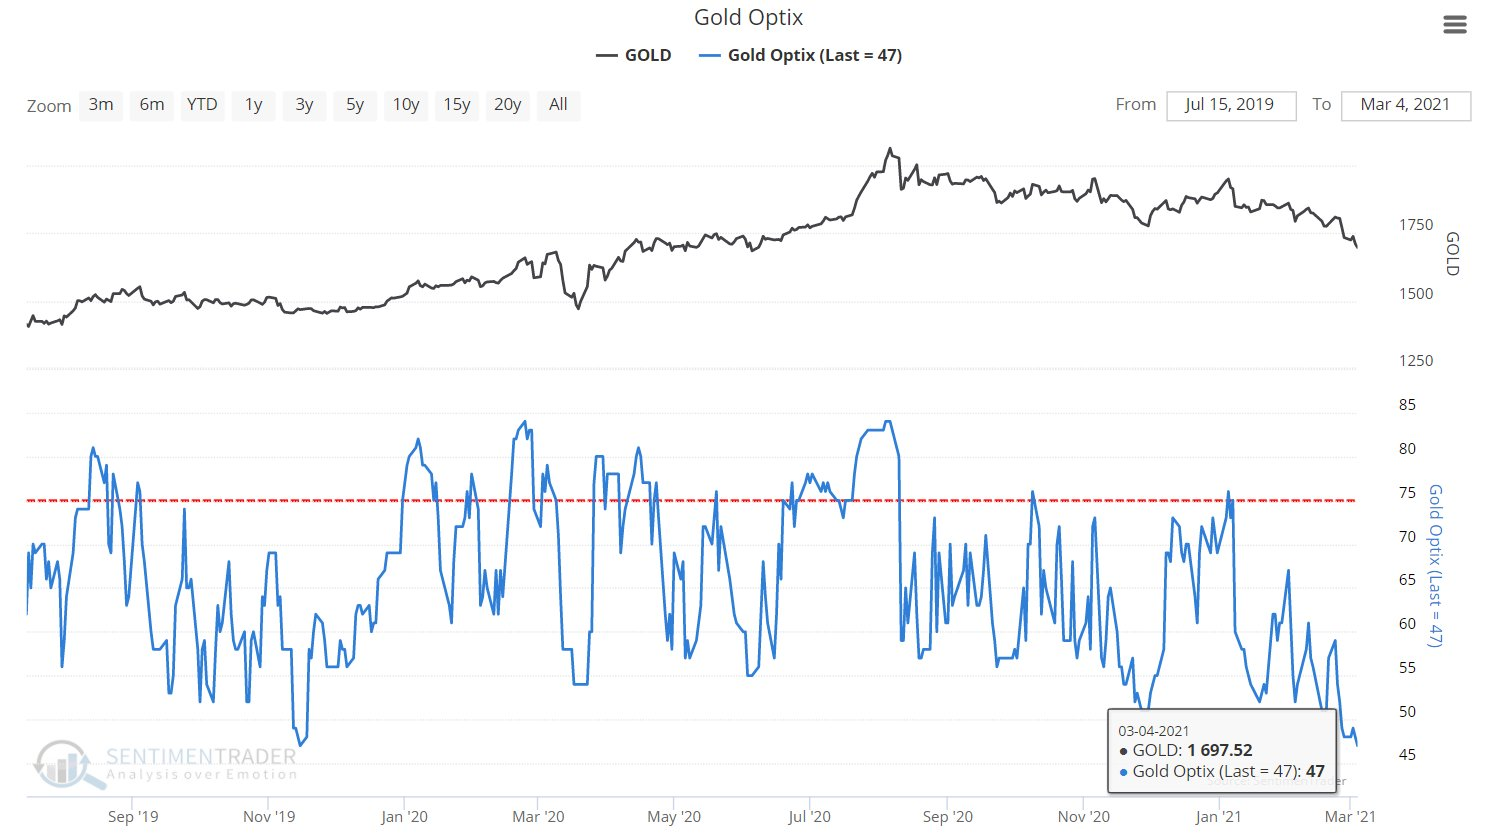
At present, gold is continuing its correction in this context of rising interest rates. Disengagement on gold ETFSs funds continued last week after a record 12 consecutive days of decrease. The last liquidation of these ETFs that was so intense goes back to the correction of December 2016. Sentiment about gold has never been this low in the past 5 years, with the Gold OPTIX index measuring investor optimism on the precious metal security going back down below that of autumn 2019.
Gold has reached a record level of oversale in the past 5 years. Even at the time of the March 2020 correction, gold has never been as oversold as today; the RSI graph is an oversale zone:
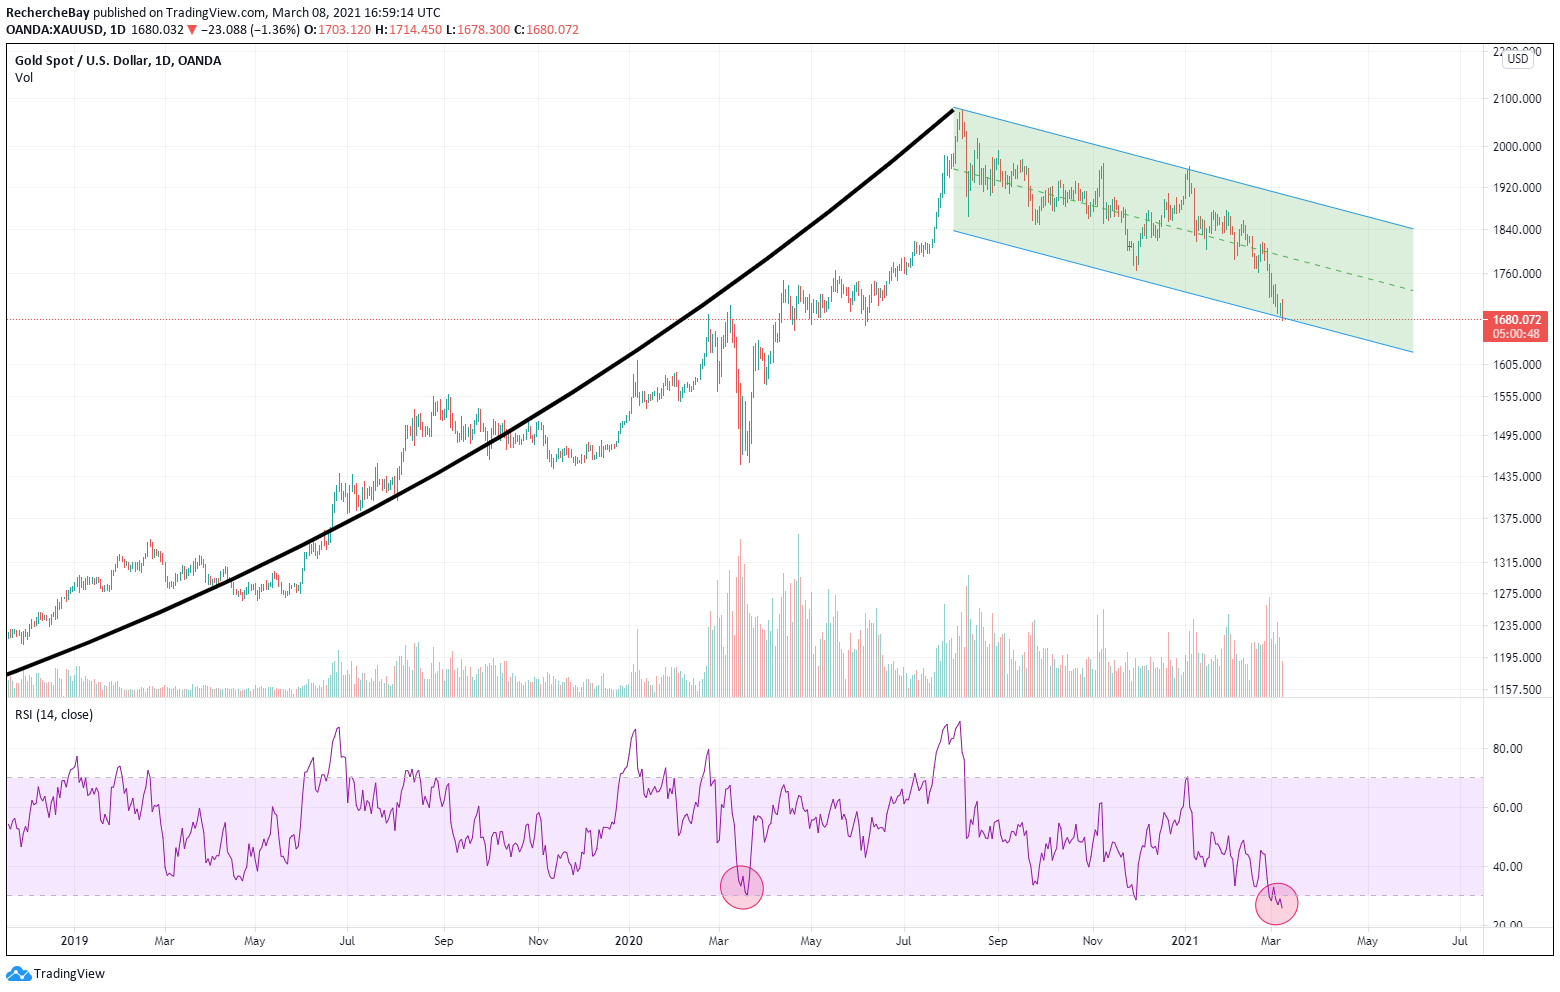
Graphically, gold has never been this far from its 200-day average since 2013. It should be noted that these extreme distances from the MA200 generally anticipate strong rebounds, all the more because this time the MACD is at historically low levels.

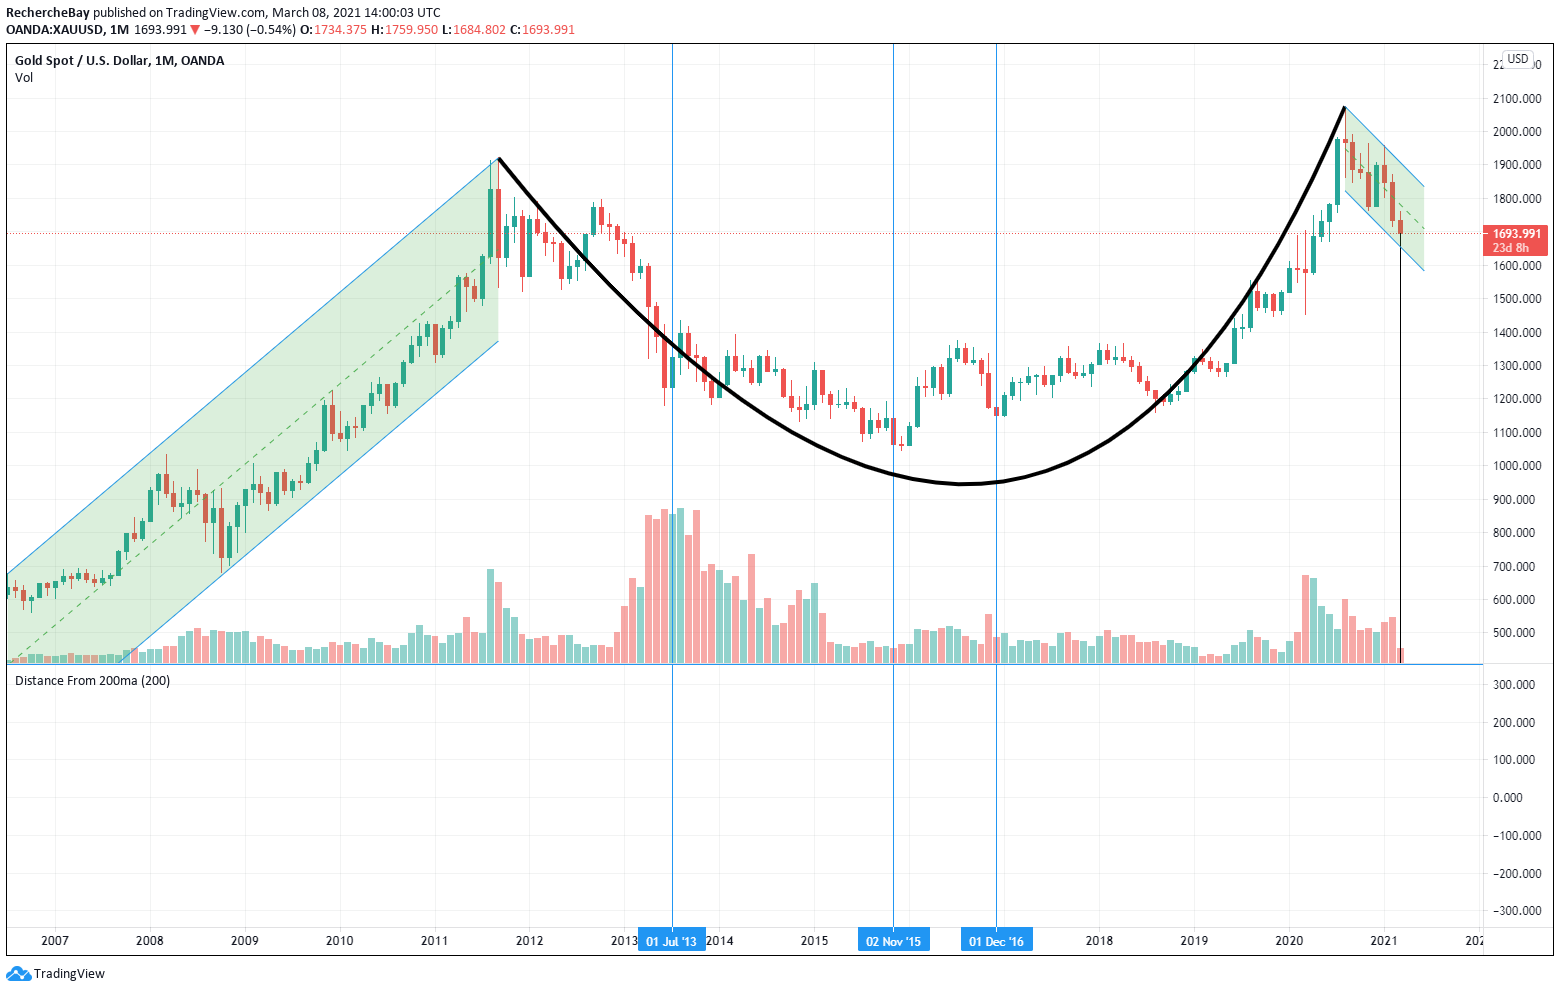
If we take a little distance over this gold chart, we note that precious metal has almost finished tracing an upwards cup handle that started in 2011. The goal of this figure is largely higher than current levels.
We have already talked about this in our previous bulletins; gold price risks are entirely under the control of the “paper” futures market controlled by 8 banks. This strong consolidation took place at the same time as a real rush on physical gold was occurring pretty much everywhere throughout the world. In Australia for example, the month of February was even more intense than January which had already set a record. The Perth Mint delivered a record 125,000 ounces of gold (3.5 tons), 63% more than a year ago in January, and 441% more in February compared to last year! The physical silver market was also exceptional: 1,830,000 ounces delivered (51 tons) after an increase of 57% in January relative to 2020, the increase in February was +202%! Imagine if gold and silver prices were linked to the laws of physical supply and demand... When the market (and I write “when” and not “if”) becomes reconnected to the real mechanism of “price discovery”, the re-balancing of the pricing level may become violent. For the time being, discovery sales on the paper market and algorithms plugged into the rates curve are reaching so far as to lure away speculators from the sector (however it has had no apparent effect on “stackers”, these particular investors who rush onto the physical). If this decorrelation movement continues, we risk having shortages of metal, and physical gold or physical silver will simply not be available any longer for “retail” even with significant premiums.
In the United states, the WallStreetSilver movement now consists of more than 40,000 members, a “CrowdFunding” contribution of several hundred thousand dollars has been launched to finance a poster campaign in all countries:


The objective is to build, in the street, a demand that the banks try to break with their algorithms. Will the effect relayed by social media be enough to reverse opinion in the sector?
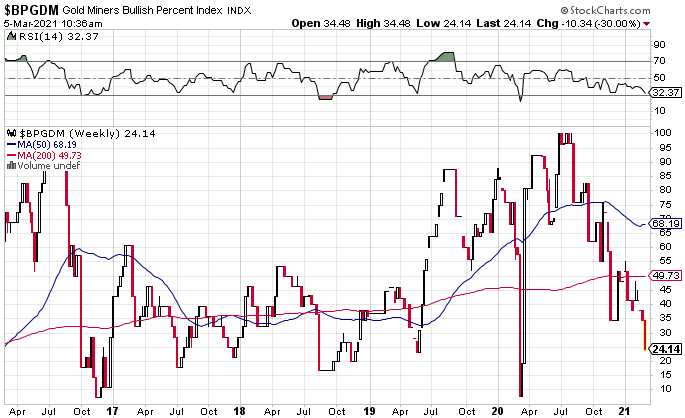
Optimism in the gold mines was in any case also at a floor level. The BPGDM index that measures the attractiveness of the sector is at its lowest since March 2020:
As is often the case, negative sentiment in the sector are drawing new speculative positions downwards about the mines which are profiting from a downwards head-shoulder configuration to enter “short” at the shattering level of lowering the neckline:
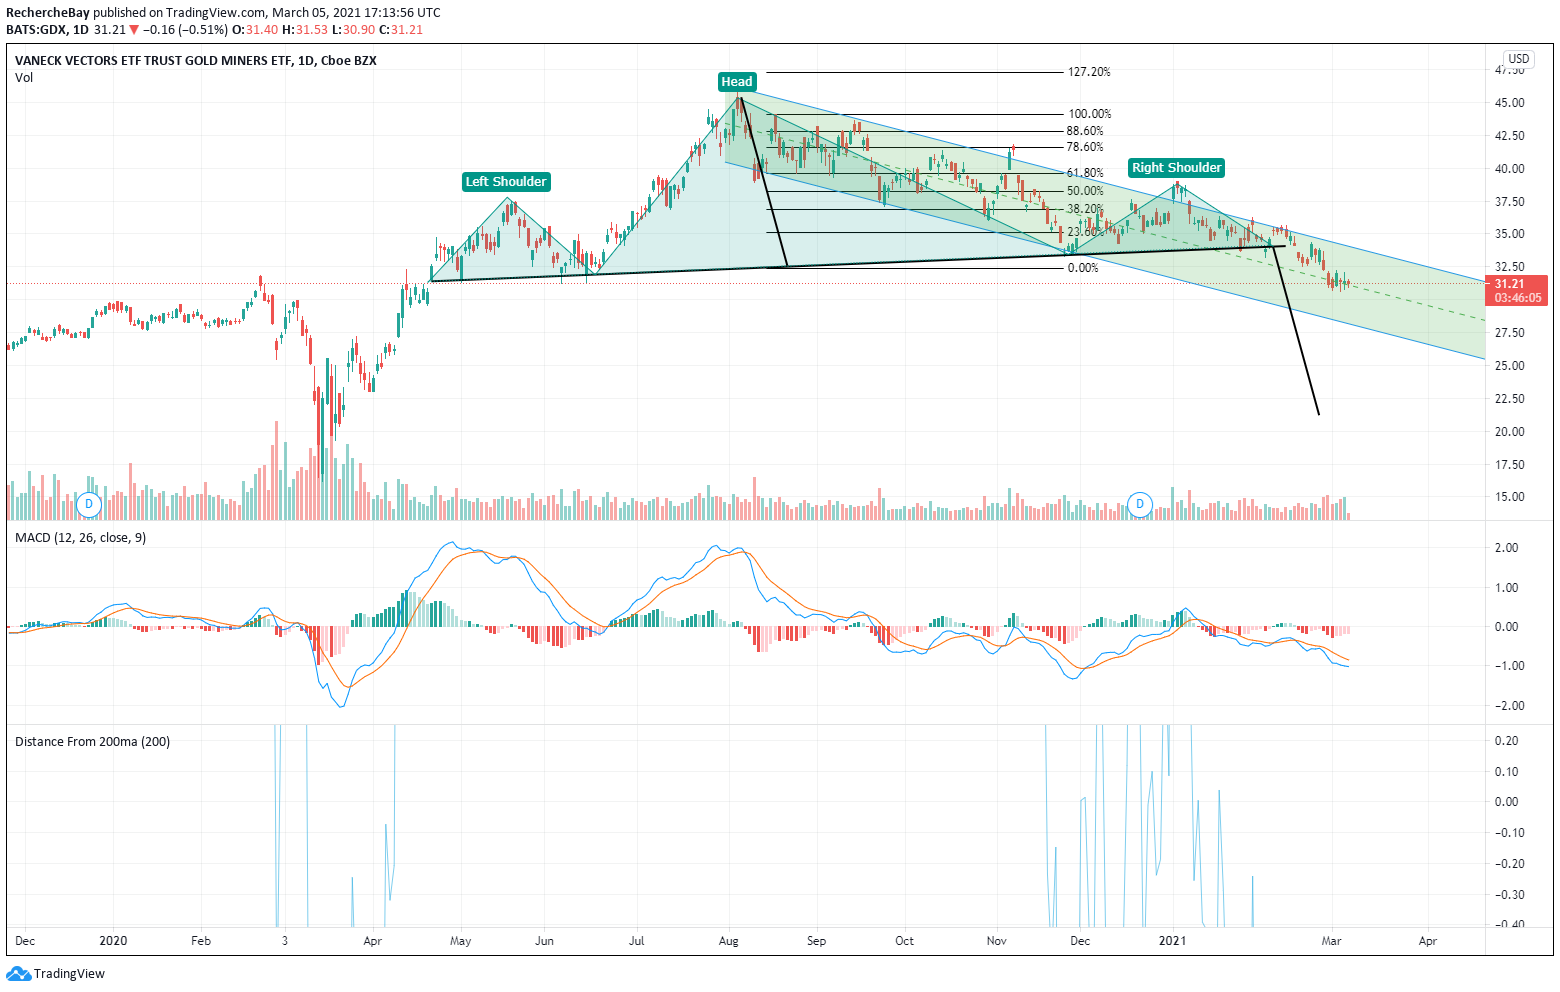
This trading is unfortunately not very productive for these traders due to the solidity of a support that has been tested several times this year. For several days now, gold has gone down, but gold mines have stabilized and have not gone down any further. This is a sign that cannot be mistaken, and which has marked the low points of this sector since 1997. On the other hand, these new sales positions are at risk of transforming into a violent short squeeze, this is how rebound energy traditionally forms on this very specific market of mining companies.

Another interesting factor, the HUI/SPX500 ratio, which measures the relationship between the gold mining index and the index of technology stocks will, for the third consecutive time, find its ultimate floor tested already in 2018 and 2020:

In this gold oversale context, it is highly probable that mines will start overperforming technology stocks in the upcoming weeks.
The productive mines we are positioned on have held up rather well in this last side of the gold drop.
From now on, this is the moment to look at the juniors who have resisted the impact; these are going to be the first ones to accompany the recovery.
Original source: Recherche Bay
Reproduction, in whole or in part, is authorized as long as it includes all the text hyperlinks and a link back to the original source.
The information contained in this article is for information purposes only and does not constitute investment advice or a recommendation to buy or sell.


