This article will look at a complex property of the gold market: temporality... Sometimes the price of gold will stagnate for more than a decade, while at other times it will be formidably bullish. Even so, gold remains an asset that is more difficult to determine by precise financial cycles. But a 16-year cycle may have been brewing for more than half a century...
The study shows that one dollar invested at the start of each 16-year gold cycle is worth $5.20 at the peak of the cycle, i.e. eleven to twelve years later. At the end of the downtrend, a dollar invested sixteen years earlier is worth an average of $2.70.
Gold prices over the last century
The history of the price of gold (expressed in dollars, to say the least) can be broken down into two periods. The first period extends from the beginning of the twentieth century, for the data available, to 1971, the date of the collapse of the gold standard. This first period was characterized by the existence of a government-fixed gold price: the gold standard. The existence of a government-fixed rate did not, however, prevent currency devaluations (i.e., increases in the price of gold). The last major devaluation of the dollar under a gold standard was in 1934, when the government raised the price of gold from $20.67 to $35 per ounce. In effect, for the same quantity of gold in reserve, the only way to increase the money supply is to increase the price of gold... This episode was also accompanied by a failed gold confiscation.
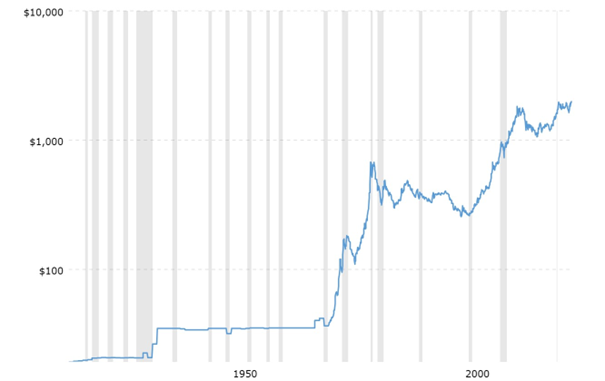
Consequently, the second study period runs from 1971 to the present day. This second period for the gold price is characterized by free price fixing and the existence of a market independent of international trade and governments. However, a similar pattern can be observed in the price of gold. After stagnating for several decades in some cases, the price of gold has steadily followed a strong upward trend for around ten years. But it is more likely that the end of the gold standard in 1971 gradually gave rise to a more linear long-term trend for the yellow metal.
Thus, the major periods of rising gold prices since 1971 have been 1971-1981, then 2001-2011. Conversely, the periods of stagnation, or even decline, have been 1981-2001, then 2011-2016. It is therefore understandable that gold's cyclicality tends to evolve more than many other assets, due to the fact that for several decades gold has incorporated the poor adjustments provided by the gold standard.
Trend-adjusted price of gold
The end of the gold standard can be seen as good news for gold investors. Individuals are now free to allocate their own gold, and the government no longer has any say in the matter. Of course, the collective and monetary consequences are quite different. In any case, we can see that the departure from the gold standard tends to generate a linear trend in the price of gold.
The first step in our reasoning is therefore to correct the evolution of the gold price since 2000 by its linear trend. We obtain the chart below. A gold price adjusted below the 0 line means that the gold price is below its long-term trend. Conversely, an adjusted gold price above the 0 line means that gold is above its long-term uptrend line.
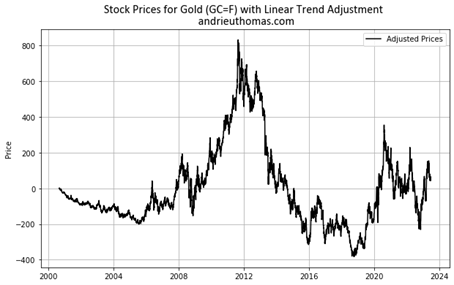
Here we can clearly see that the "real" bullish phase was observed between 2005 and 2012, while the "real" bearish phase was observed between 2012 and 2019. So, a priori, we're dealing with a first cycle of around 14 to 15 years, acting around the uptrend line. By mid-2023, gold will be very close to its uptrend line.
A sixteen-year cycle?
A major clue to a possible cycle is given by low points. The second-last major low in the gold price was around the end of 1999 and early 2000. The last major low was recorded in early 2016. If we go back sixteen years, we find the major low of 1984 / 1985, which put an end to the bear market begun in 1980. If we go back another sixteen years, we find 1968, which corresponds to the start of the impressive bull market that began in 1980. What's more, 1968 corresponds to the start of the upward pressure on the gold price that had gradually led to the decision to leave the gold standard.
What's remarkable, in the three major cycles we've cited (with three lows), is that the major peak takes effect eleven to twelve years after the low (1980, relatively 1996, then 2011/2012). We're therefore dealing with upwardly-biased cycles (the peak takes effect beyond halfway through the 8-year cycle). An ideal gold price cycle so far would therefore be sixteen years, with twelve years of upside and four years of downside.
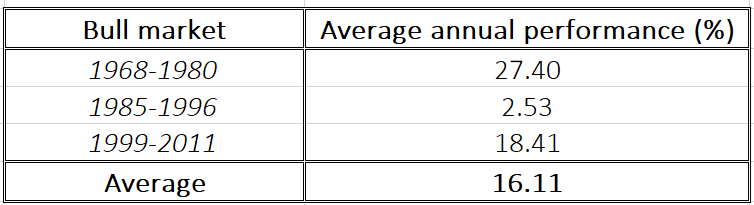
For a very precise analysis, we have calculated the average annual performance of each of the bull market phases over the last three available cycles. Gold performed on average +27.4% per year between 1968 and 1980, then +2.53% per year between 1985 and 1996, and finally +18.4% per year between 1999 and 2011. This gives an average annual rise of +16.1% in the bullish phases of the gold cycle. Consequently, the average annual bearish performance over the remaining four years of the cycle is around -14.7%. The ideal gold cycle is summarized in the chart below, together with the actual performance observed.
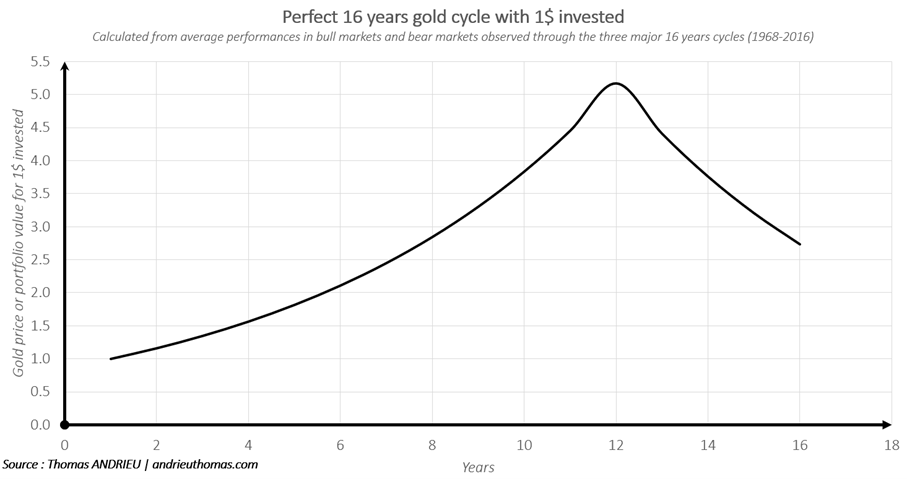
One dollar invested at the start of each 16-year gold cycle is worth $5.20 at the top of the cycle, i.e. eleven to twelve years later. At the end of the downtrend, a dollar invested sixteen years earlier is worth an average of $2.70. These statistics are therefore real, and relate to gold's last three major 16-year cycles. They give a close enough picture of gold's actual behavior to date.
Strong statistical consistency
Our previous article led us to the conclusion that the price of gold was stable over the long term. In other words, gold's dependence on time patterns (fractals) was relatively low. Basically, gold does not behave attractively in the short term, and major cycles only appear after a very long time. An 8-year cycle, for example, although present, is not sufficient to correctly describe gold's evolution. A detailed mathematical study can therefore help us confirm the theory of a 16-year cycle.
A mathematical study of the gold price between 2000 and 2023 clearly confirms our analysis. It shows that gold's major cycle is 15.7 years, which is close enough to sixteen years. Of course, these periods are subject to what is known in finance as cycle "variability". But we can clearly see that a cycle close to sixteen years has an impact on the gold price. The other major cycles have durations of 7.8 years (50% of the 16-year cycle), then 5.2 years (33%), and finally 3.9 years (25%). This study also allows us to observe the "famous" 8-year cycle (7.8 years) coveted by social networks, but whose structure is in reality only one component of the 16-year cycle.
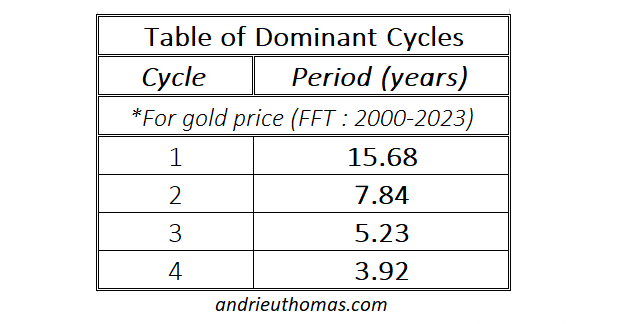
As a technical aside, the duration of these cycles was highlighted using a discrete Fourier transform. However, as the latter does not in itself provide the dominant cycles, we used a bandpass filter. Clearly, we are sufficiently assured of the mathematical relevance of these cycles on the price of gold.
Gold's volatility hits a new low
Gold's volatility is another factor in its behavior. Gold's annualized volatility between 2000 and 2003 was around 16%. This is a relatively low level of volatility, but it is not insignificant, and can explain major upward or downward movements. Volatility measures the speed with which the market changes. A high level of volatility will translate into significant variations in the gold price. Note that volatility lows generally coincide with major lows in the gold price. In other words, a rising gold price can translate into a more unstable gold price. Note that gold volatility above 20% is clearly abnormal.
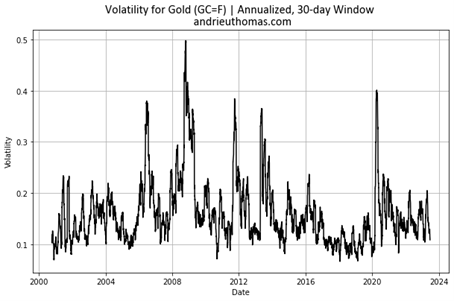
By mid-2023, gold's volatility had been relatively low. The last major peak in volatility was observed in 2020 with the COVID crash. As a result, the study of volatility enables us to judge the upside (or downside) potential of an asset. Low volatility in an ascending phase of the cycle will tend to reduce bullish performance.
Therefore, if we consider an 8-year cycle, with 4-year rises and 4-year falls, then the rise observed from 2016 to 2020 would naturally be followed by stagnation from 2020 to around 2024. This corresponds to the volatility trend observed. A resurgence in volatility could therefore occur from 2024 onwards, the likelihood of which is reinforced by the simple fact that gold's volatility very rarely falls below 10%.
In conclusion
The conclusion of our article is popularized by the following statistical observation... $1 invested at the start of each 16-year gold cycle is worth $5.20 at the top of the cycle, i.e. eleven to twelve years later. At the end of the downtrend, $1 invested sixteen years earlier is worth an average of $2.70. Of course, gold's performance in each cycle is very different, and this observation is based on statistics studied between 1968 and 2016. Nevertheless, the temporality of gold's trends becomes sufficiently explicit with a 16-year cycle.
More precisely, gold prices have followed three major 16-year cycles since 1968. The major lows observed would therefore have been 1968, 1984/1985, 1999/2000 and 2016. The structure of the 16-year cycle is confirmed not only by the statistics, but also by the dates of the major peaks. Gold prices follow an upward trend for eleven to twelve years on average, before correcting for four years. This is all the more consistent given that the 8-year cycle is a component of the 16-year cycle. More precisely, the mathematical study shows, for data between 2000 and 2023, cycles of 15.7 years, 7.8 years, 5.2 years and 3.9 years.
Finally, the current weakness of gold's volatility, and the relative stagnation of the price since the end of 2020, leads us to believe that gold is still respecting its long-term cycle. But that's a different analysis, and what we've shown here represents an important step forward. In fact, there are no obvious short- or medium-term cycles in gold.
Reproduction, in whole or in part, is authorized as long as it includes all the text hyperlinks and a link back to the original source.
The information contained in this article is for information purposes only and does not constitute investment advice or a recommendation to buy or sell.


