In our previous articles, we developed an exclusive approach to the evolution of gold over time. Ever since the gold market was liberalized, we have witnessed the recurrence of regular movements on the gold price. The relatively sizable historic decline of the gold price makes it possible to draw detailed conclusions about the regular phases of evolution of the price of gold. In this article, we take a look at an exclusive approach to the cyclical nature of gold, the major phases of growth since the 1970s, and, lastly, a comparison with the current price. 2022 should thus mark gold’s entry into a new cycle phase.
THE CYCLICAL NATURE OF GOLD
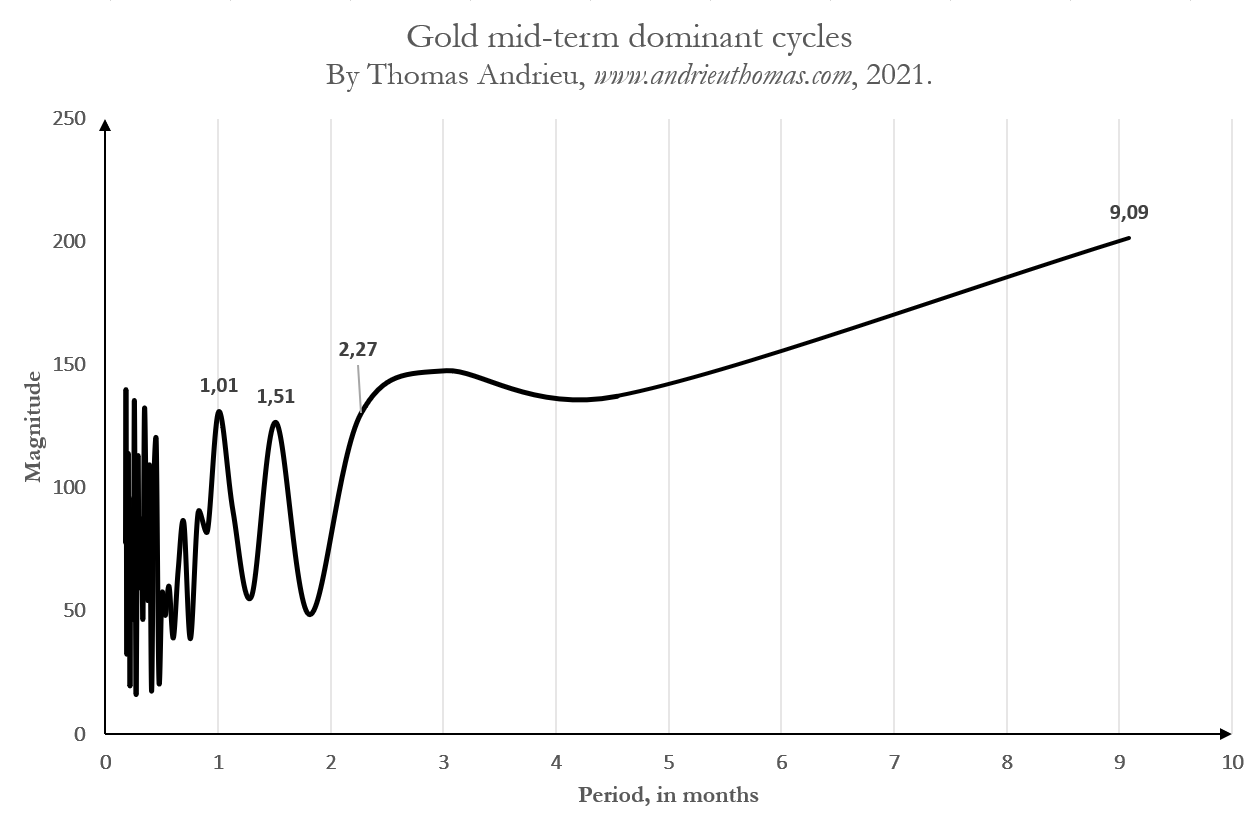
Although we are not going to get into the implications of this calculation here - either in the conclusions or in the resulting forecasts - we can identify a cycle that lasts 9 years. In fact, if we repeat 12 cycles of 9 months, we obtain a longer cycle of 9 years of evolution in the price of gold. This cycle is relatively telling. It enables us to create a first visual breakdown of the gold price since the end of the 1960s.
THE DIFFERENT PHASES OF ACCUMULATION OF THE PRICE OF GOLD
We use below the price of gold since 1968, expressed in dollars. On the basis of our previous observation, we can break this price history down into regular phases of 9.1 years: 1968-1977, 1977-1986, 1986-1995, 1995-2004, 2004-2013, 2013-2022. To facilitate the comparison over time, we have represented the price in each period by means of an index (initialized at 100). The chart below enables us to compare the various 9-year periods since 1968 and see the relevance of the comparison between them.
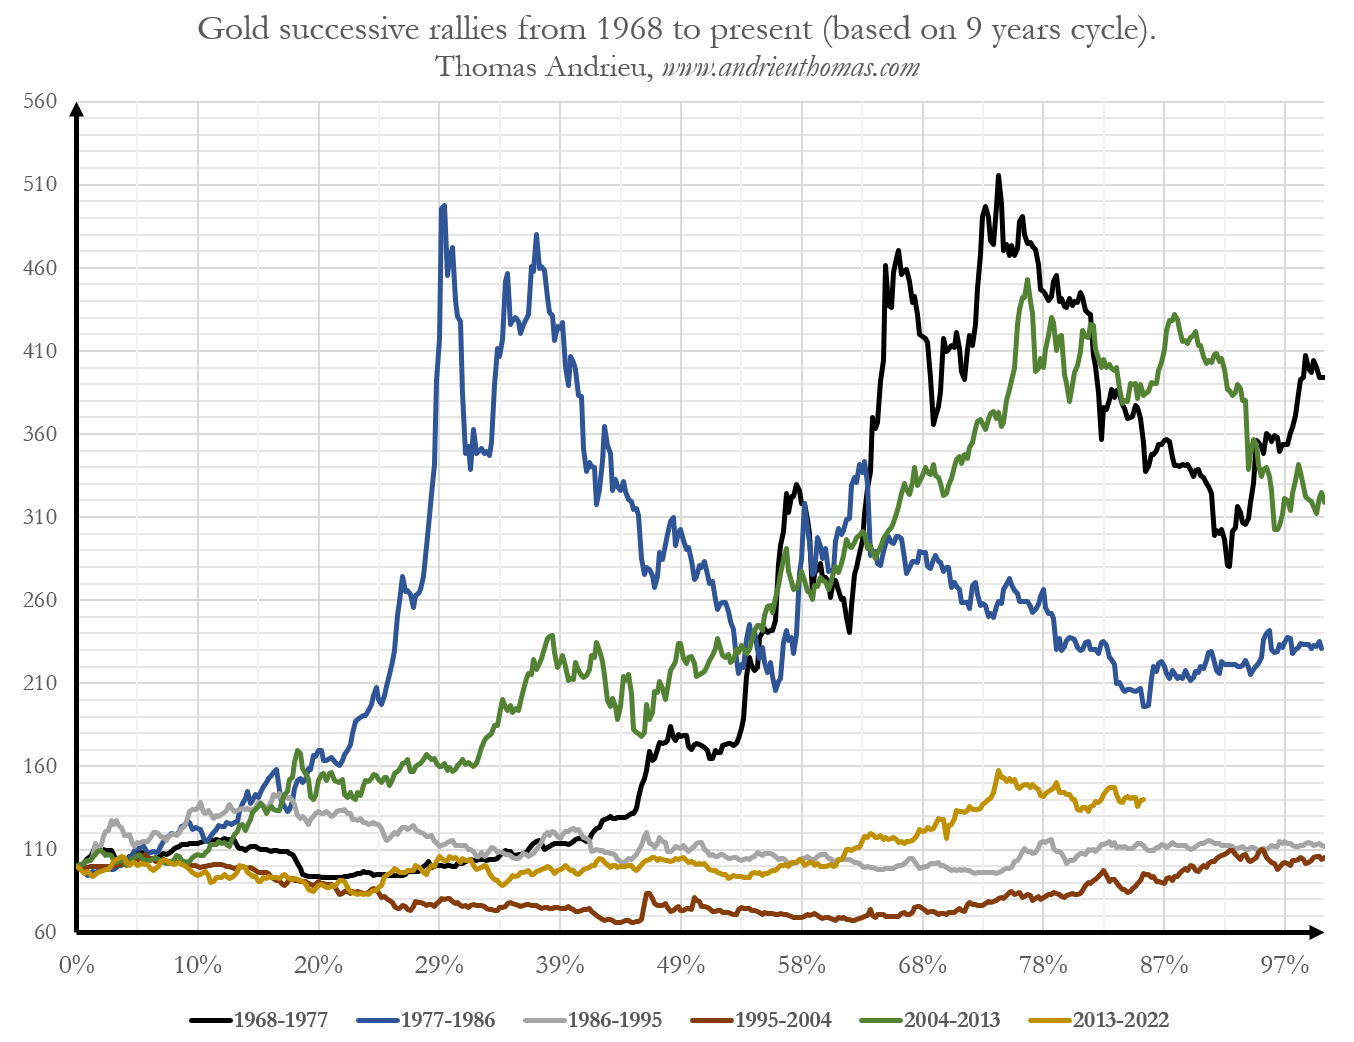
Which ones constituted the largest phases of increase in the gold price? The two biggest ones were 1968-1977, followed by 2004-2013. If we consider our breakdown alone (which is arbitrary as far as the start date is concerned), the biggest performance recorded over 9 years is a rise of +400%. Readers will note that each major phase of over-performance by the gold price is followed by several waves of under-performance, as was the case between 1986 and 1995 and also 1995 and 2004. The other observation is that gold has always been profitable over these 9-year periods. When gold is not going up, it’s because it is remaining stable. That is what explains the success of gold over time.
TOWARDS A NEW PHASE IN 2022
To simplify matters for the reader and gain a more detailed understanding of the likely upcoming movements, we are taking the average of all the previous phases, a figure that we are representing in the form of an index. The chart below allows us to compare the average evolution of the 9-year cycle with the cycle that has been under way since 2013. The first thing to note is that the gold price is currently tending to under-perform in relation to the average of the most recent phases. The second observation is that there is a powerful symmetry between what happened in the past and the movements we are seeing today. Our cyclical evolution index even shows the recurrence of the three peaks (at the level of 75% and 85% of the cycle), the same technical figures that we have been trying to overhaul since the peak reached in August 2020. Numerous similar comparisons can be made between gold’s recent evolution and its historic evolution.
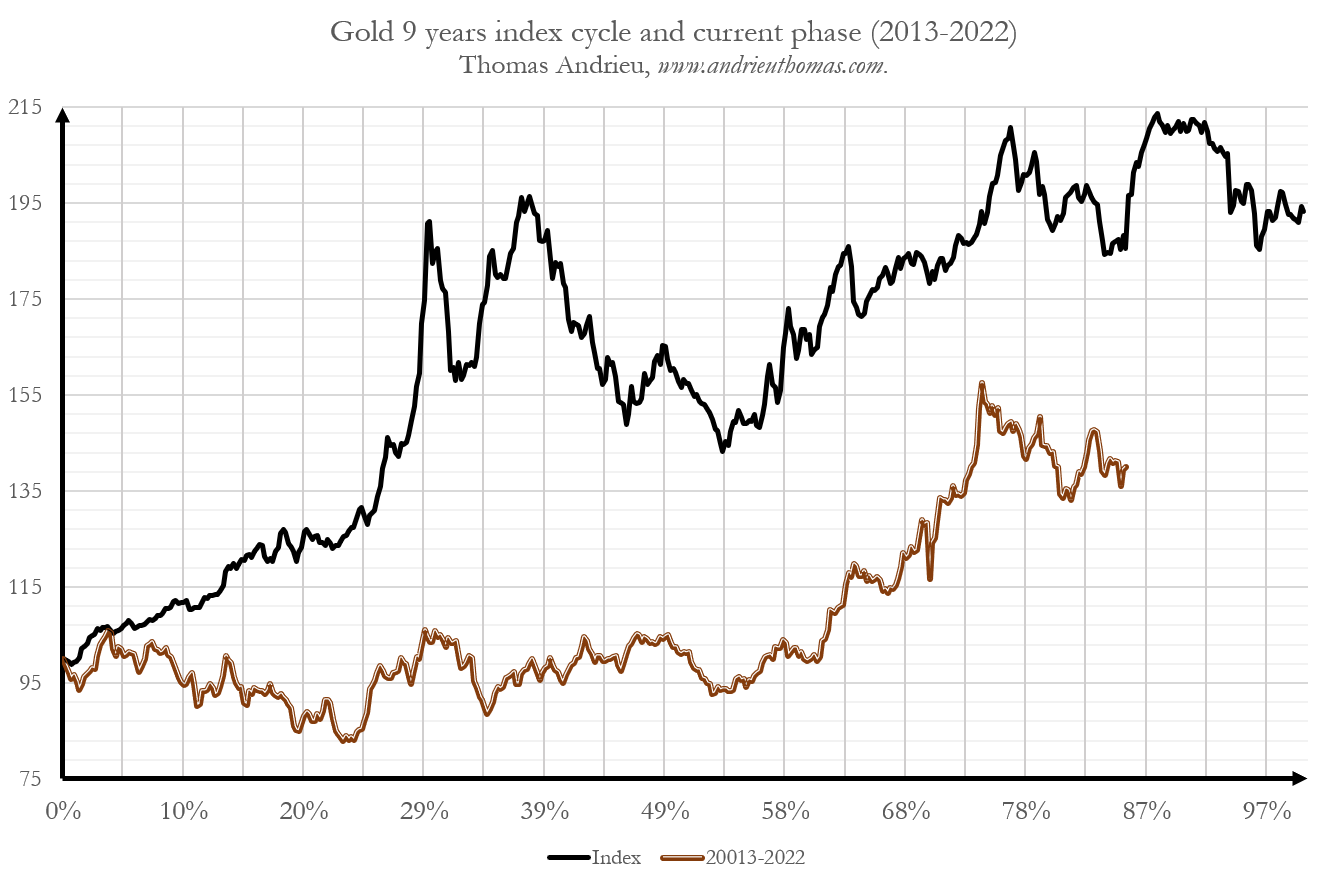
It will be noted that this cyclical index shows us the recurrence of various periods within the 9-year cycle. Firstly, between the start and the first fifth of the cycle (20%), the gold price has a tendency to rise slightly or indeed to stagnate. Secondly, between the 20% and 40% marks within the 9-year cycle, gold tends to undergo an accelerated rise in price. Thirdly, between 40% and 55%, the gold price tends to undergo a fairly strong correction. Next, between 55% and 80% of the cycle, the gold price follows a fairly well-defined upward line of trend. Finally, over the remaining 20% of the cycle, i.e. the period awaiting us between now and the end of 2022, the gold price has an overall tendency to stagnate, despite some big movements in price from time to time.
What can we expect to happen to the gold price then, ideally, in 2022? If we refer solely to the information that is provided to us by the modeling of the past prices, one could imagine the gold price remaining stable, overall, between now and the end of 2022. In a previous article, we insisted that the volatility study enabled us to predict, with a more than 2 in 3 chance, a gold price of between $1530 and $1980 per ounce between now and the fall of 2022. As I explain in my book "l’or et l’argent", the price of gold will undergo some powerful fundamental readjustments in 2022. As such, a new 9-year phase will be initiated as regards the evolution of the gold price, even if no new phase of acceleration is to be expected until 3 years from now (2024-2025), a scenario that would be in accordance with the economic and monetary cycles.
Reproduction, in whole or in part, is authorized as long as it includes all the text hyperlinks and a link back to the original source.
The information contained in this article is for information purposes only and does not constitute investment advice or a recommendation to buy or sell.


