Let us begin this new article with a few chart analysis points relating to the gold and silver mining stocks market, one that we regularly follow in these articles.
Most analysts in the mining stocks sector are announcing a correction to the sector that would coincide with the continuation of the general correction of the markets. If the level of $28 on GDX had been breached, the bullish support line would thereby have been broken through, and the target of the harmonic pattern sketched last December would have been reached by the start of February, at around $26. Needless to say, if this scenario plays out, it will be an excellent entry point for compiling a portfolio of mining stocks.
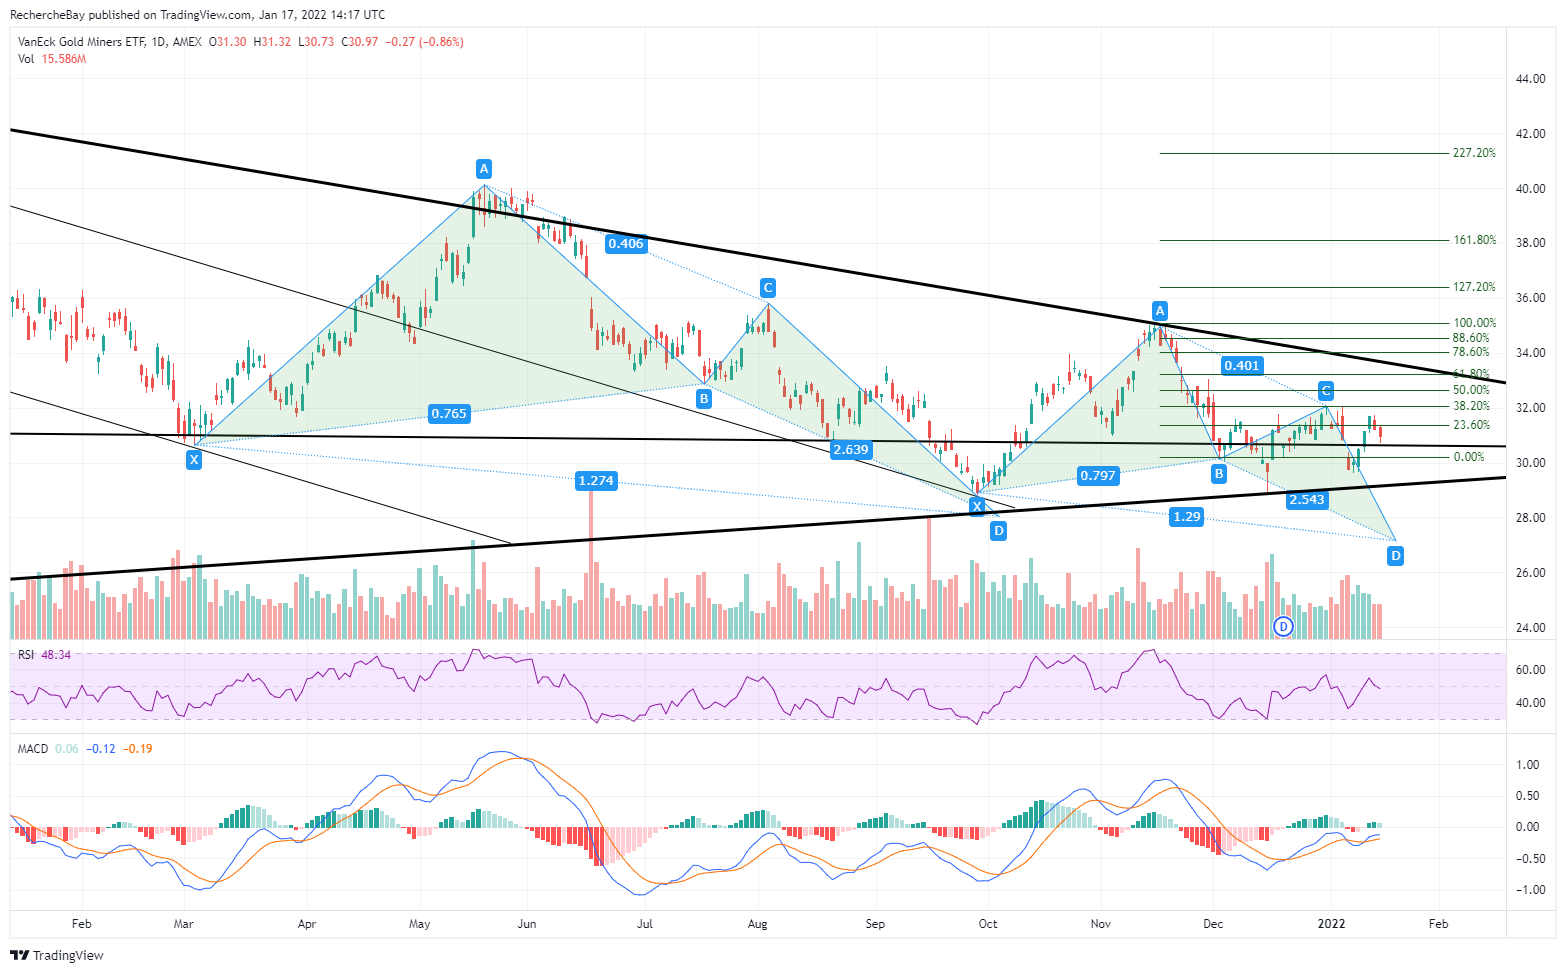
There is a problem with this scenario: the mining stocks index in relation to gold is on its bearish resistance line and has not broken this resistance line since the start of the sanitary crisis.
The mining stocks are certainly undergoing a correction, as is the case for the market as a whole, but this correction is limited for the time being in relation to the relative resistance of gold.
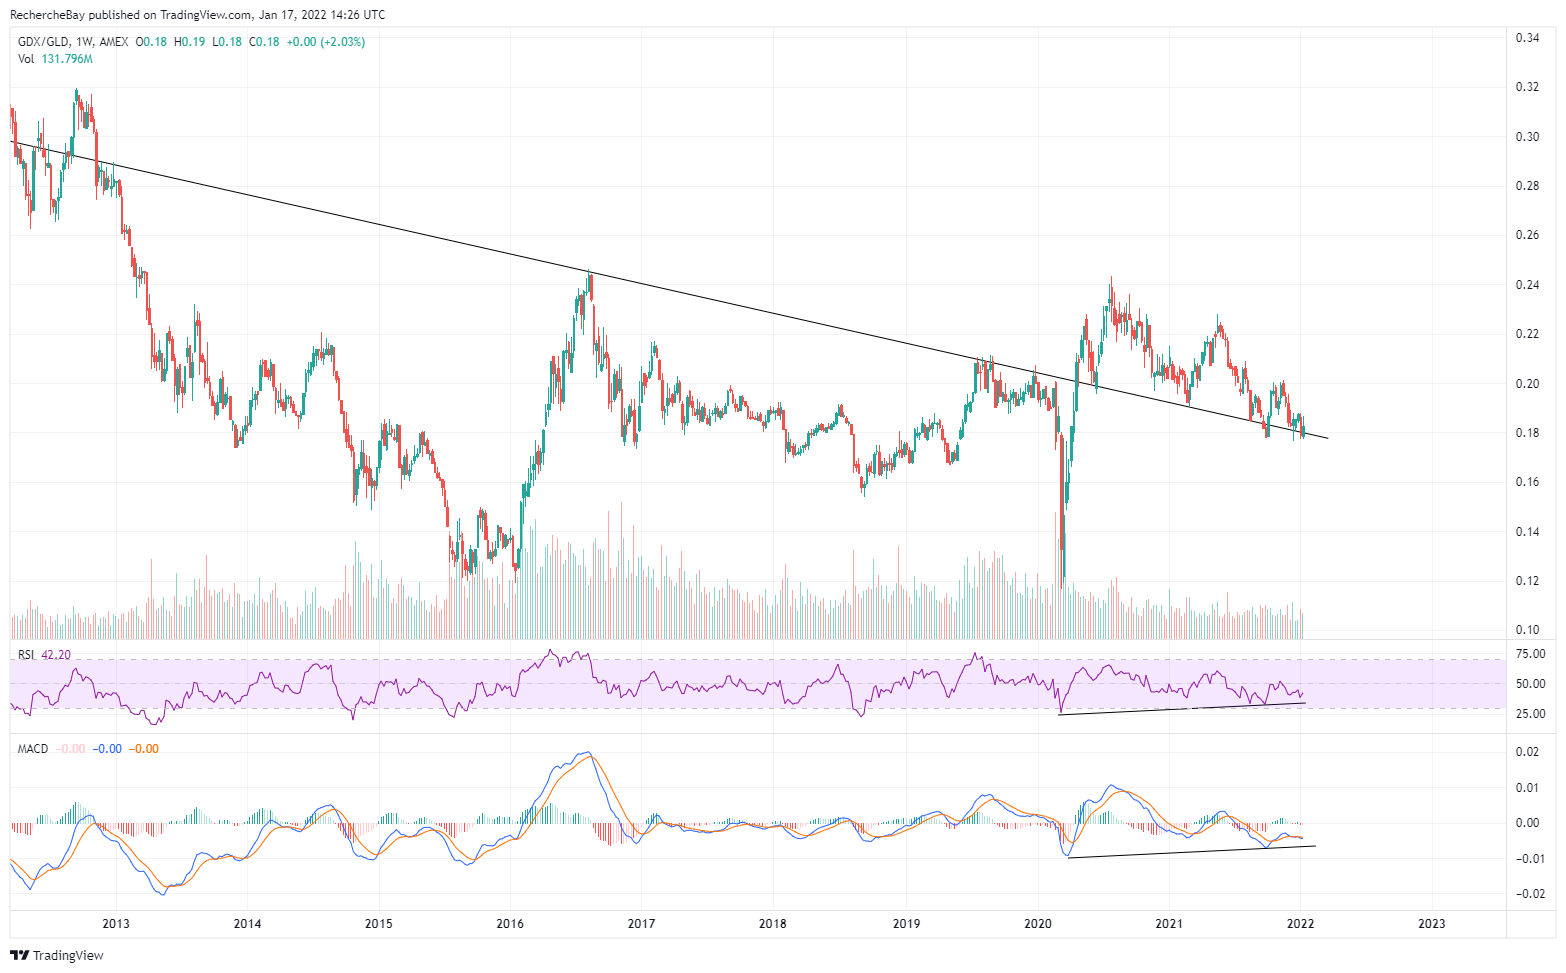
This support level is very solid, in any case, and has been resisting since the end of 2021 on a bullish divergence pattern.
Let us try, then, to get a better overview of the situation by considering some other indicators.
Since 2016, we have reiterated in these articles, on multiple occasions, the point that the mining stocks index is directly correlated to the silver price. The GDX/SILVER ratio is fluctuating within a narrow channel, hemmed in by a trading algorithm that controls the entire mining stocks sector! It is the “capping” on silver that is preventing the mining stocks from taking off! What is the relationship between the two instruments? There isn’t one! We certainly have to acknowledge, however, the power of this algorithm when it comes to determining the prices of our dear mining stock companies..
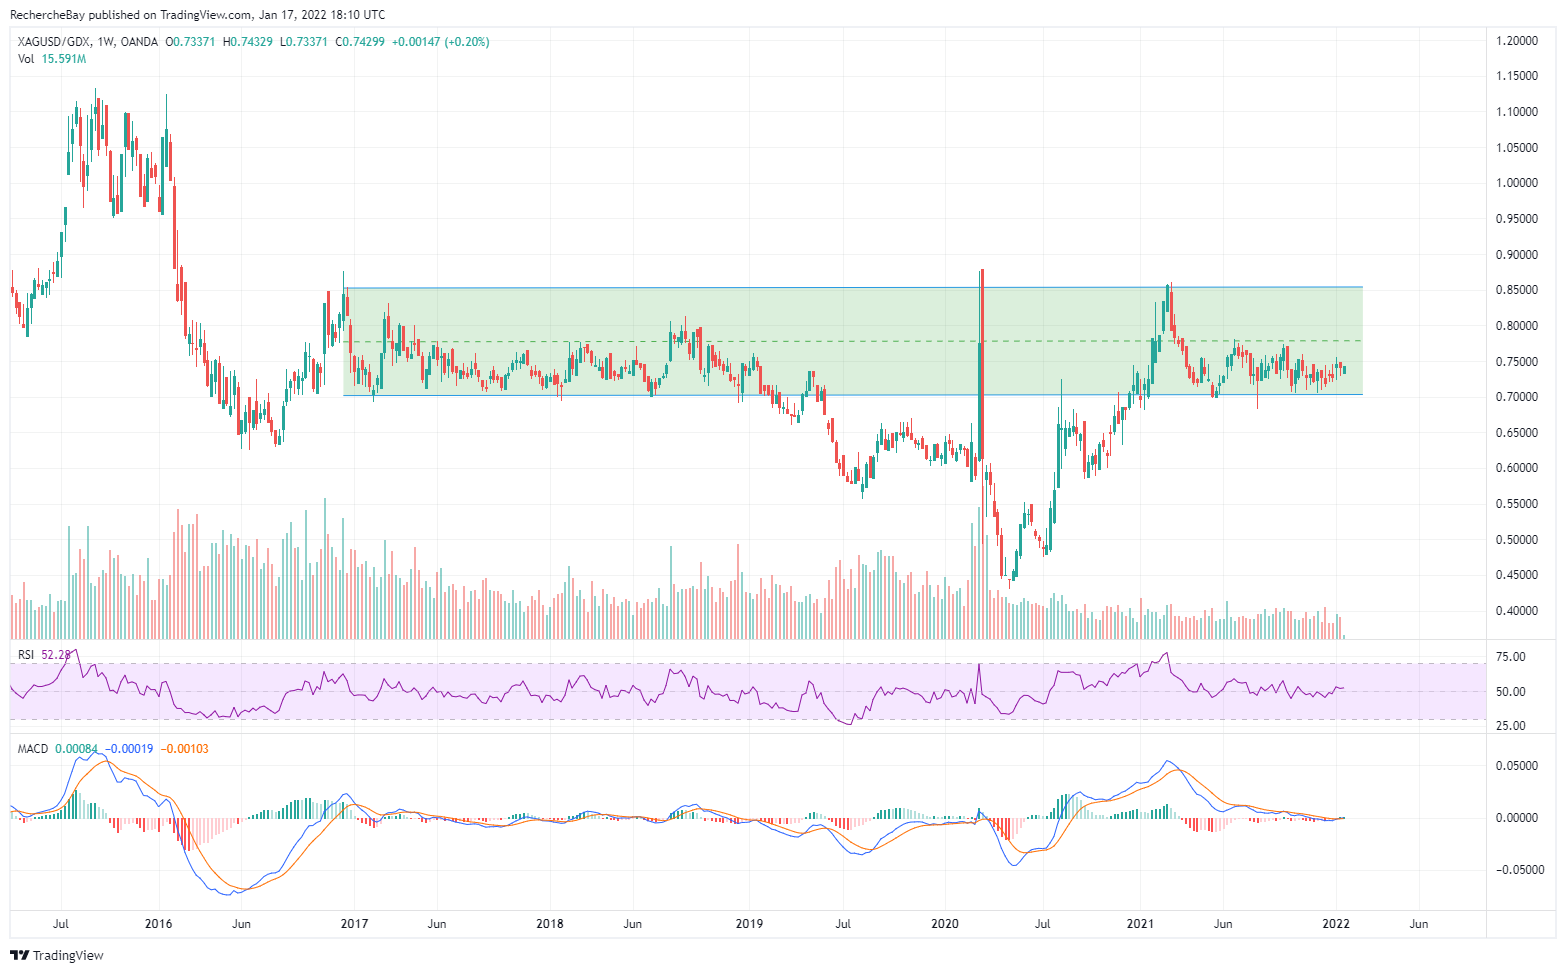
Observing the silver prices is becoming very useful in terms of predicting what will happen next.
And when one looks at the variations in the silver prices compared to other commodities, one notes that the tumbling of the SILVER/CRB ratio is in the process of ending (the CRB is a major “commodities” index). Since 2006, silver has outperformed the other commodities at global level, and we have just reached the bottom of the bullish channel.
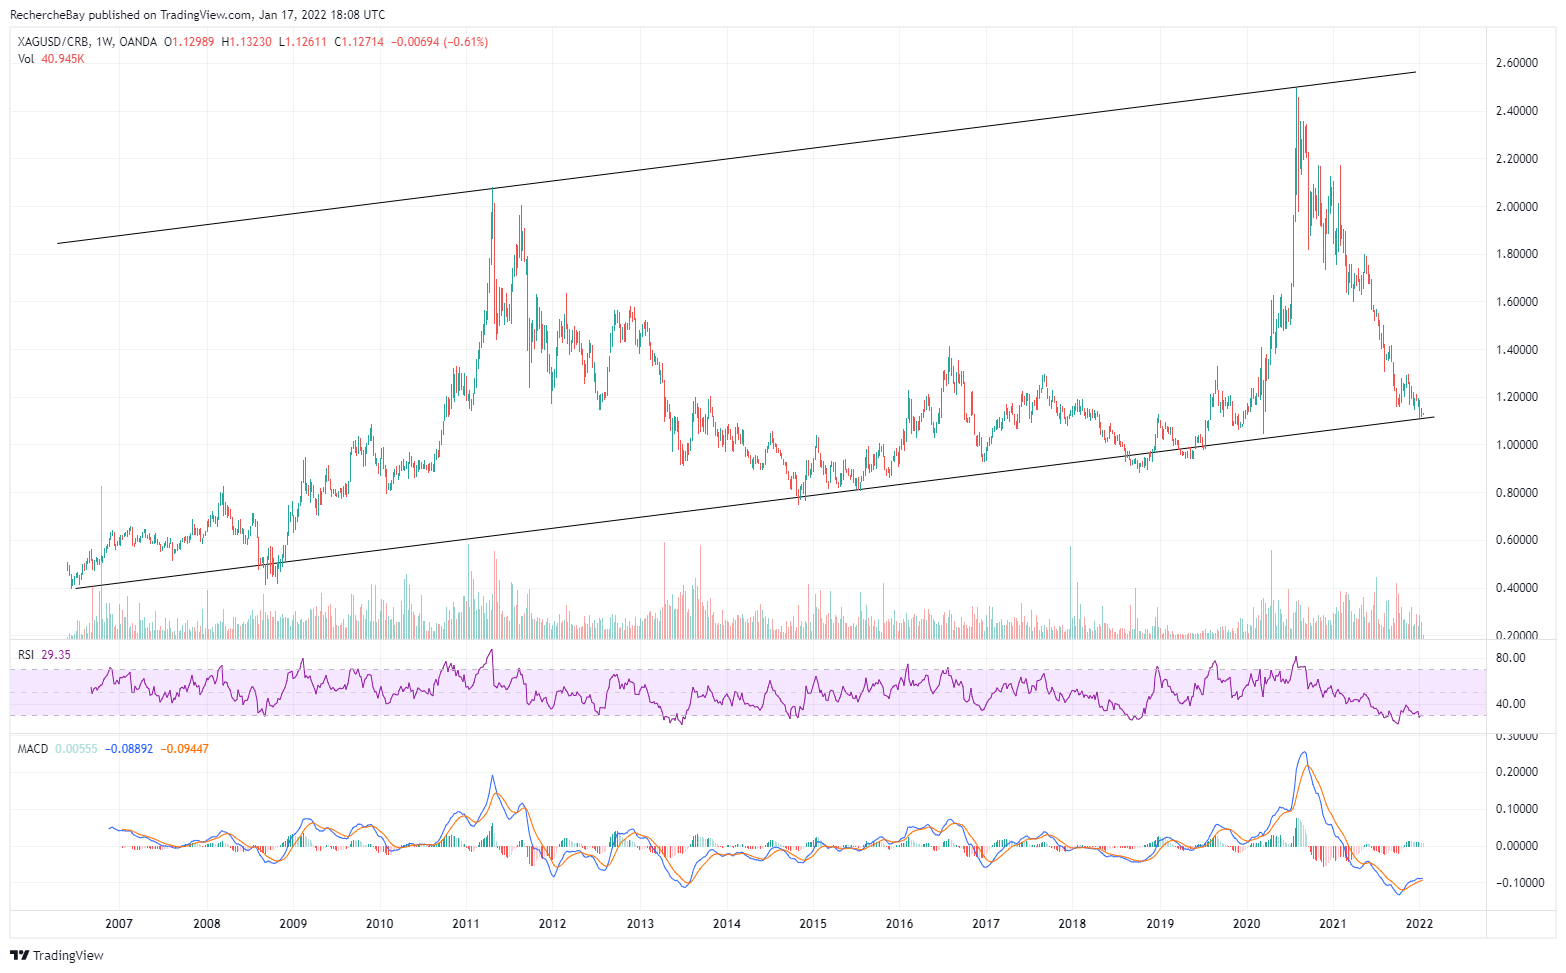
One of two things is going to happen: either the current inflation will calm down somewhat and the next correction to commodities will have less of an impact on physical silver. Or, alternatively, the bullish pressure on commodities will continue and silver will be on the point of taking off.
And if the mining stocks / silver correlation is reconfirmed again, the mining stocks ought to outperform the SP500 in the coming weeks.
What is there that might support this scenario?
The dollar is the key to any study of the charts that concerns commodities. We will see in a matter of days whether we are definitively leaving the bullish trend initiated one year ago on the greenback.
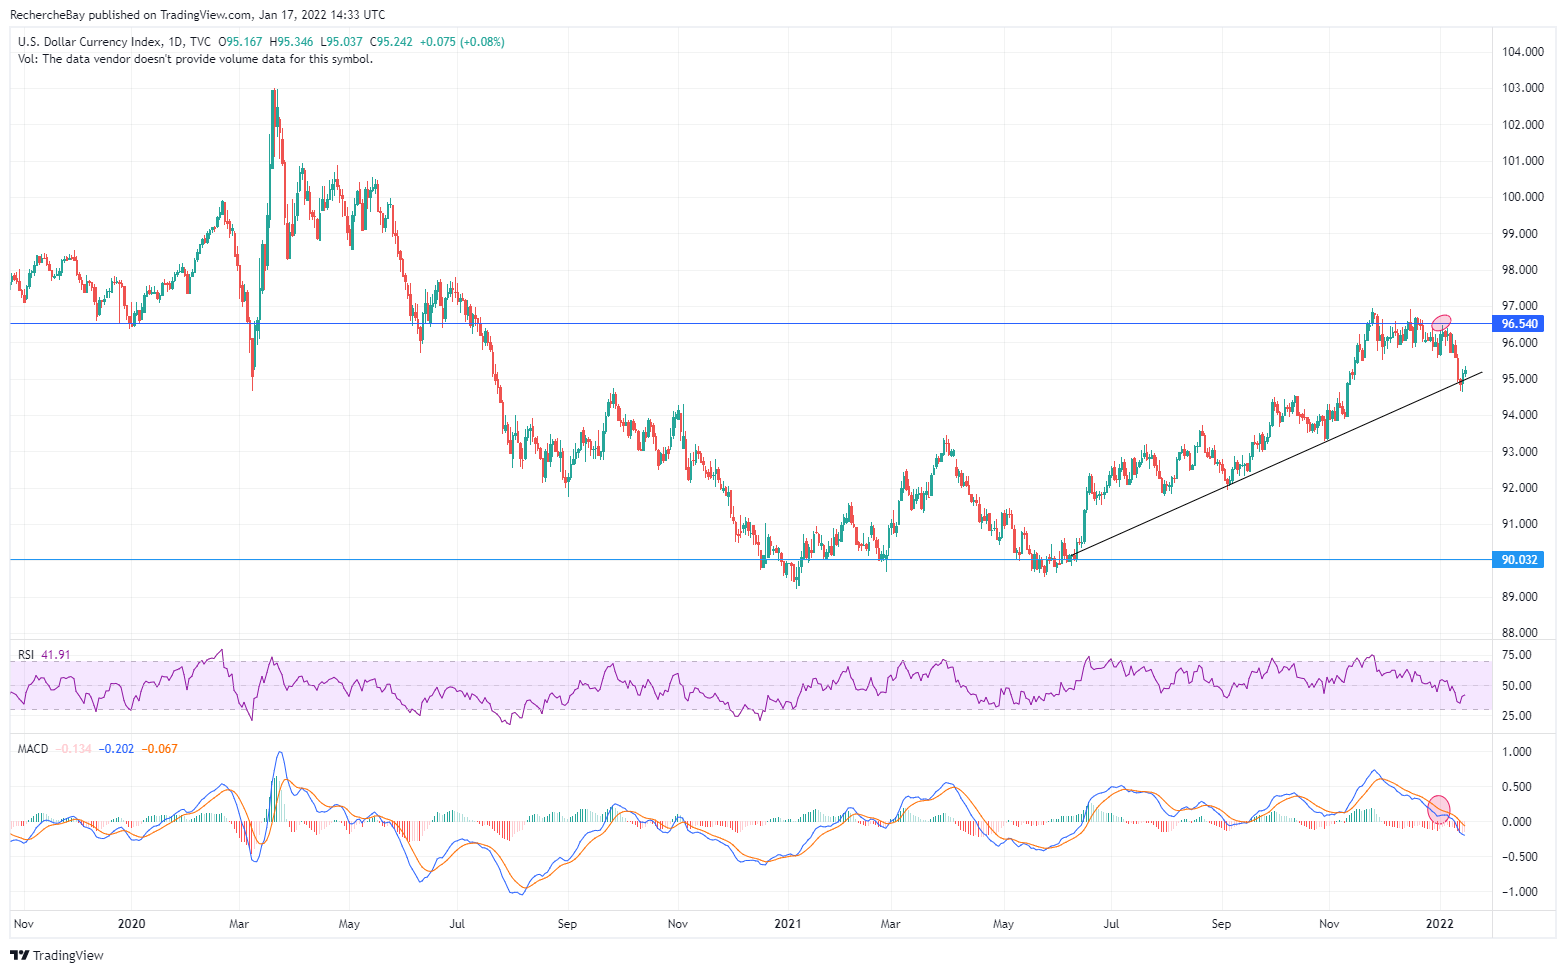
The coming days will be decisive in terms of the level of the greenback. In order to avoid sketching what would be a bearish flag, the DXY index must now bounce back, violently, to break the threshold of 97.
The market is in the process of testing the credibility of the U.S. monetary authorities.
Although a reduction in the buying of assets was announced back in November, the expansion of the Fed’s balance sheet is slowly but surely continuing, and this balance sheet is now approaching $9 trillion.
#Fed's balance sheet expansion continues, albeit at a reduced pace as Fed has cut Treasury buying by $20bn. Total assets rose by another $22.6bn to $8,788.3bn, just $2bn shy of an ATH. Fed's balance sheet is now equal to 37.9% of the US's GDP vs ECB's 82%, BoJ's 135%. pic.twitter.com/qpXbwFjfkS
— Holger Zschaepitz (@Schuldensuehner) January 13, 2022
It has been officially announced that the quantitative easing will come to an end next week. The market is now expecting 4 rate hikes this year. For the time being, though, this monetary policy is continuing to sustain the rise in commodities.
This week, nickel is soaring to an all-time high. The price of nickel has doubled since March 2020.

The hike in prices is also affecting coal and aluminum. Gasoline is at a 5-year high. Fuel prices are at an all-time high in France...
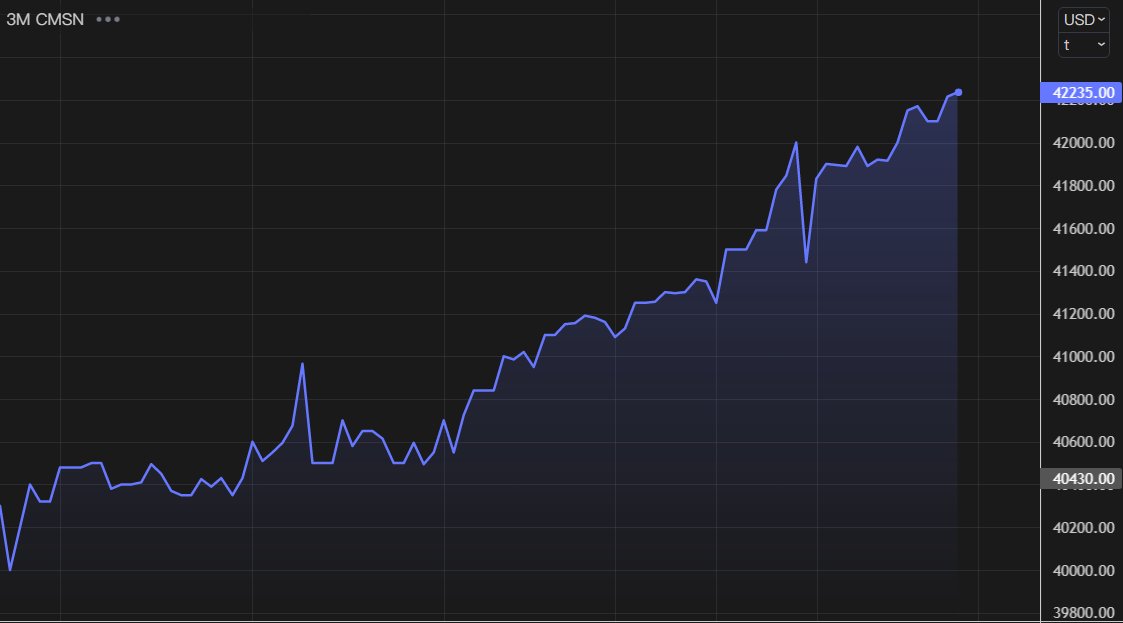
Tin is soaring to record highs once again:
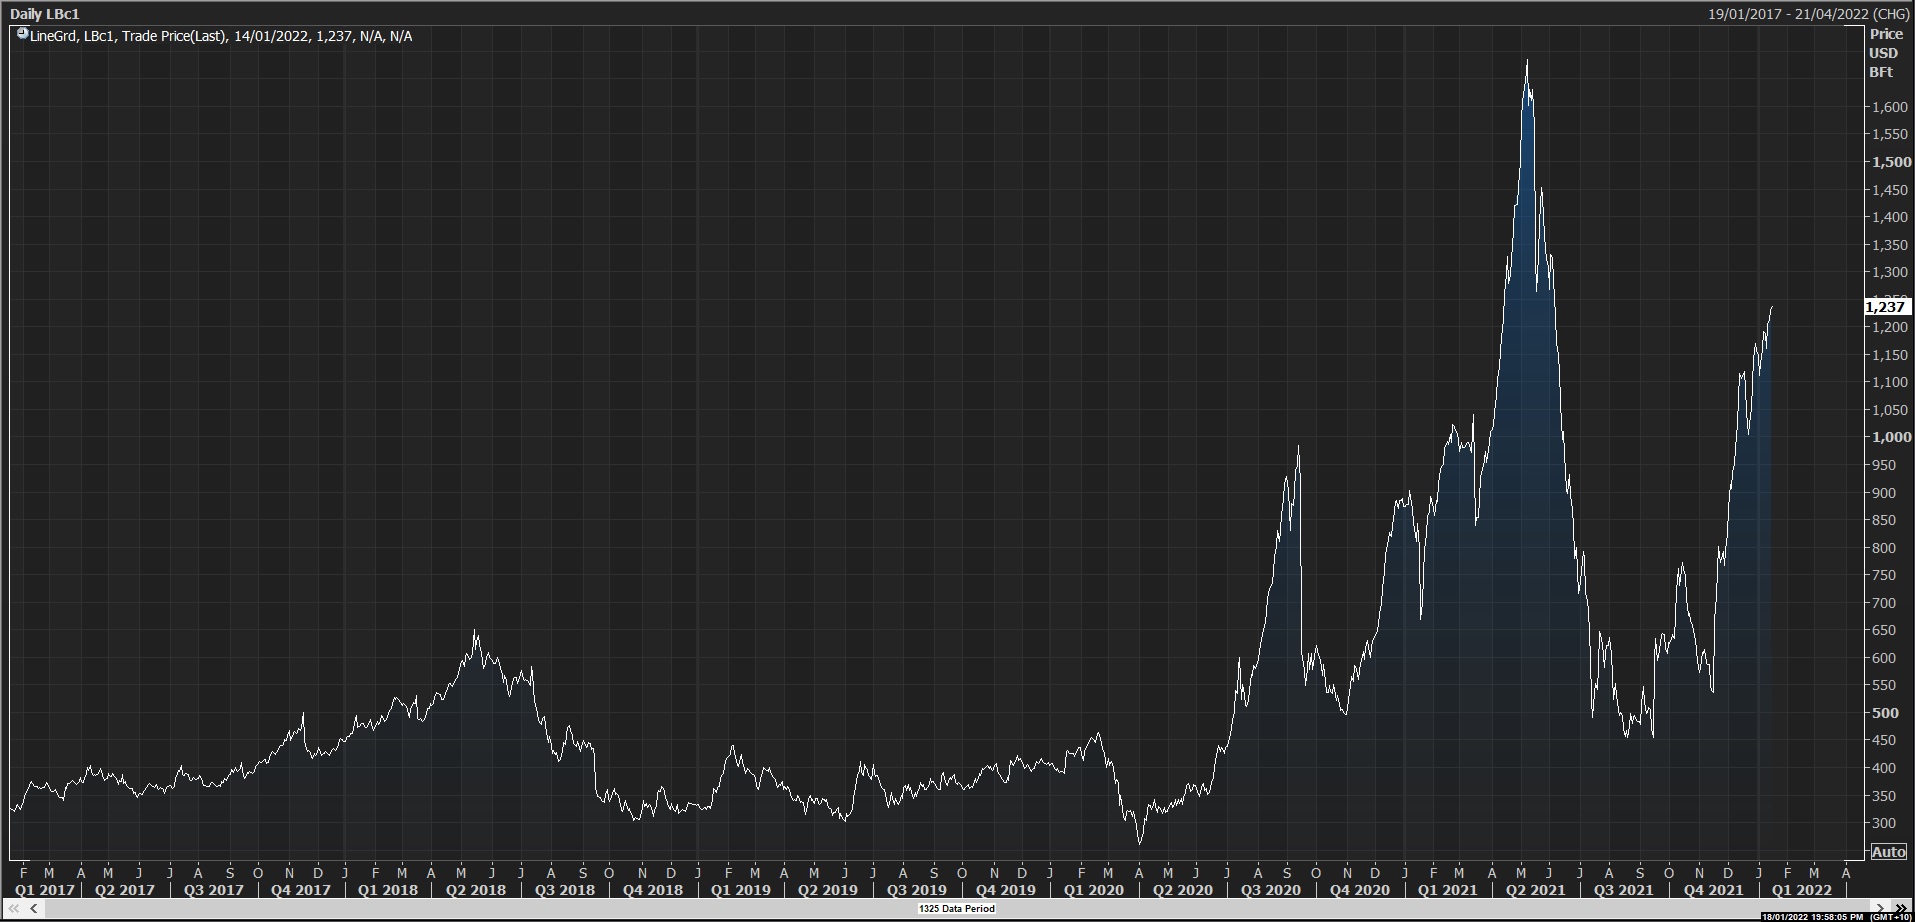
Lumber, which was thought to have signaled the end of inflation with a net drop in its price this fall, is moving toward historic highs once again:
On the other hand, the energy crisis in Europe is starting to have direct consequences on manufacturing activity.
The manufacturerDunkirk has decided to reduce its production by -15% due to the rise in energy prices, thereby further reducing the global supply of aluminum and, in turn, fueling the rise in the price of a material that is essential to European industry.
Another indicator to be monitored for signs of a possible ebbing of inflation: the blocking up of the production chain. There, too, things are yet to get back to normal. The cargo ships waiting outside the ports of California are now having to drop anchor a lot further away. The congestion within 64 km of the shore is now having repercussions further out to sea...
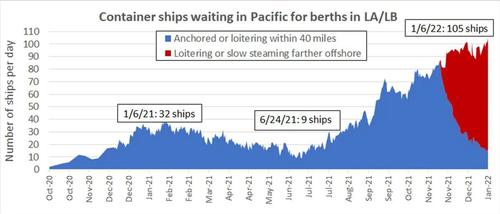
The real problem is that the ports of California are cluttered with empty containers, and they lack the space to store them. There is an enormous differential between what’s coming in and what’s going out!
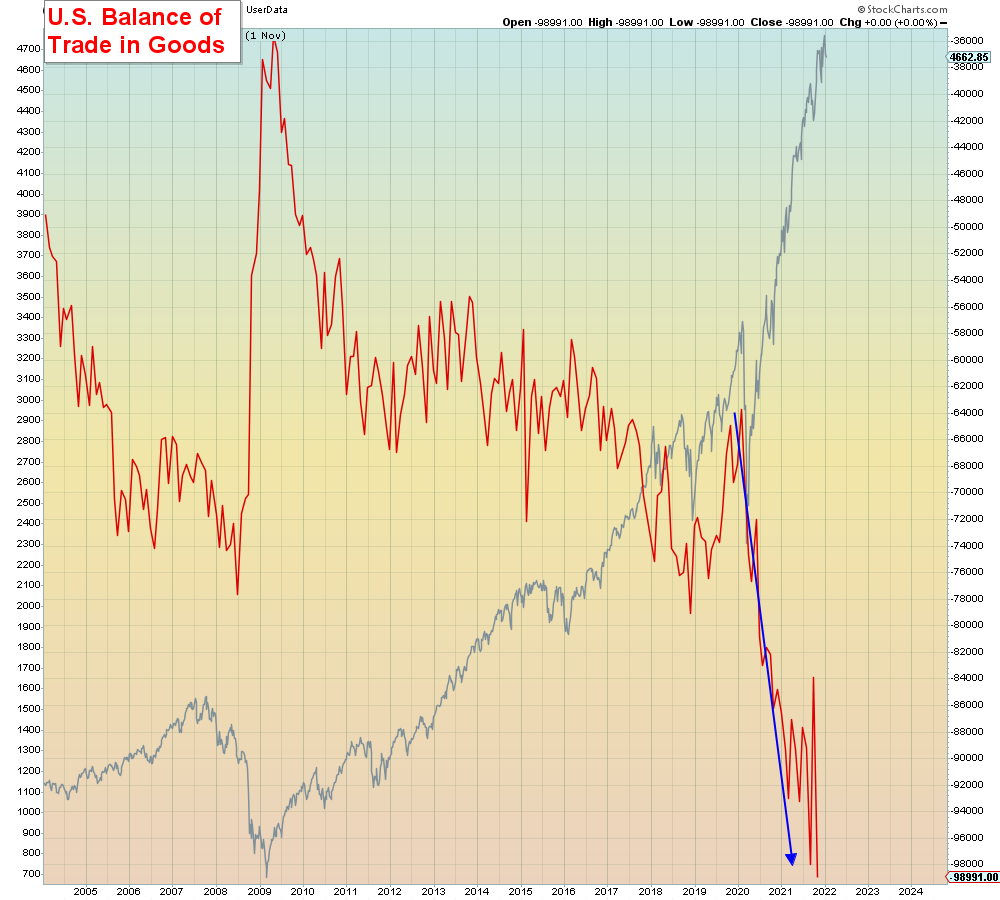
The balance of trade in goods in the United States provides a perfect illustration of this differential. Since the start of the sanitary crisis, this difference between the flows of goods has accelerated, thereby posing an insurmountable logistical problem in the Californian ports.
What’s more, the sanitary situation is causing growing logistical difficulties all over the world. The strike over vaccine passports by truck drivers in Canada risks plunging the country into an unprecedented crisis. In China, the sanitary situation is becoming uncontrollable and the policy of strict lockdown is in the process of paralyzing the production mechanism still further.
In practical terms, it is not possible to predict when or how these problems with congestion will be resolved. The resulting rise in prices is showing no signs of stopping. This inextricable situation is forcing the Fed to make a radical change on inflation. The economist Dr Daniel Lacalle perfectly sums up the way the Fed’s narrative has changed in recent months:
Inflation... and how central banks see it.#Fed #inflation pic.twitter.com/NDDZrJ8dwY
— Daniel Lacalle (@dlacalle_IA) January 13, 2022
The Fed’s economists, hidden away behind their screens, had to face the reality of a breakdown in logistics on the ground to realize that no algorithm that their clever teams could come up with would be able to “physically” unblock the ports of California and the logistical problems on the ground.
What if these same economists were now to prove unable, not even by raising rates, to solve this unprecedented equation that seems increasingly unsolvable?
One can’t simply snap one’s fingers and, just like that, restore equilibrium to a system that is based on the outsourcing of production centers, by bringing inflation back down while preserving demand!
Will a rate rise now be sufficient to correct the current problem in the global production chain?
For the time being, the only consequence of simply threatening to raise rates is a slowdown in economic activity. The Empire State Manufacturing survey is even starting to record the beginnings of a recession in the United States. The risk is that we might now see severe stagflation take hold in the United States...
What real power do the monetary authorities have faced with this situation?
Original source: Recherche Bay
Reproduction, in whole or in part, is authorized as long as it includes all the text hyperlinks and a link back to the original source.
The information contained in this article is for information purposes only and does not constitute investment advice or a recommendation to buy or sell.


