The latest figures on inflation have finally managed to silence all those who were predicting deflation.
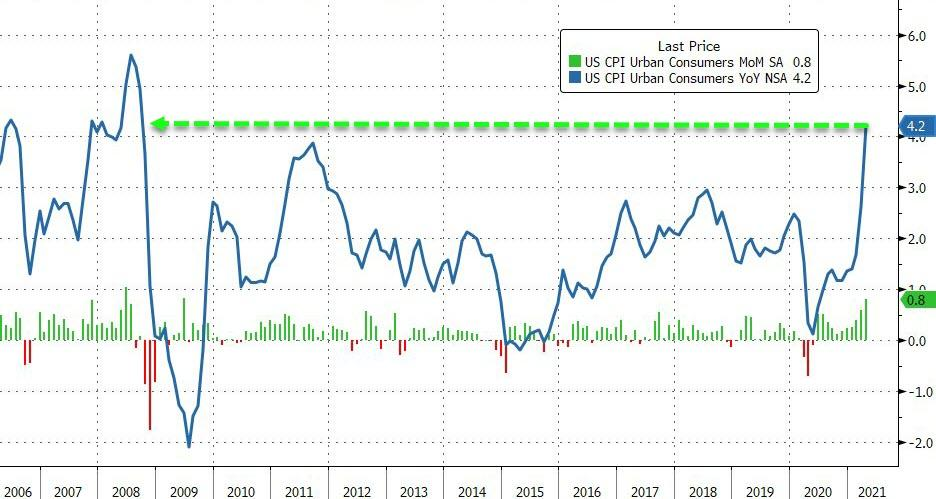
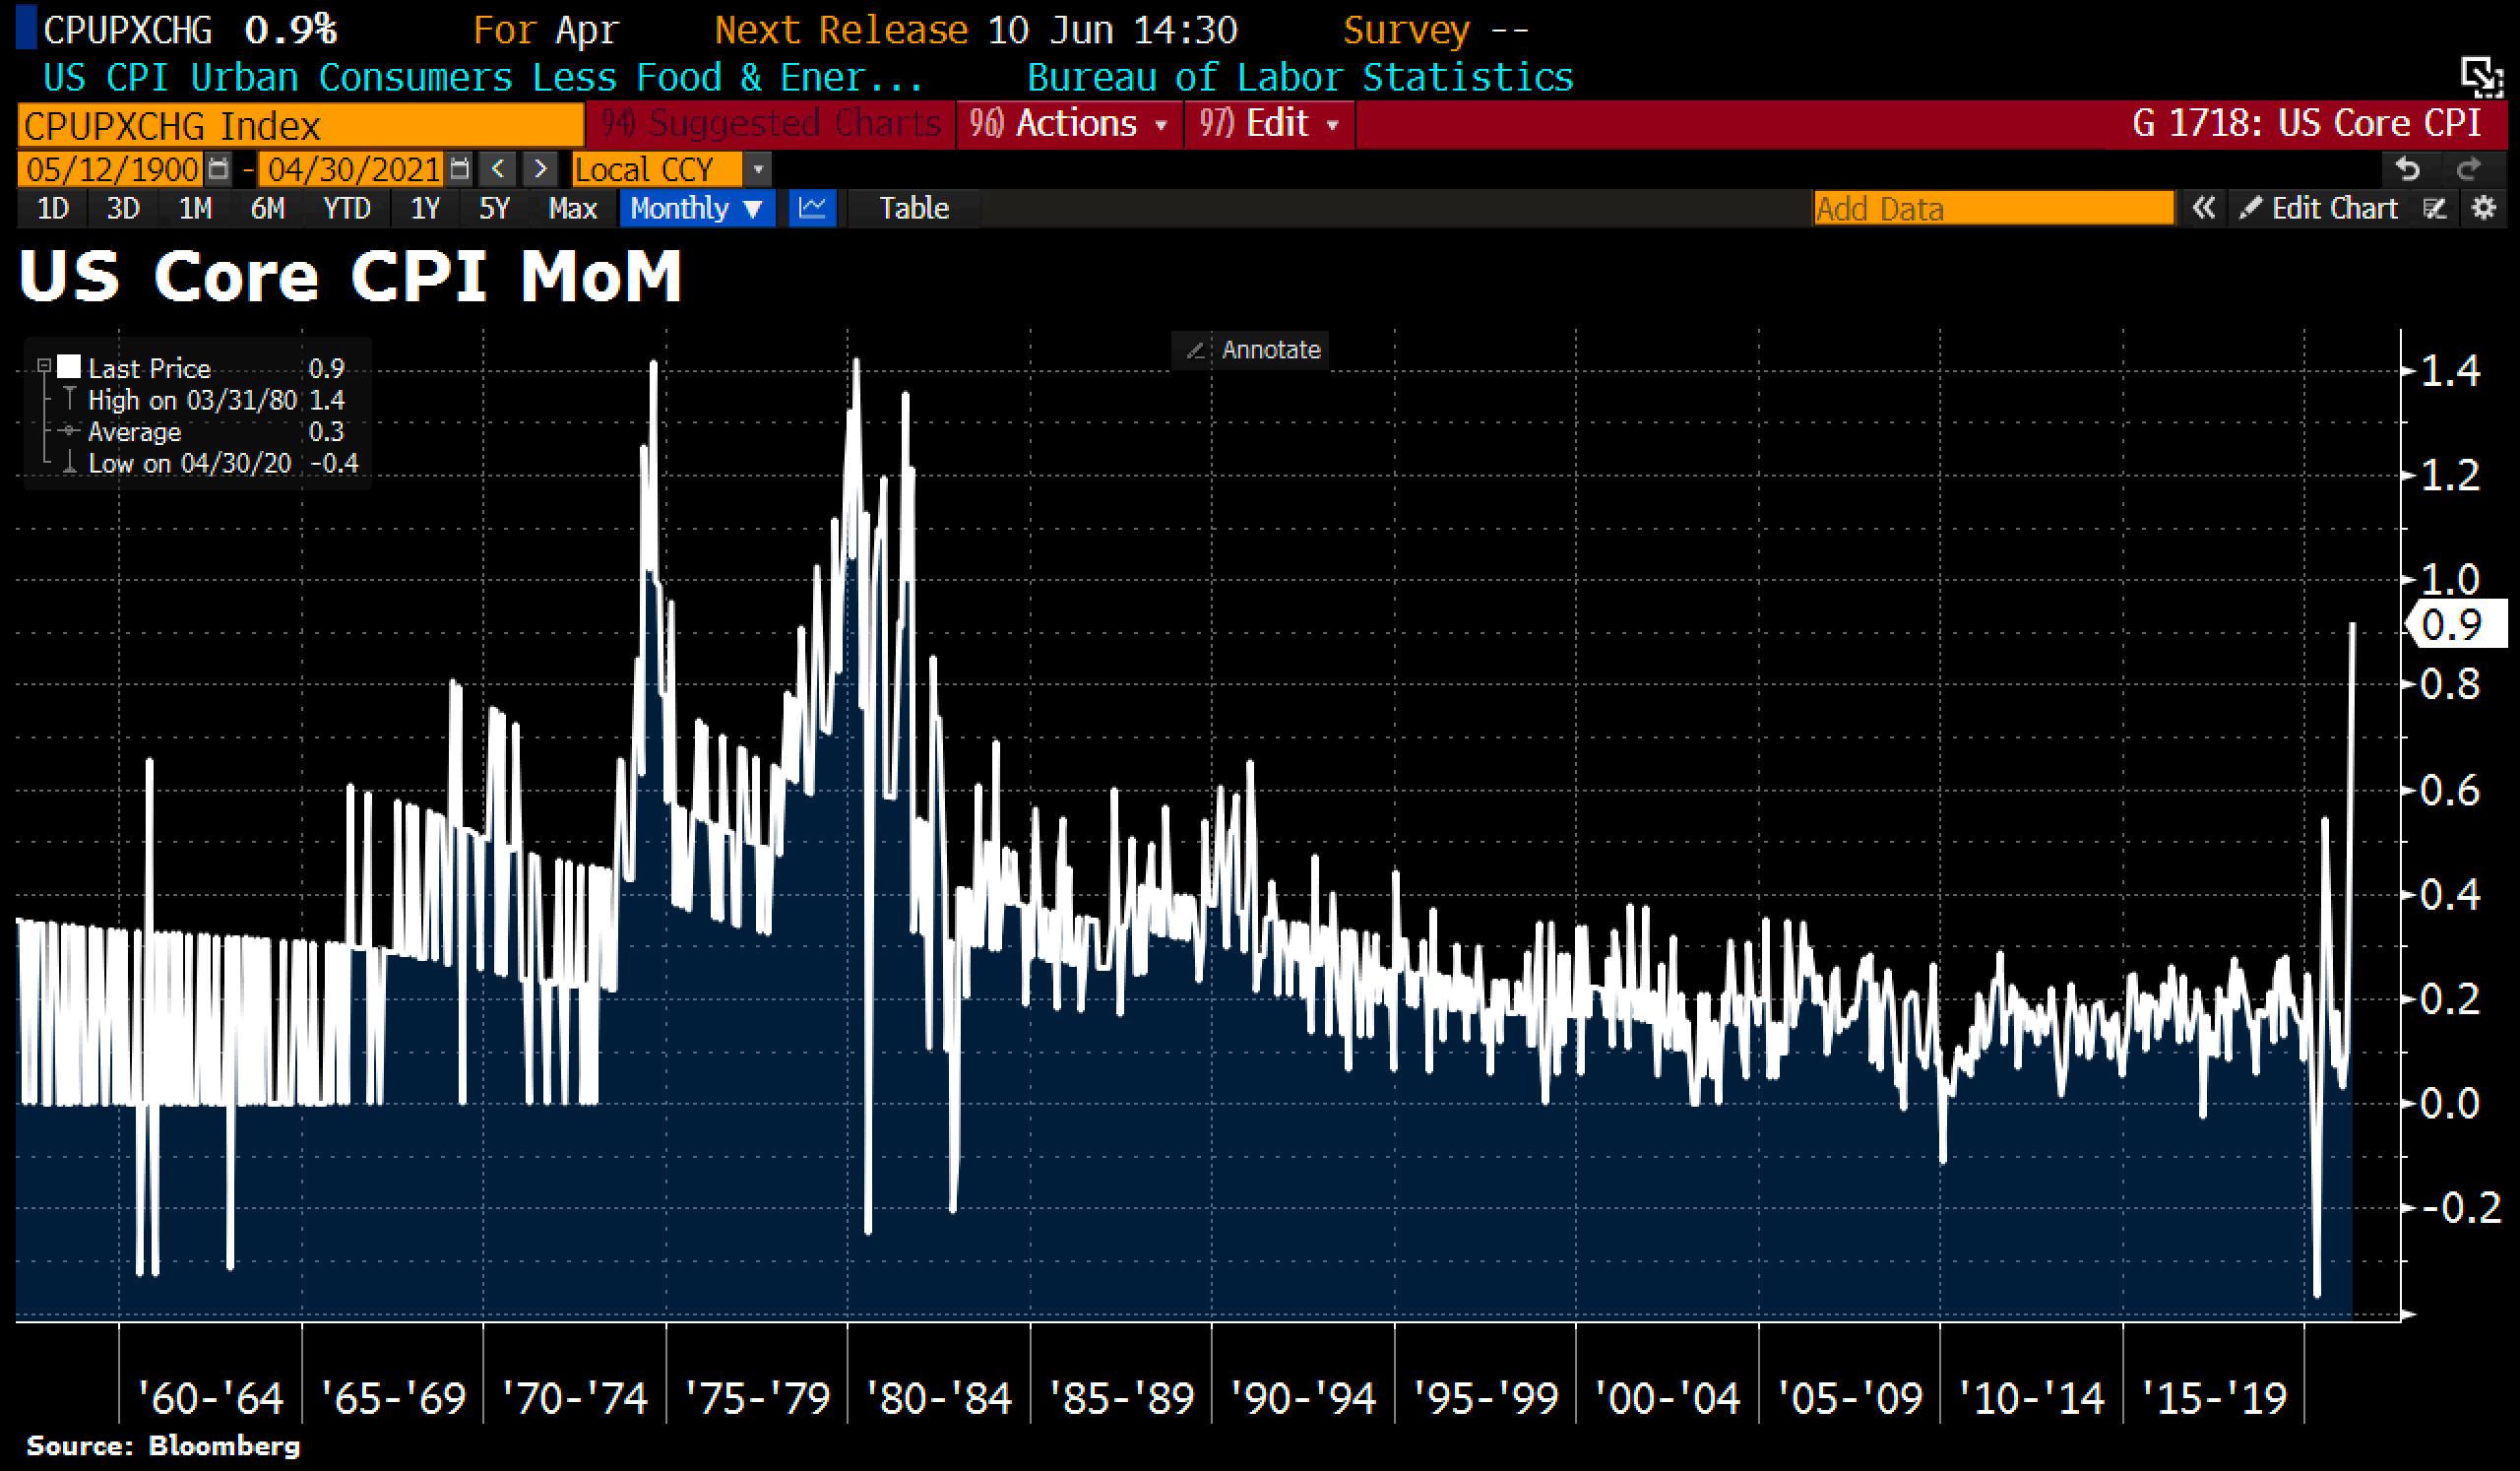
The rise in inflation measured by the latest figures is at its highest since 1981. The latest CPI figure published in the United States records an increase of 4.2% in the prices over the year, but above all, an increase of 0.9% in relation to the previous month, corresponding to an annual rate of inflation of more than 10%.
With 10% inflation and no renumeration of savings, people are better off buying straight away rather than risking losing 10% purchasing power on an asset that’s appreciating all the more because of this inflation. And figures like these are starting to make themselves felt in everyday life.
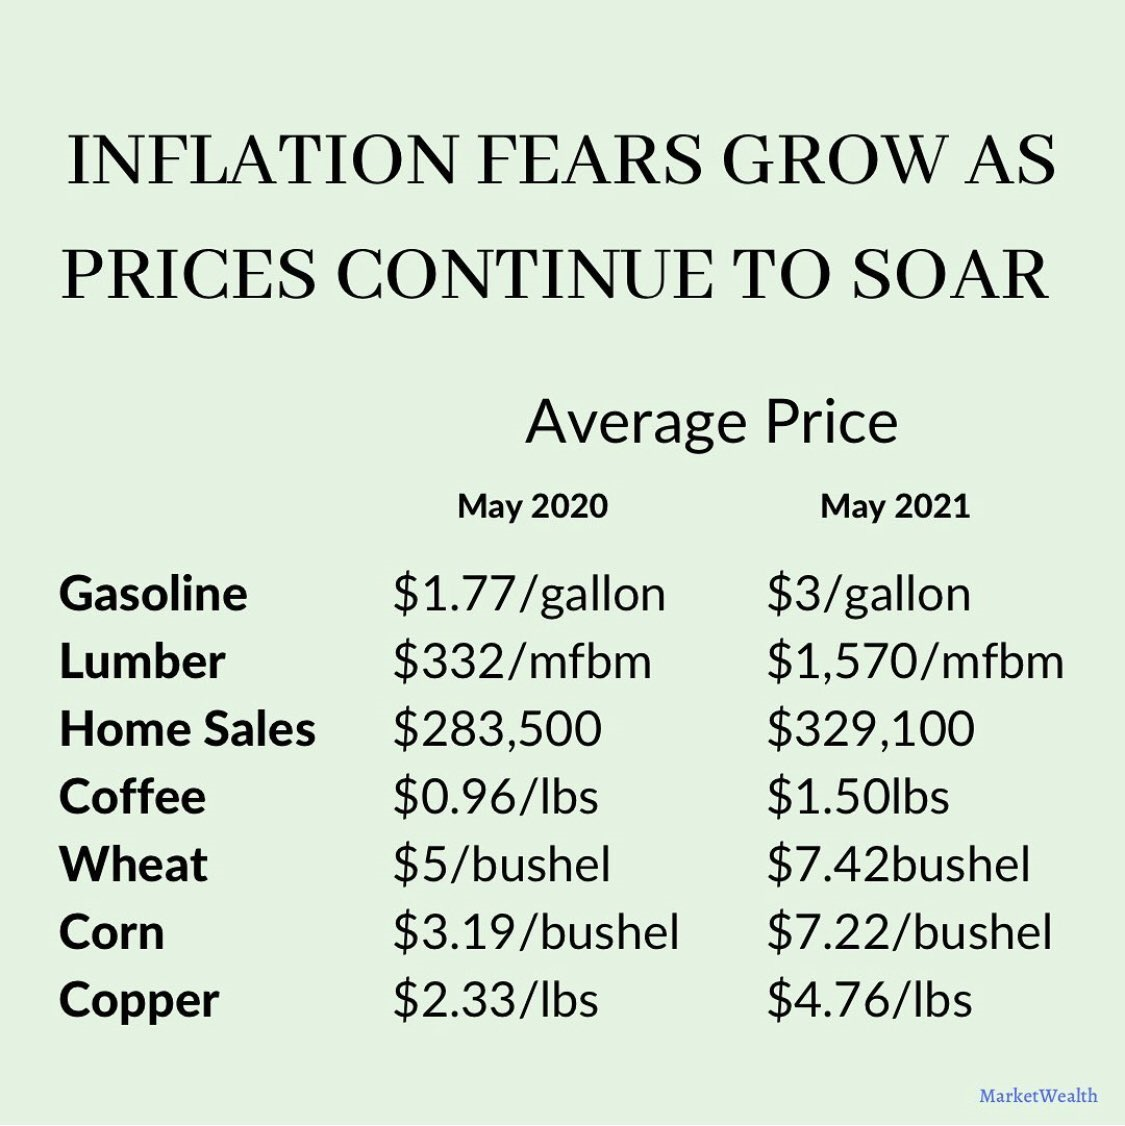
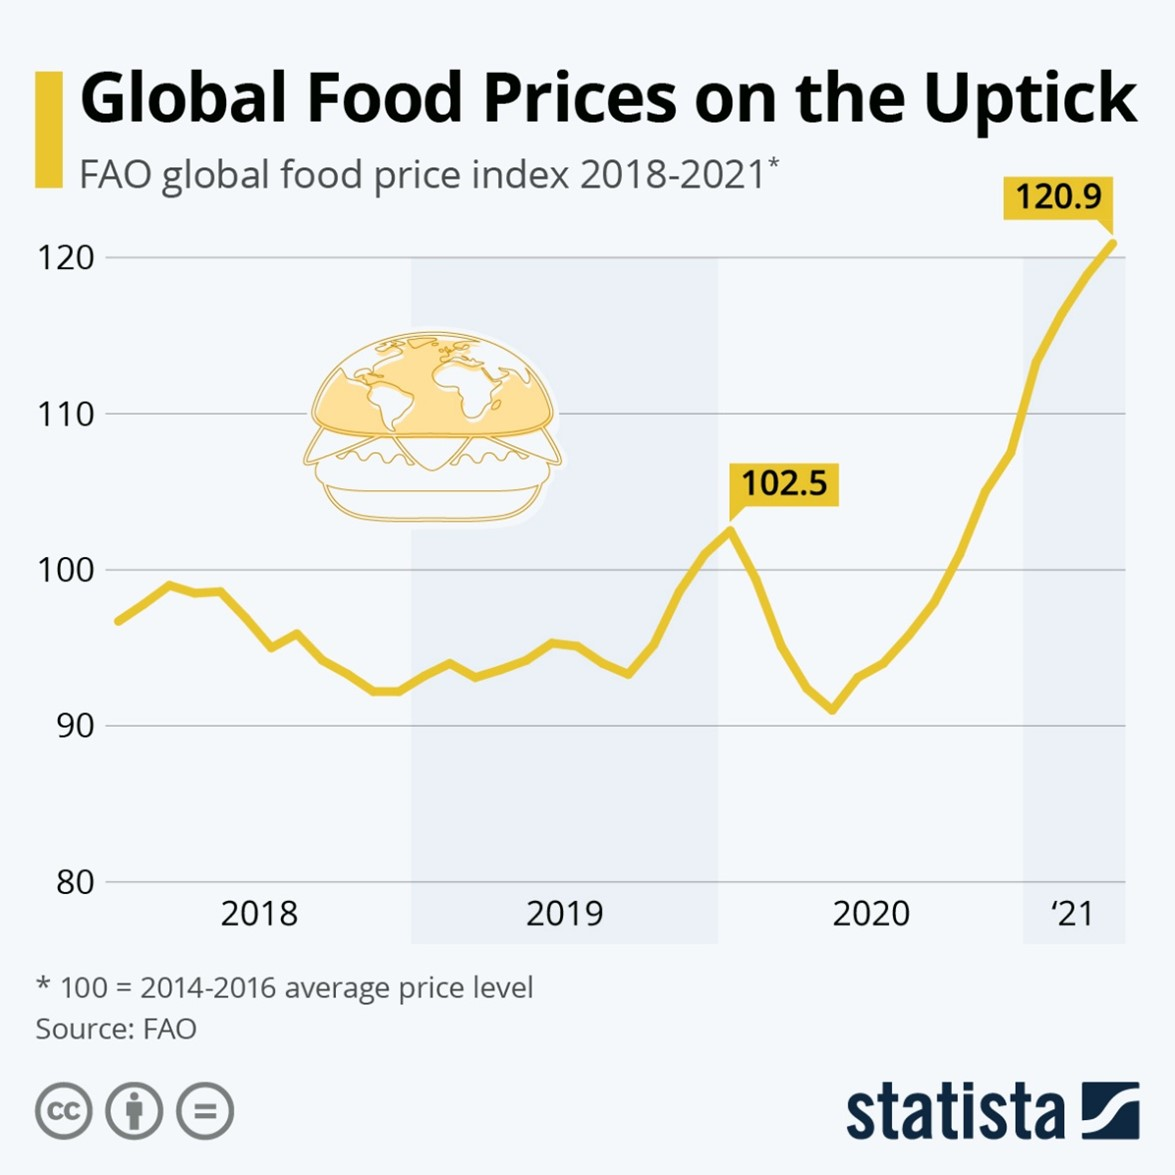
The price of food has already risen by +30% globally in barely a year, according to the FAO.
In the United States, used cars are currently selling at an annual rate of increase of 12.4%, not least due to a scarcity of new vehicles, a scarcity caused by problems with the distribution of electronic components. The price of new vehicles is rising by 7%. That is more than what’s being reported by the CPI index, which records a rise of 1.2% in its latest calculation alone. The statistics published by the U.S. administration are increasingly detached from the data published by the private research institutions, and that’s fairly typical in a take-off phase of widespread inflation - this is what unfolds in virtually all countries that enter a phase of uncontrolled inflation.
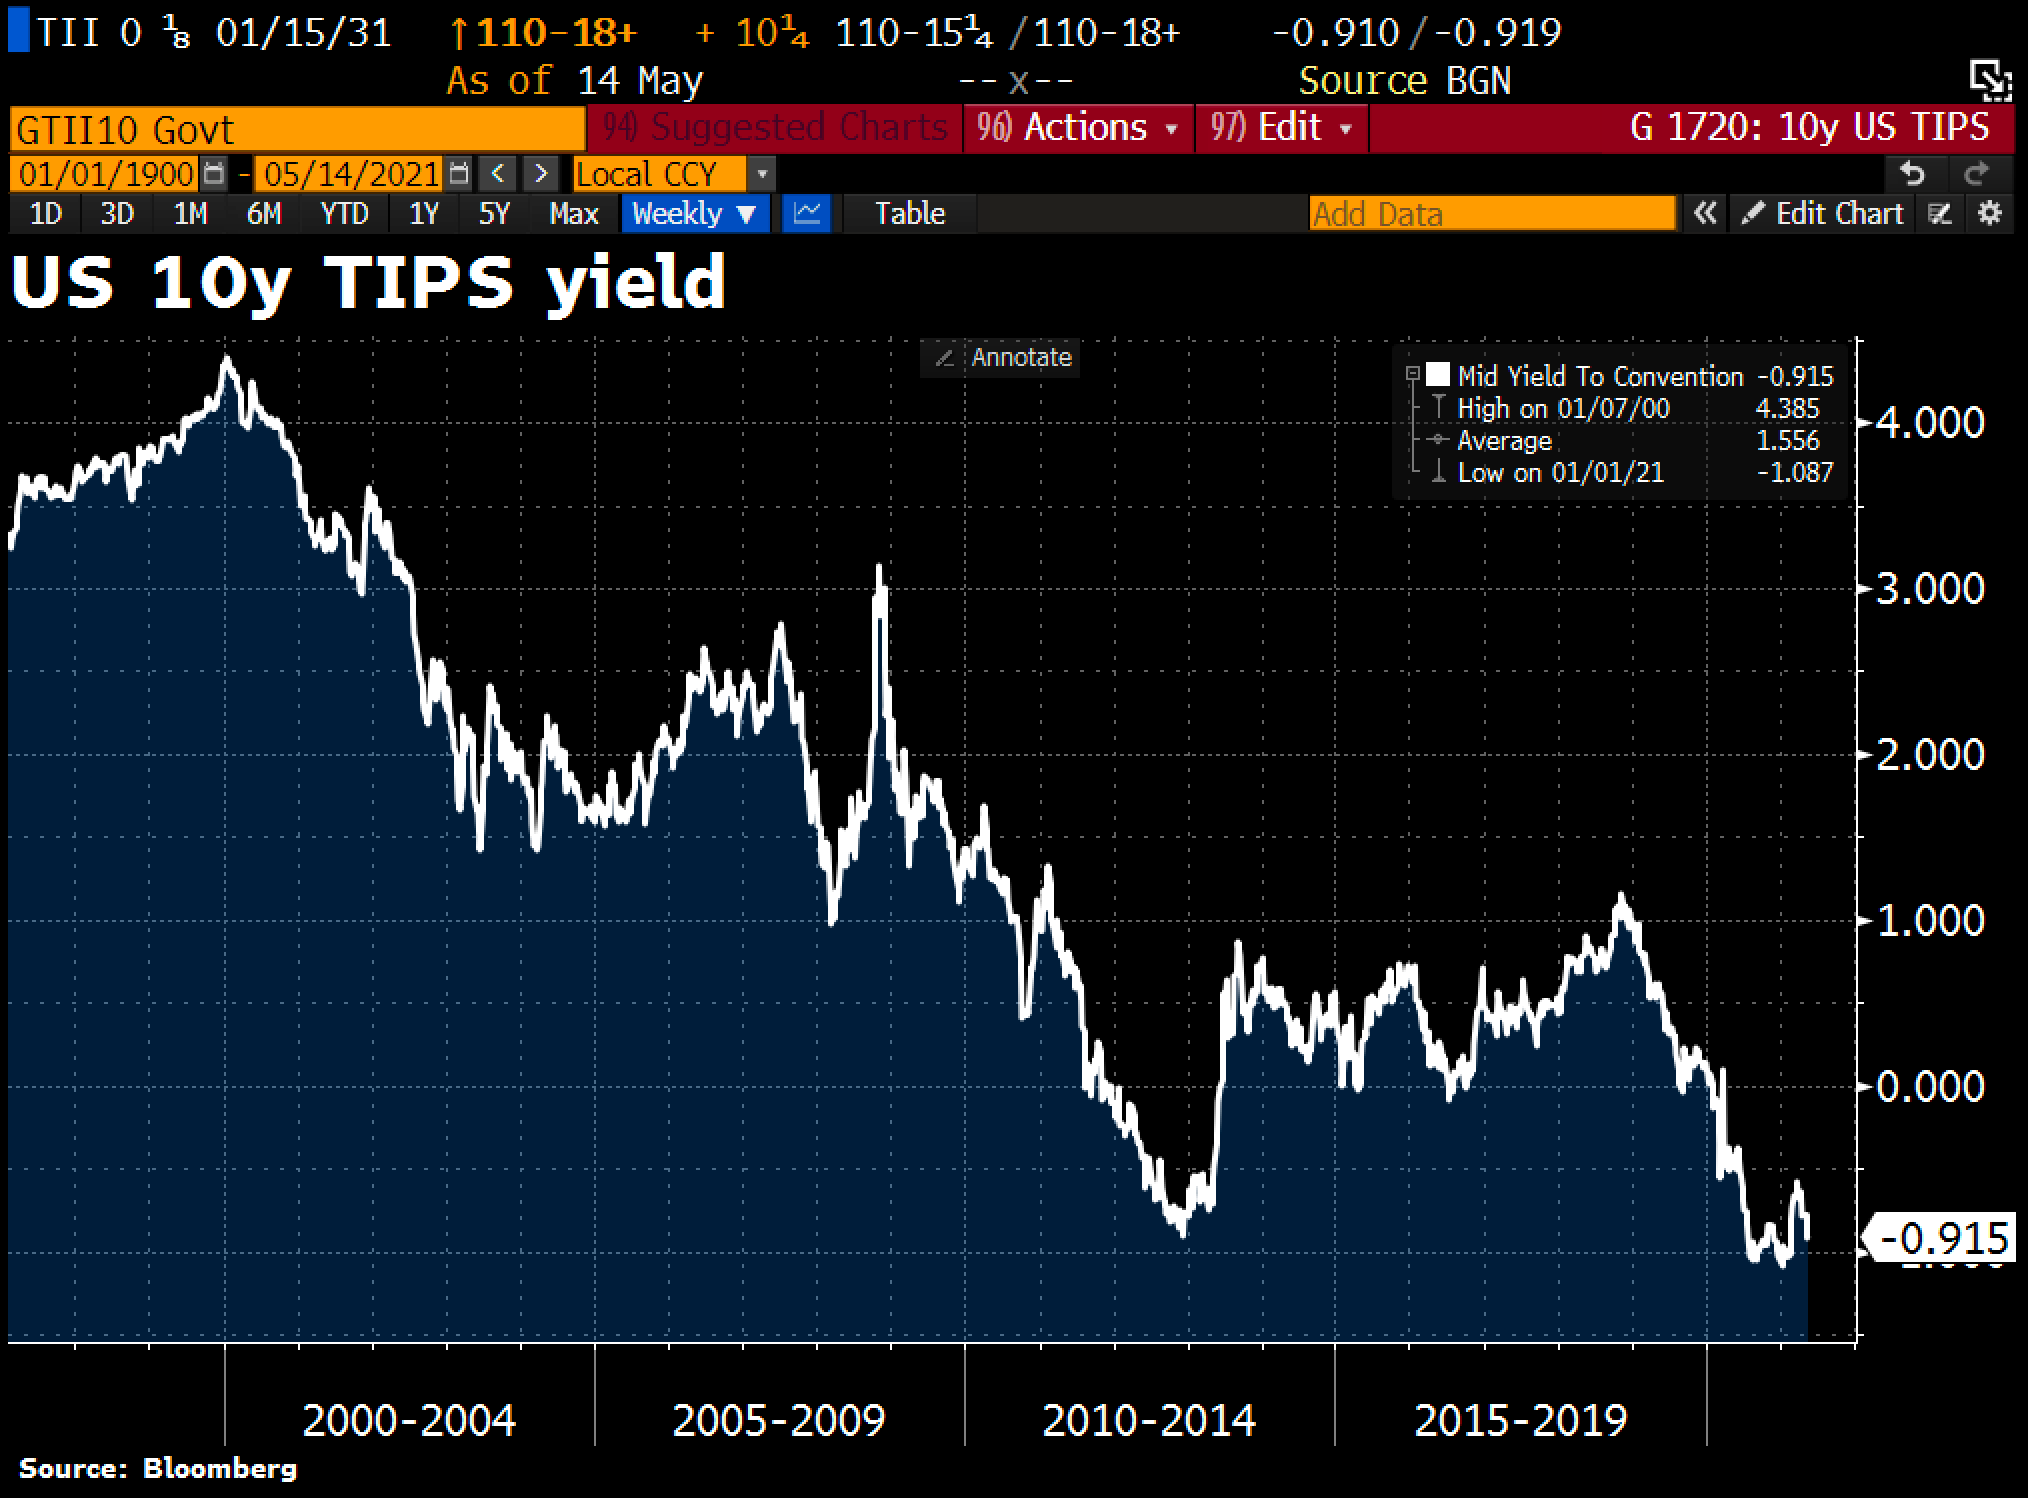
These inflation figures are reminiscent of the 1970s. The only problem is that the interest rates are by no means the same as in those days: the central banks are keeping them artificially low, thereby further reducing the value of cash, because the actual rates are collapsing. The 10-year yield, indexed to inflation, is heading toward all-time lows:
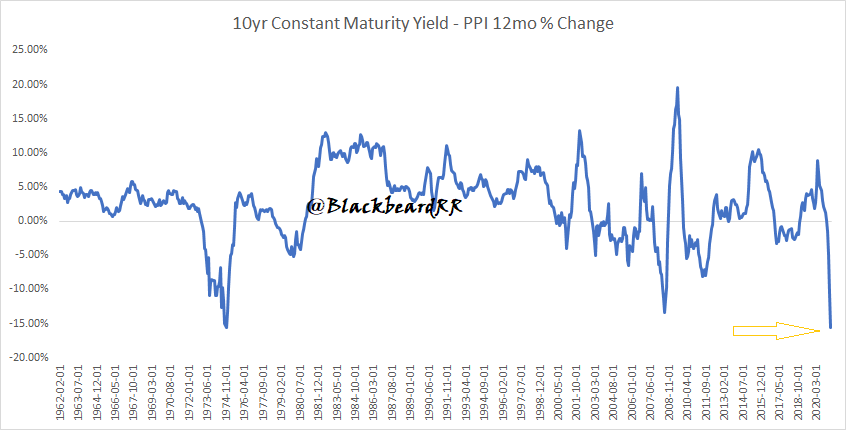
The differential between the US 10-year yield and the PPI inflation figure is at its lowest point since 1974!
The big difference between now and the ’70s is that back then, the Debt/GDP ratio was far lower than it is today. In 1982, when Volker had to call a halt to the inflationary fever, this ratio stood at 35%. Today, it is 5 times bigger, at 130%. Mr Powell is going to have to tackle this surge in inflation under conditions that are completely different than in Mr Volker’s day: a sharp hike in rates in a situation of such heavy debt, with an economy as fragile as this, is, of course, a far more delicate matter today...
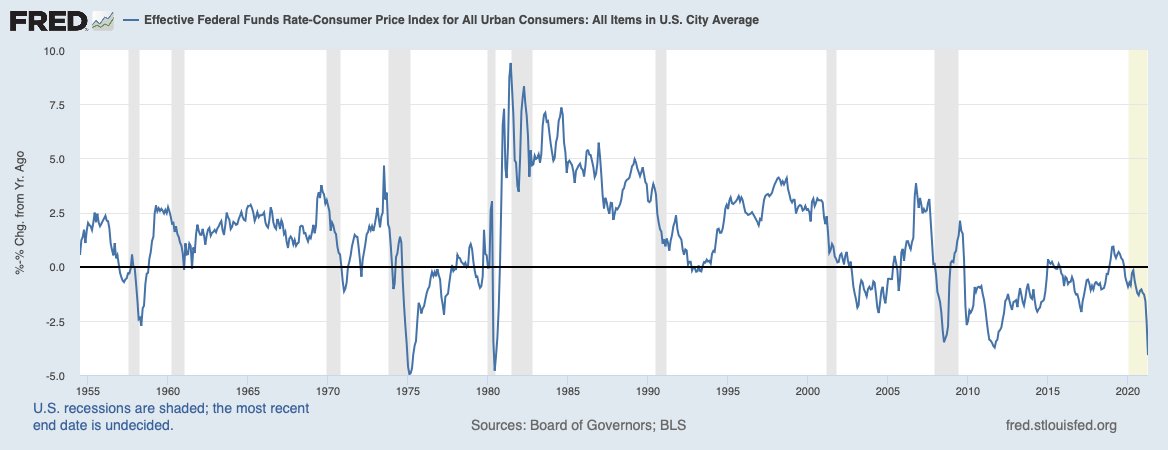
And yet the Fed’s real rates are already at -4.1%; it was at precisely these catastrophic levels that Mr Volker had to intervene in 1981.
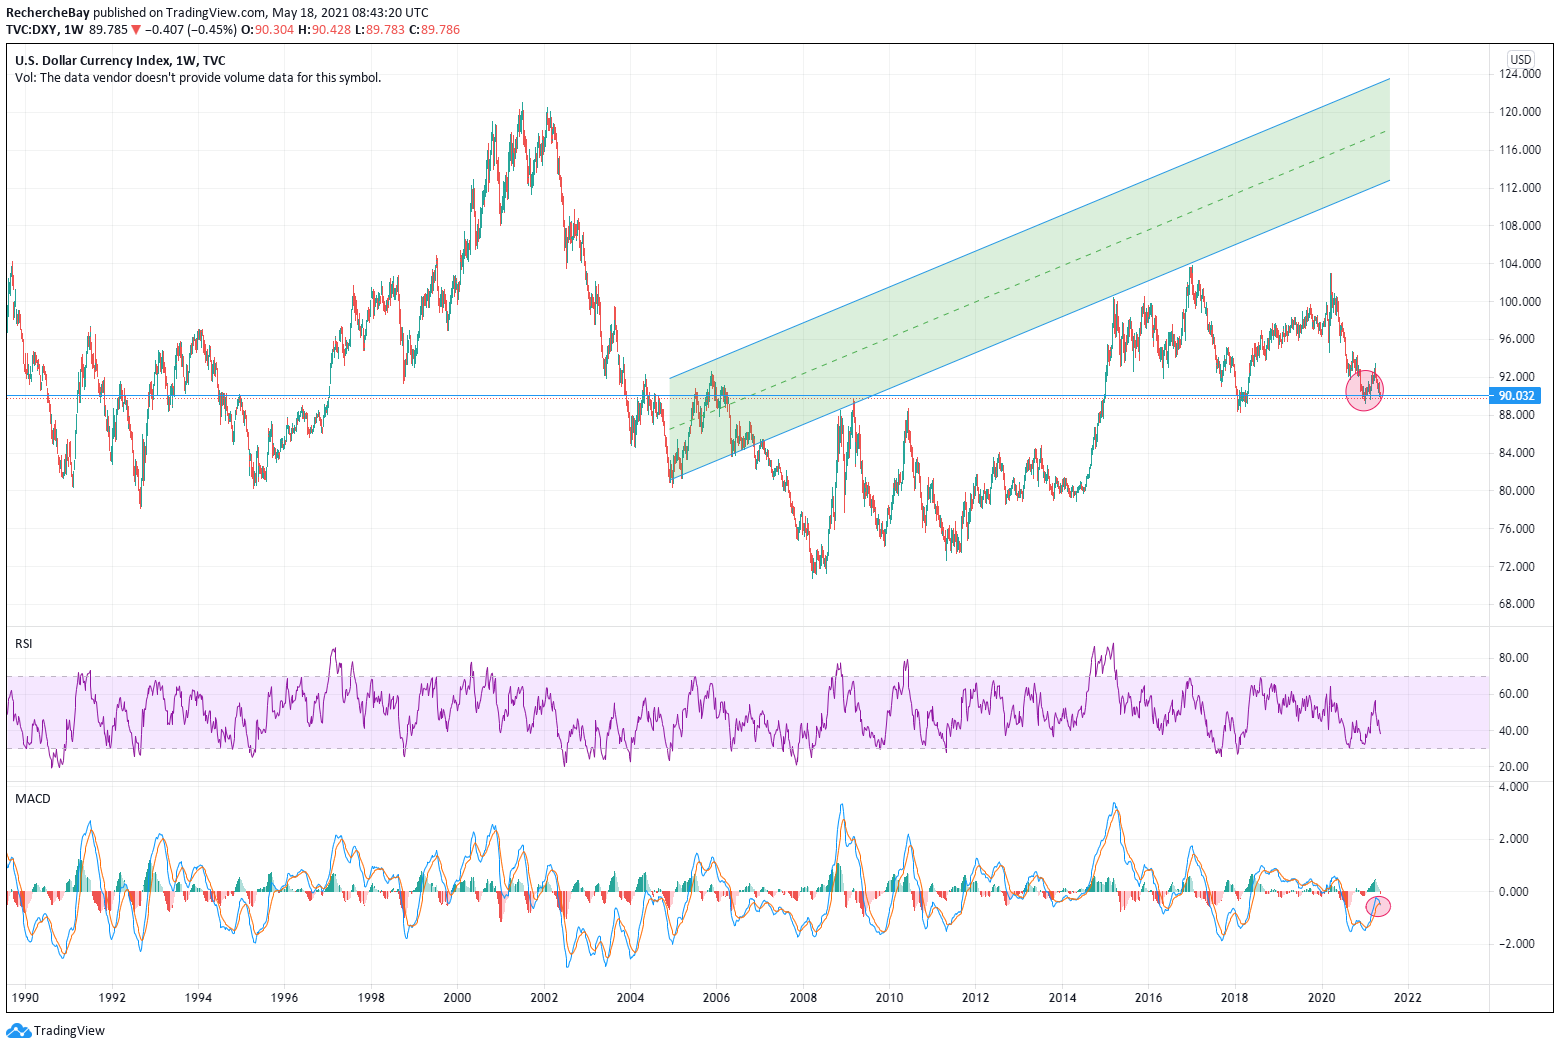
Logic dictates that not taking action, today, would incur all the risk from the situation on the value of the dollar. The markets have grasped the fact that, in the last few days, we have been witnessing a clear decline on the part of the U.S. currency.
The DXY index is in the process of testing the support of 90, for the third time, in a chart configuration that is increasingly fragile:
This risk on the dollar can be measured on the US Dollar / Canadian Dollar exchange rate. The U.S. currency is on the edge of the precipice:
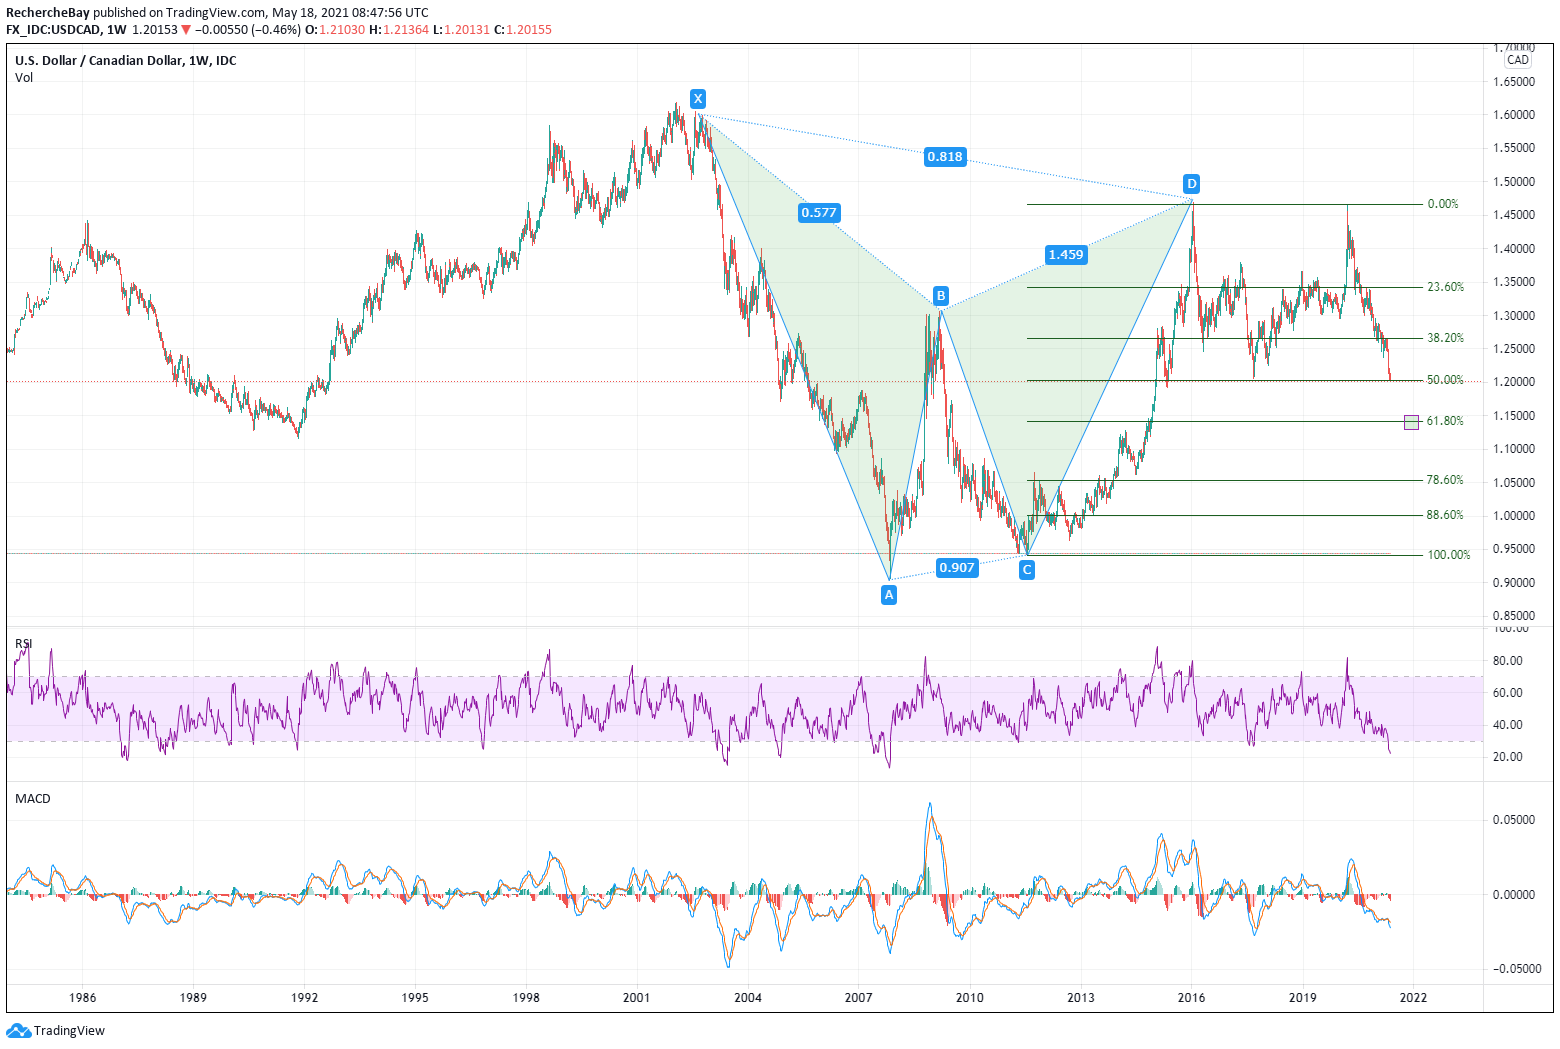
It is imperative that the Dollar bounce back to these levels. The bearish pressure is now very great, however, and if this level fails to hold up, the second target of the “Bat” harmonic figure will be within reach.
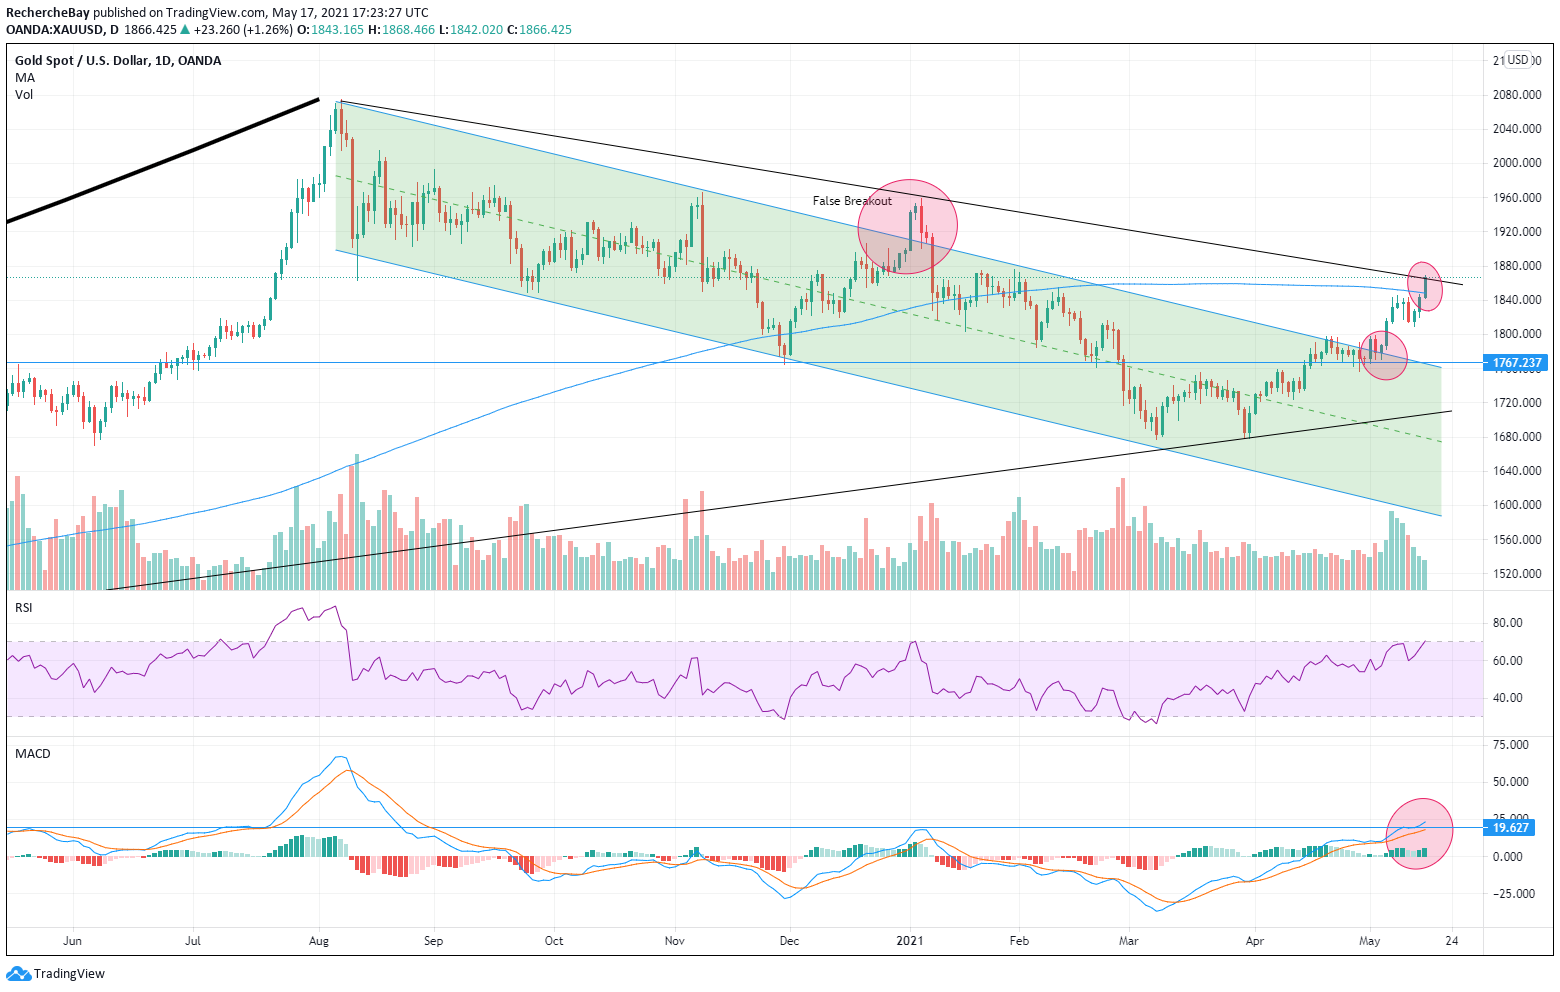
This weakness on the part of the dollar can also be measured on the gold chart, which is technically in a breakout of its consolidation phase, initiated last summer.
Gold is benefiting from two combined effects: negative real rates and the weakness of the U.S. currency:
Over a longer period, it has been observed that this breakout is unfolding on the handle of the cup, a very bullish figure in the medium-term:
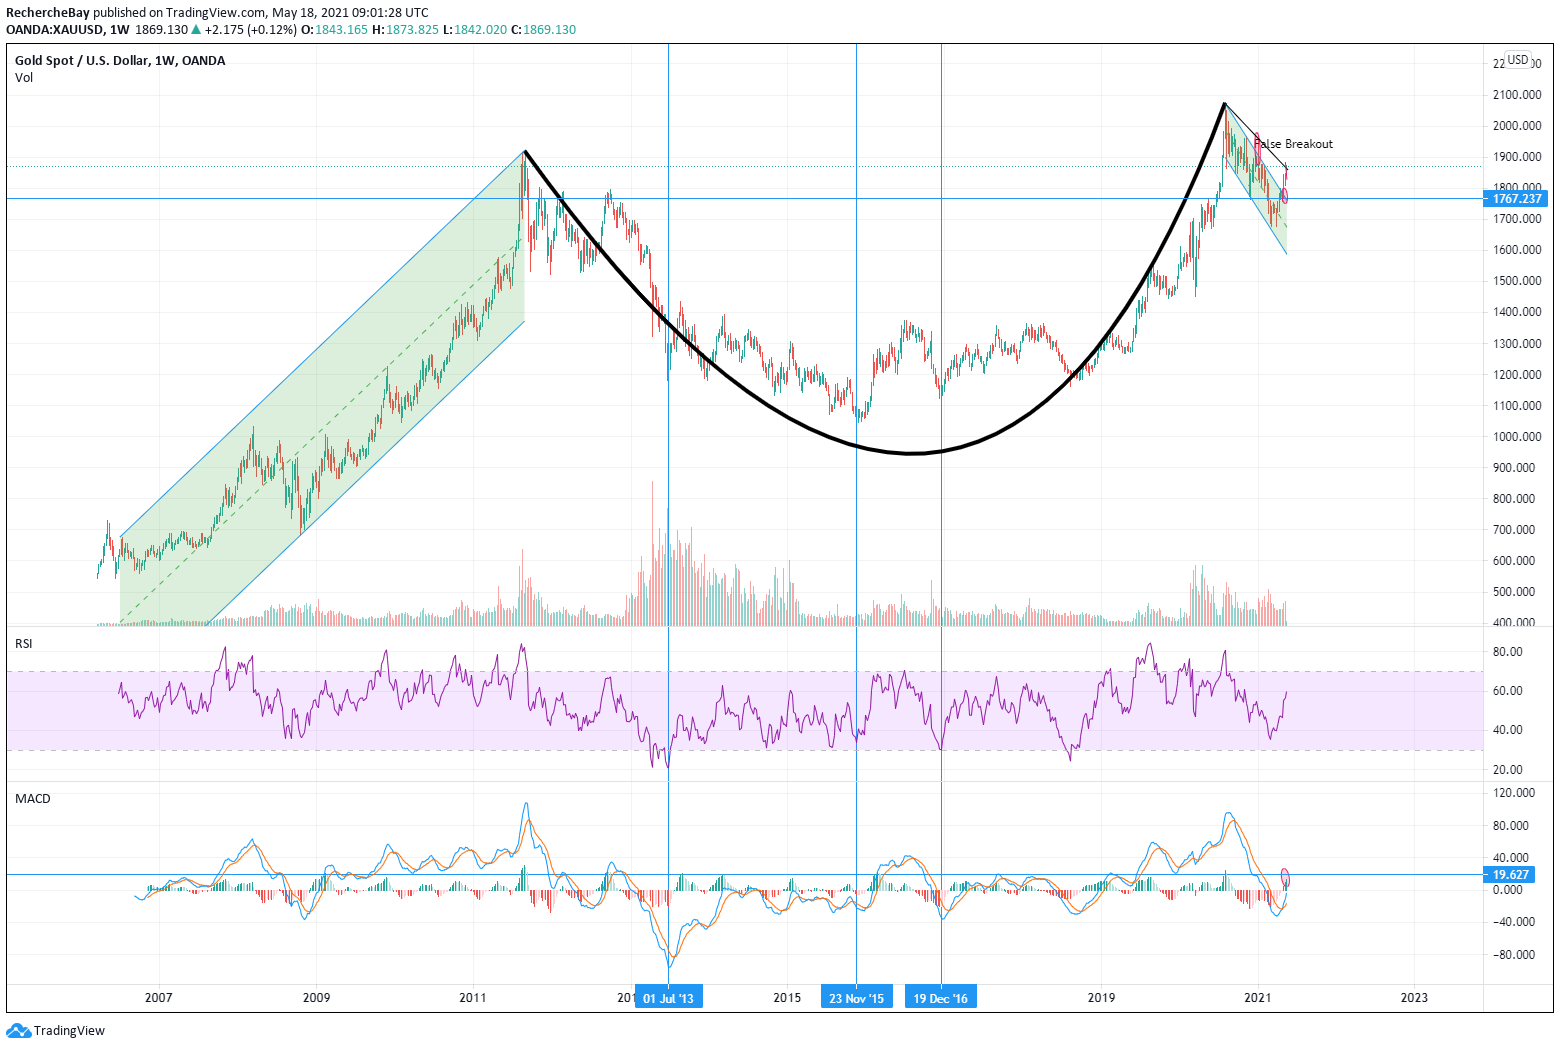
For the time being, the breakout is contained, the gold prices are relatively controlled, and the figures for inflation and the value of the dollar ought to propel gold to greater heights, something that is not the case at the moment.
This control of prices comes at a cost, however. Selling paper contracts on the Comex to keep the gold price from soaring is an increasingly costly move.
The bullion banks have no choice, though: they must defend their short positions at any cost.
This technical breakout is arriving at a bad time for these bullion banks which have short positions at levels that are far too high, and which are running the risk of heavy losses in the event of a short squeeze at these levels:
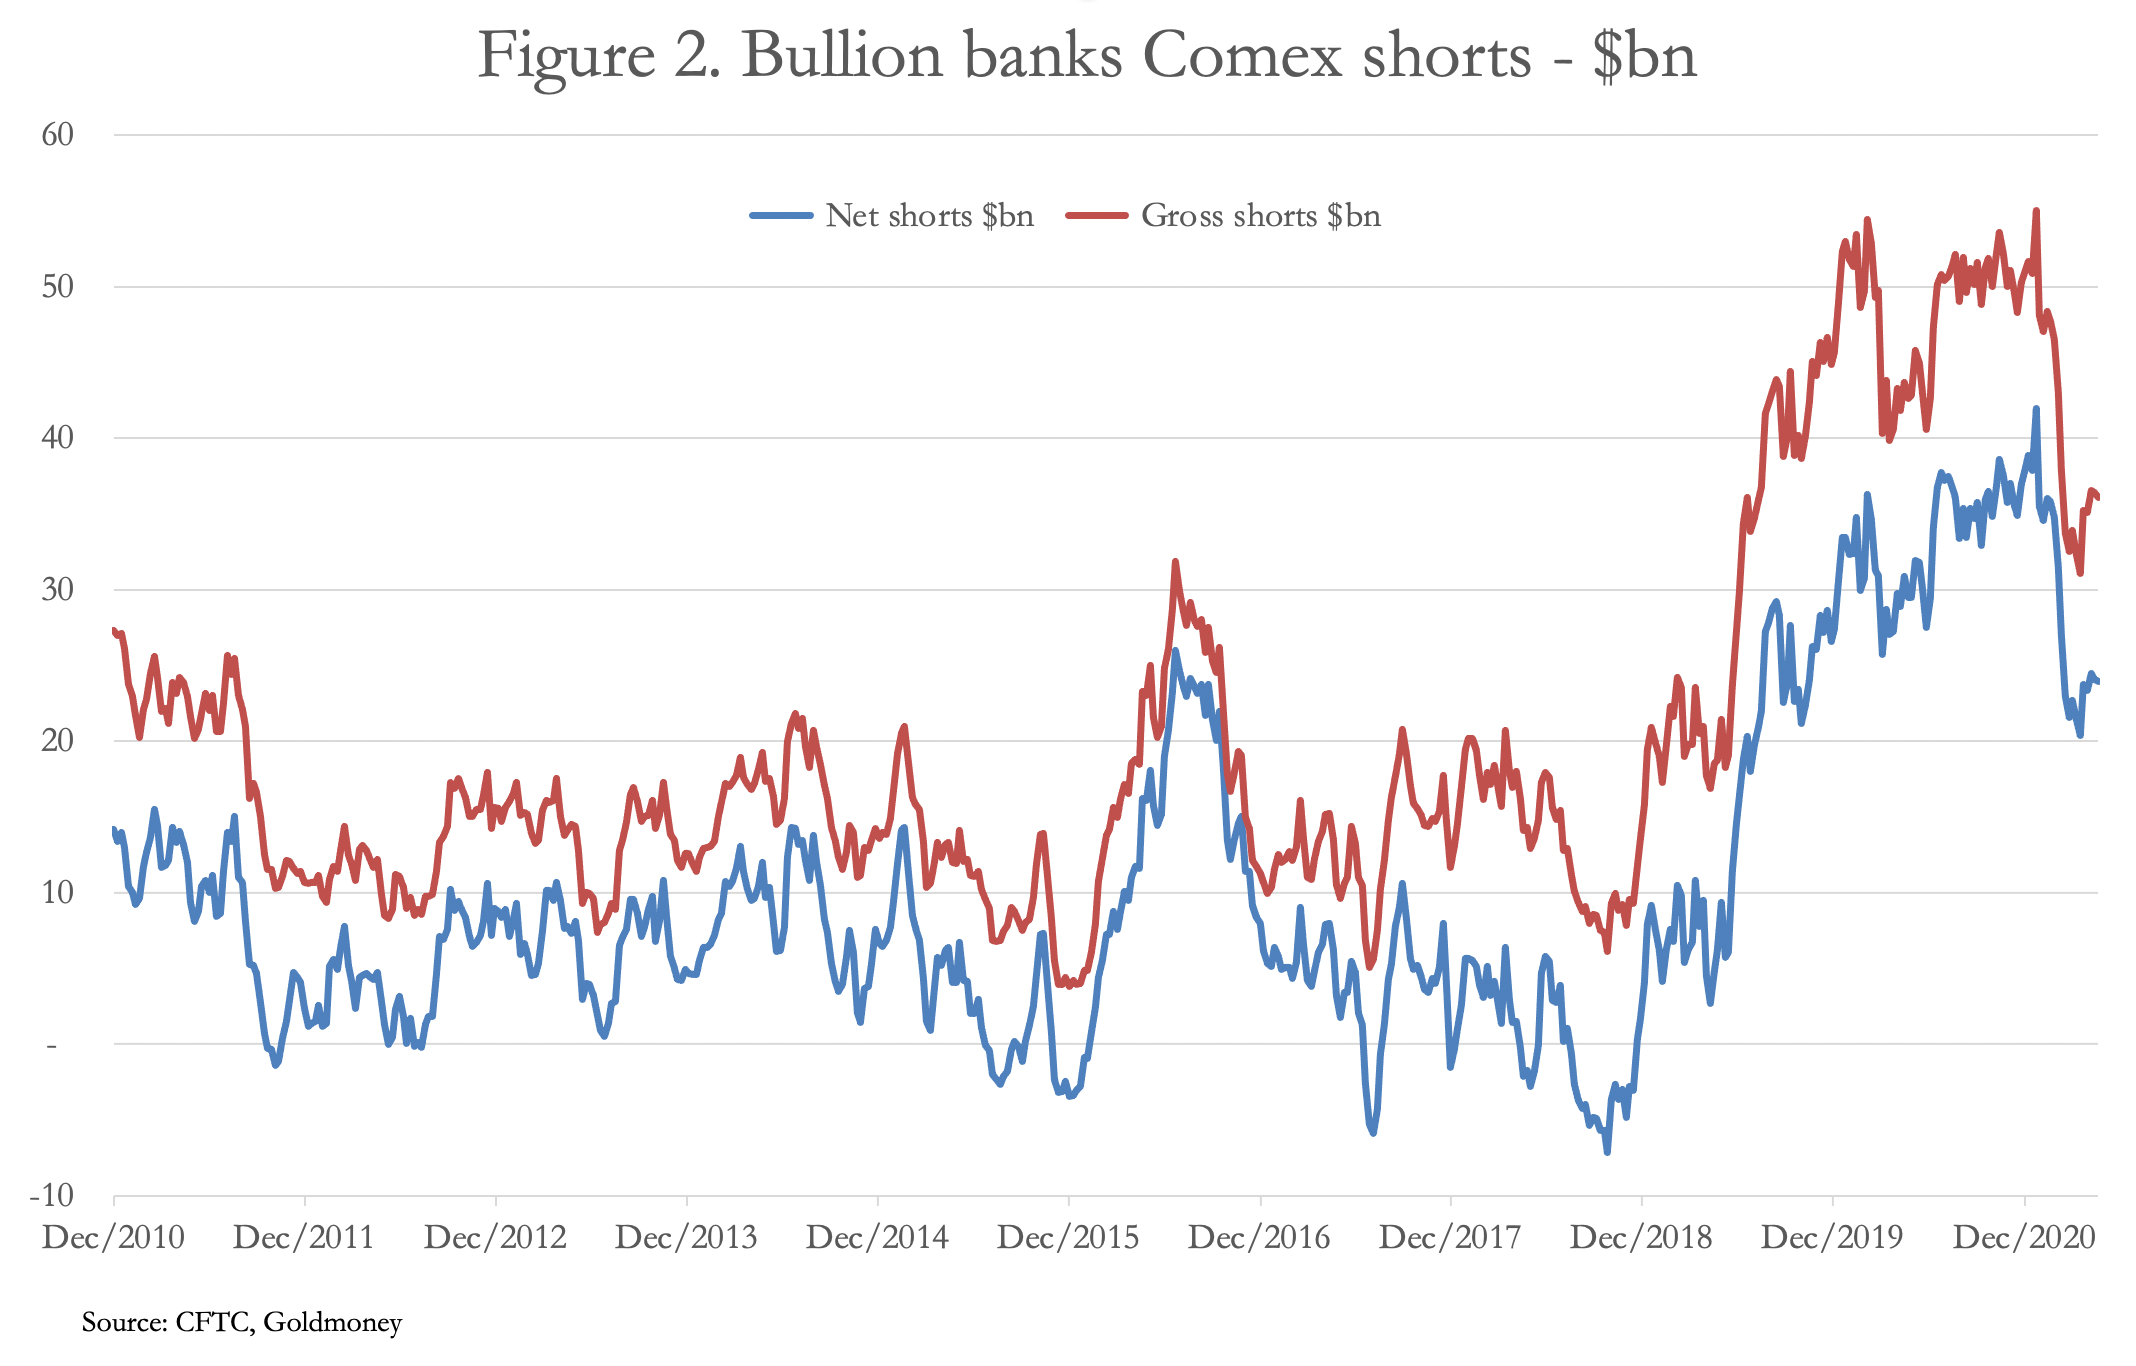
These banks have had to increase their short positions very significantly in order to control the rise since 2018.
The tension on the physical metal is continuing to grow, in parallel to this, and demand on the Gold trackers has rallied wonderfully well in recent days, with the biggest tracker, SPDR Gold Trust, bringing in an influx of investment of 6 tons last Friday, its largest daily figure since last January.
An increasing number of “paper” positions are necessary in order to contain a physical demand that is growing ever larger.
And by comparison with the latest phases of tension on the level of the gold prices, there is now another technical aspect to take into account.
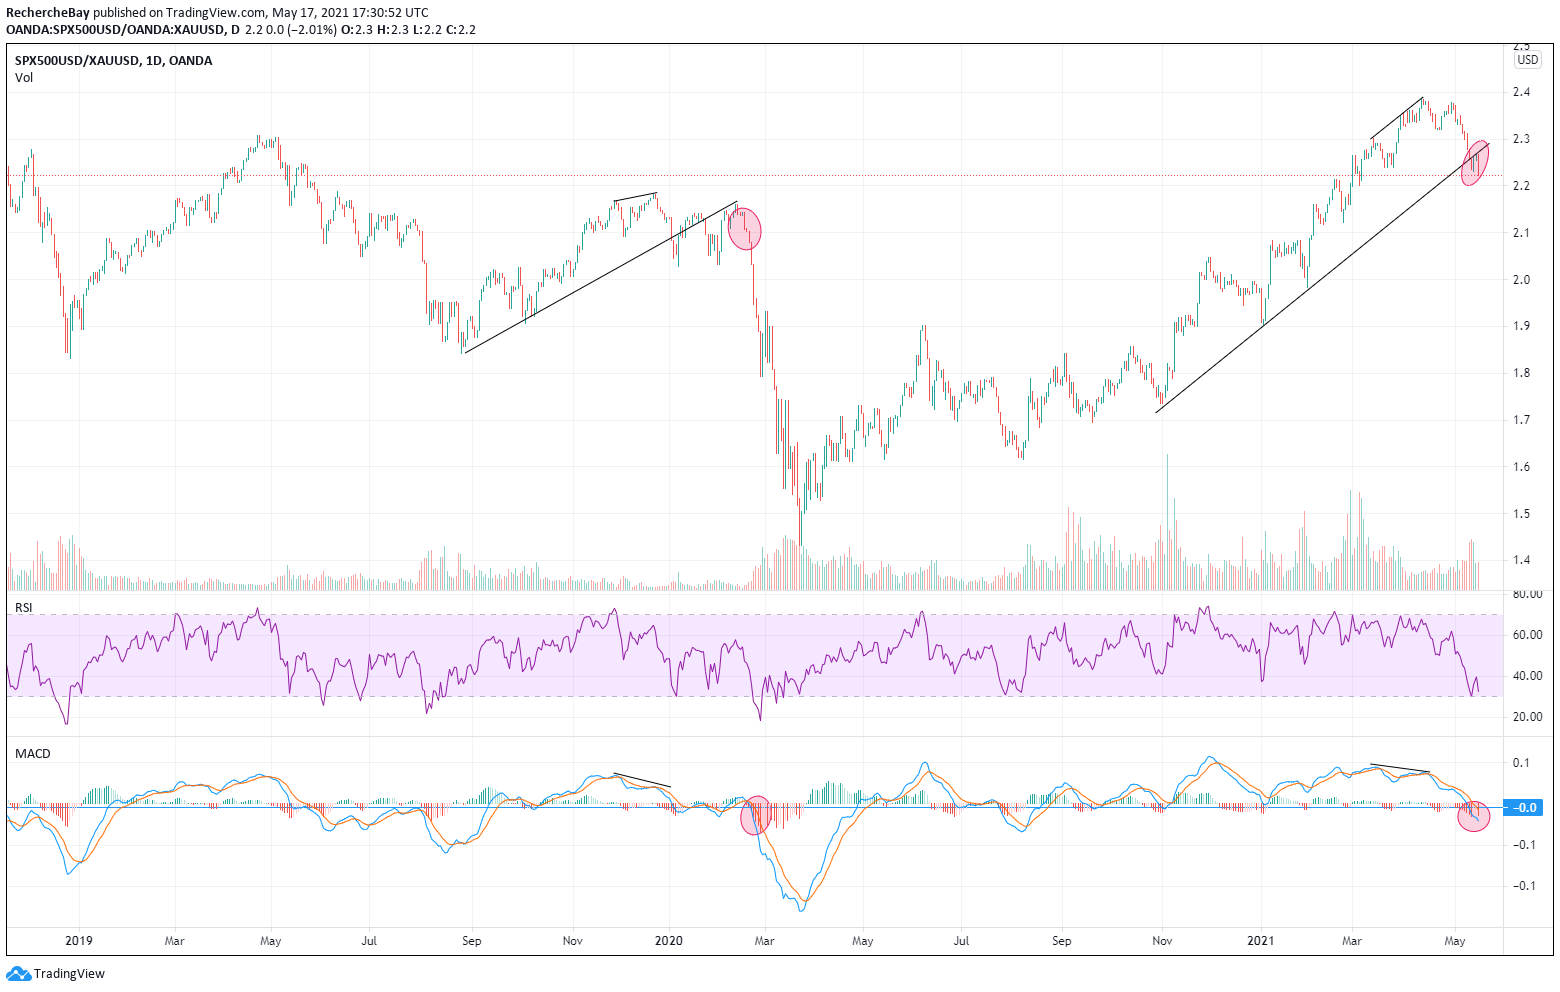
The markets are starting to perform worse than the gold prices, in a very tangible way. The markets are plunging because inflation is bringing a risk both to the real economy and also to the growth values. Not only does gold appear to be a bulwark in relation to this inflation, which is exploding, but gold is also in the process of becoming a safe haven in the face of the markets crash. As announced in our previous articles, the SP500 / Gold chart is in a phase of decline, and if the story of 2020 repeats itself, we may well see a collapse of the markets in relation to gold very soon: gold is in exactly the same chart configuration: a repelled test of the bullish support, a bearish divergence, a negative MACD...
The situation as regards silver is even more tense than the gold situation. Silver ought to be far higher in relation to the value of the dollar. Here again, controlling prices comes at a cost, which is getting ever higher. In terms of the charts, silver is on the brink of a veritable explosion; it’s absolutely vital that the current level be defended by the “shorts.” Judging by the charts, this appears far from straightforward!
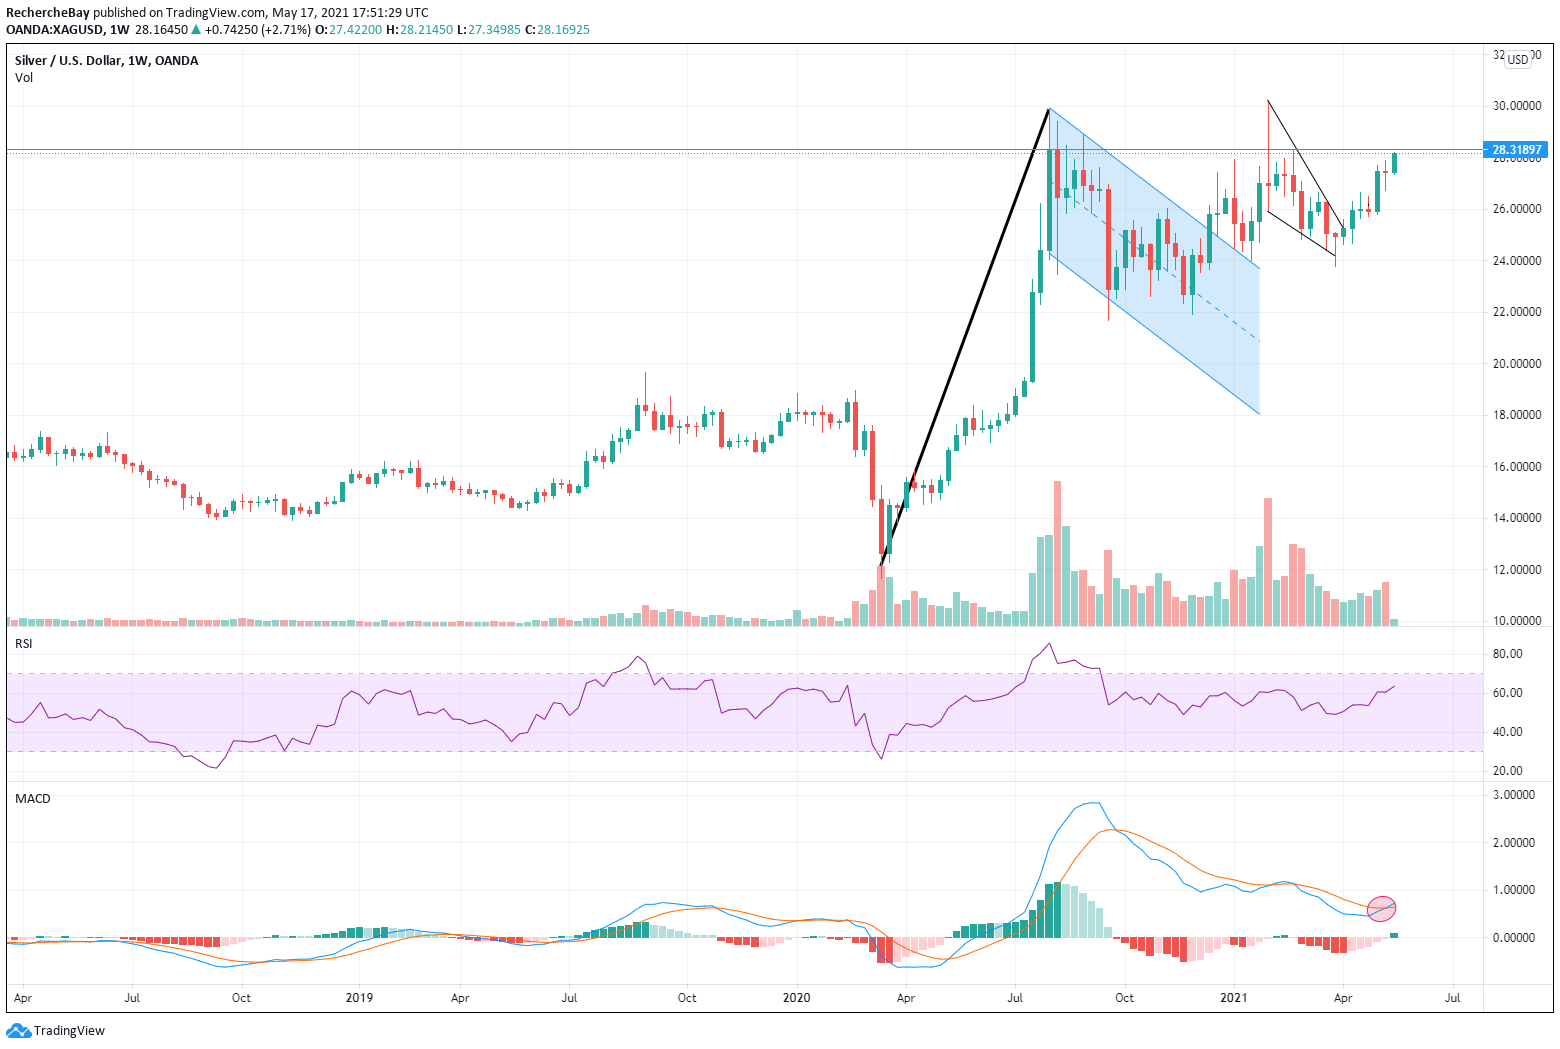
At any rate, we are now back at the same level as the Silver Short Squeeze in February, at a price level that raised so many concerns for the SLV tracker back then. And this time around, the environment we are in is even more favorable toward silver. The long positions opened on the Comex are resuming their sharp upward climb in the early part of this week, primarily on the July 2021 contract (more than 7000 contracts opened yesterday alone), even as the social networks start to spread rumors of a cash-settlement on delivery requests for the month in progress. It is very difficult to get a true picture of the stocks on the Comex; the only thing that can be said for certain at this stage is that the tension on the LBMA/Comex system will grow even more intense in the coming weeks, and that we are approaching the critical moment where this system of determining prices via the futures market will simply no longer be able to function.
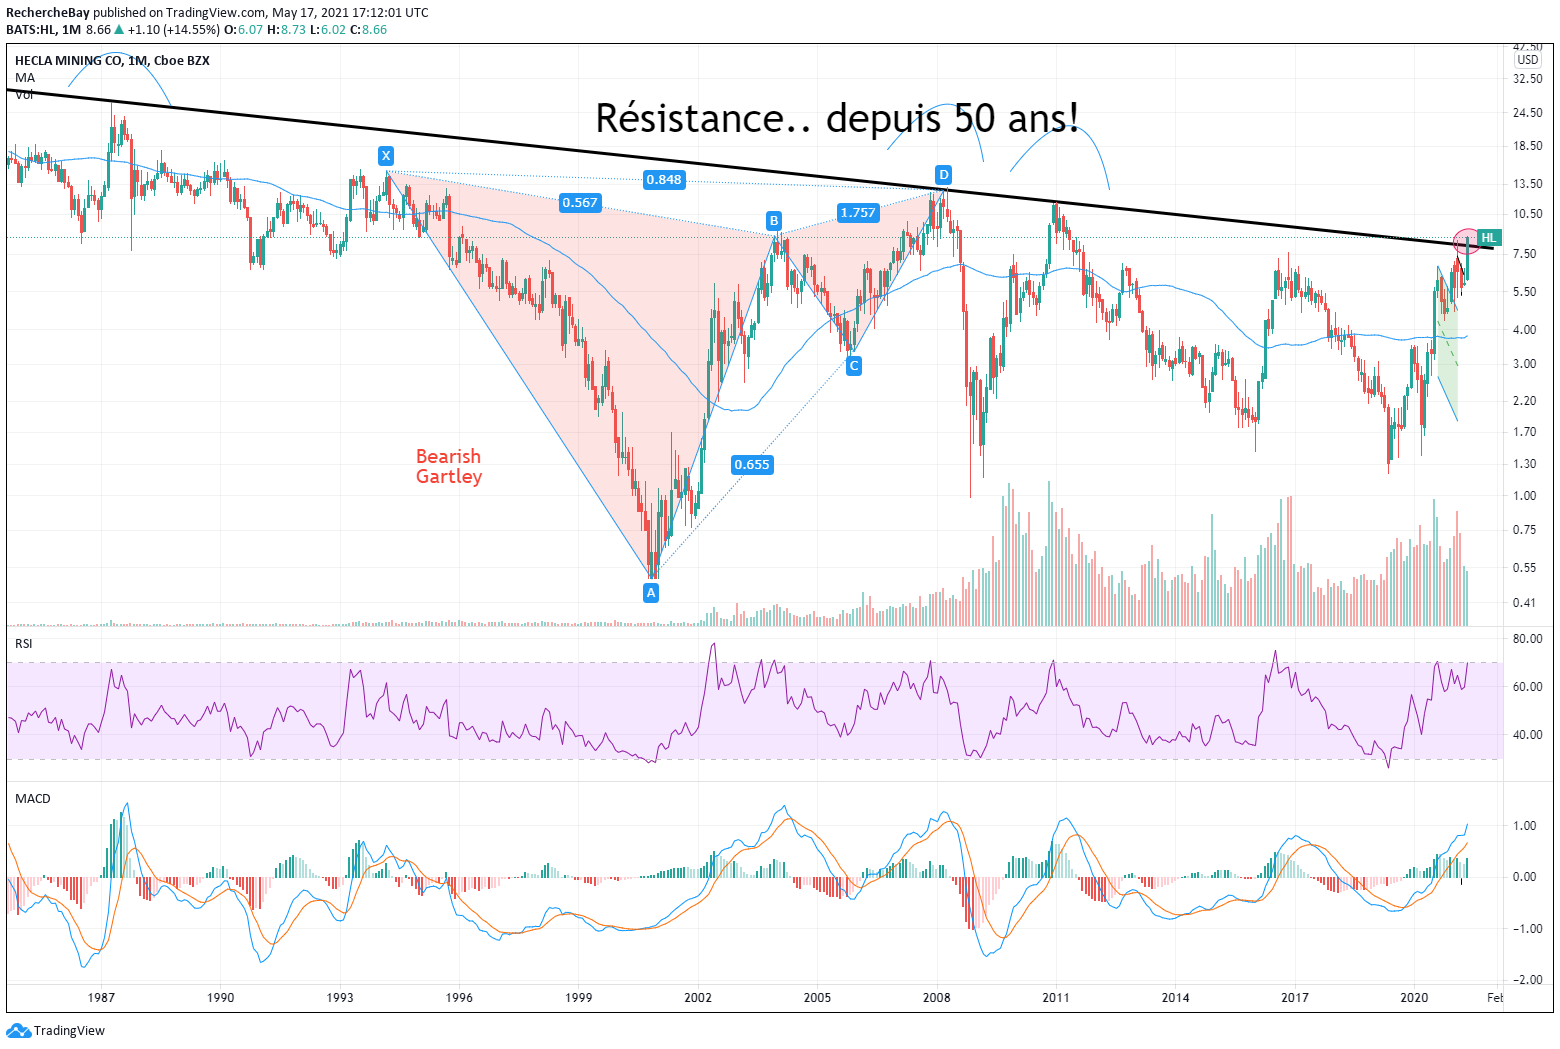
The silver mining stocks have decided, in any case, to forestall this strong upcoming increase in the silver prices. Hecla Mining is in the process of climbing above its 50-year bearish resistance. This type of chart measures the significance of the era we are currently going through in relation to silver:
This time around, this out-performance by the silver mining stocks also concerns the gold mining stocks department.
Globally, by comparison with 2020, the correction of the markets is affecting the mining stocks sector less.
The GDXJ index is even out-performing the gold price, and the chart for the flagship mining stocks index is in a double breakout this week:
Breakout of its consolidation flag:
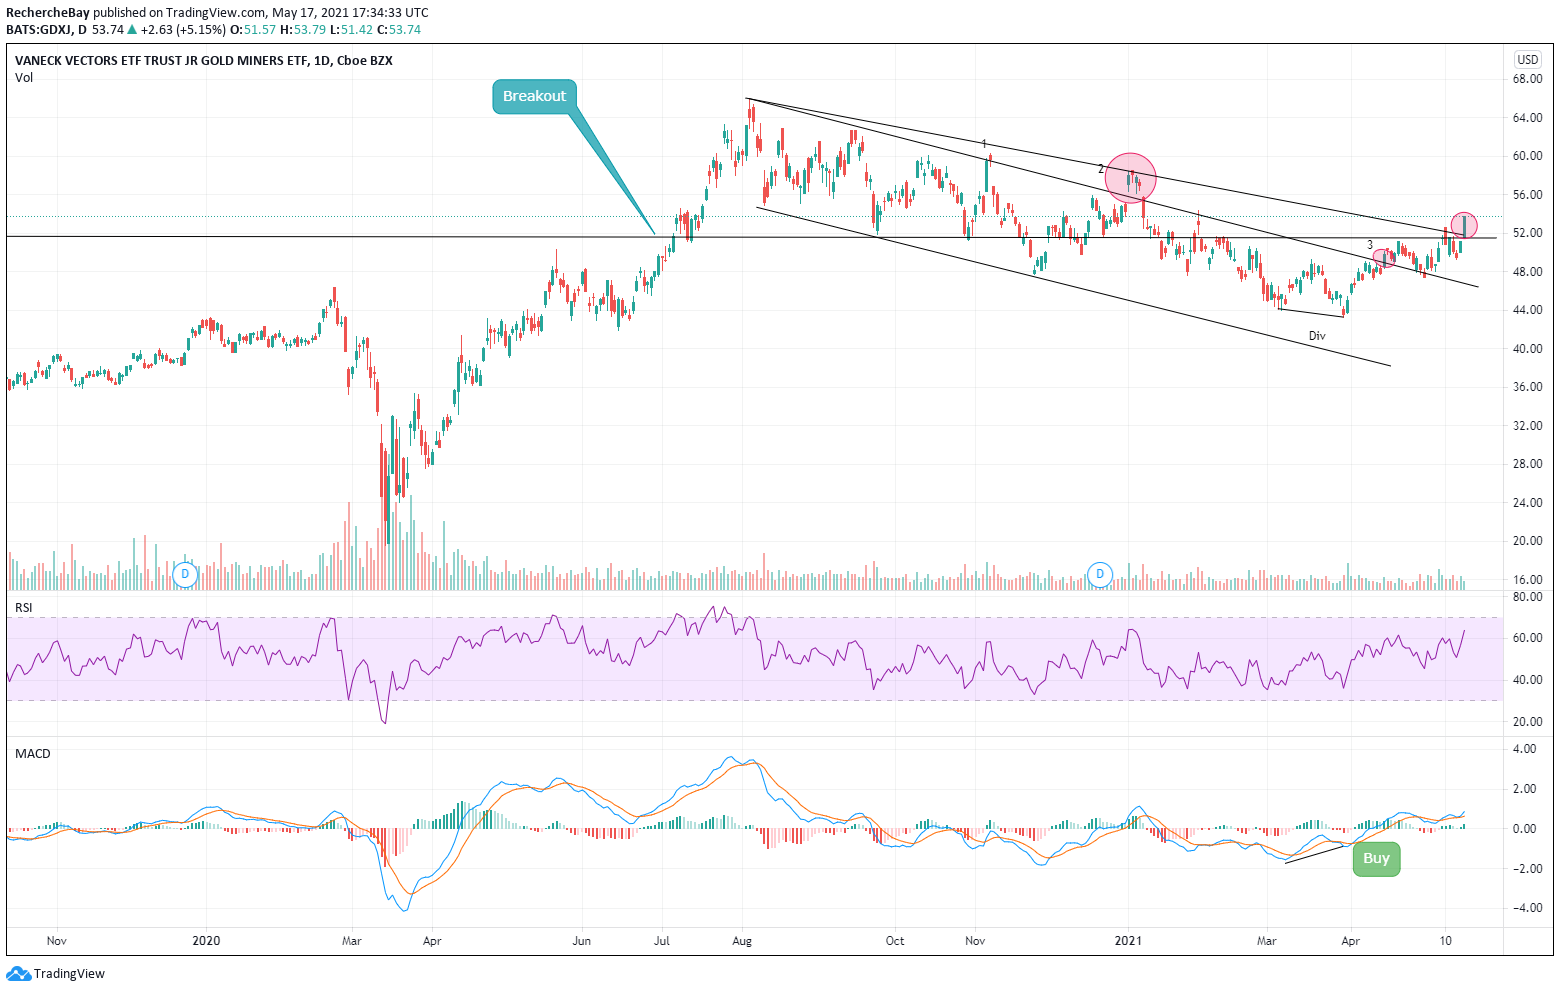
And positive test of its long-term breakout:

This performance on the part of the mining stocks is very positive for what lies ahead.
Leaders like Newmont are already at their highest points, but there are still quite a few values that have very considerable potential in terms of making up ground.
Original source: Recherche Bay
Reproduction, in whole or in part, is authorized as long as it includes all the text hyperlinks and a link back to the original source.
The information contained in this article is for information purposes only and does not constitute investment advice or a recommendation to buy or sell.


