When are economic conditions favorable for the price of gold? Are there technical configurations that are more favorable than others for buying gold?
In this paper we propose to conduct an empirical analysis that is essential to any good investor in gold. We will focus on a statistical approach based on US data. Throughout this paper we will show that:
- The moving average can be a fundamental criterion for determining one's buying zones.
- The trend in the price of gold is most pronounced over a 10-year period. The shorter the period, the more indecisive the trend.
- Stochastics, a technical tool, can be of great help in determining your buying points.
- The economic criterion of inflation is not relevant enough to determine its buying zones.
- Gold tends to correct when the economy is in good shape, but this is not a determining factor. Conversely, recessions can sometimes increase the probability of a price increase.
The 20-month moving average criterion
The trend is the investor's best ally. Measuring the trend is also made possible by using the moving average. By measuring the average price over the last 20 months, interesting buying signals appear. The chart below shows the price of gold in dollars on the one hand, and the difference between the price of gold and its 20-month moving average (red curve) on the other. In general, it is agreed that a bullish breach of the moving average implies a bullish signal.
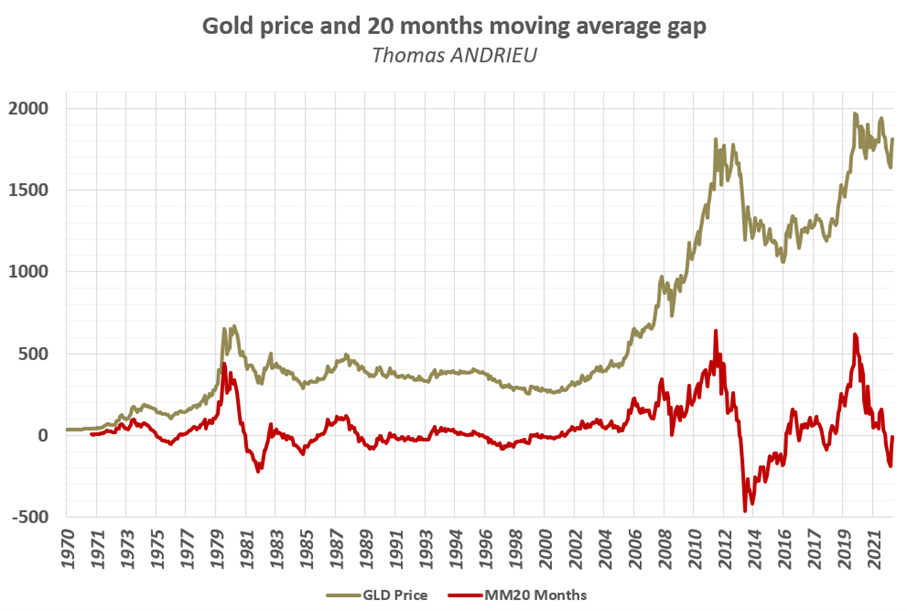
From 1970 until 2023, the price of gold remained above its 20-month moving average 62% of the time. That is, when the difference between the price of gold and its moving average is greater than zero. It is therefore reasonable to project that gold will remain mostly above this average in the future. Today, the gap between the 20-month moving average and the price of gold has gone from -40 in December 2022 to +10 in January 2023. We are therefore in the presence of a bullish signal.
We can therefore project the following developments:
- In the scenario of a reasonable bullish development, the gold price could reach the range of $1,900 to $1,950.
- In case of a relatively strong bullish trend. If the gap between the price and the moving average reaches +$250, then the price of gold could settle around $2,060. This is the last historical high.
- In the event of a bullish excess, as was the case in 1980 or 2010, then the price of gold would go for $2,300 to $2,400. These levels are therefore, statistically at least, possible.
- Finally, a rather bearish scenario would emerge if the price of gold remains below $1,800 per ounce for a long time.
What is the most effective moving average for gold?
We have performed a series of calculations to bring to light data that has never been uncovered before. We have seen that the moving average is an essential criterion for investment decisions. In fact, the longer the average goes back, the greater the probability of being above it if the trend is up. Each moving average (from the 20-month moving average to the 240-month moving average) was plotted in the chart below. The amount of time (in %) spent above each moving average was then calculated.
The interest of this analysis is therefore very high. In effect, the longer the time above the moving average, the more bullish and stable the trend. From the chart, we can see that the trend is not the strongest between 20 months and 110 months. That is, the trend in the price of gold is relatively more unstable over periods of one to nine years. To be sustainably bullish (with a 70% probability of being above the moving average), gold needs to be viewed from at least a 10-year perspective!
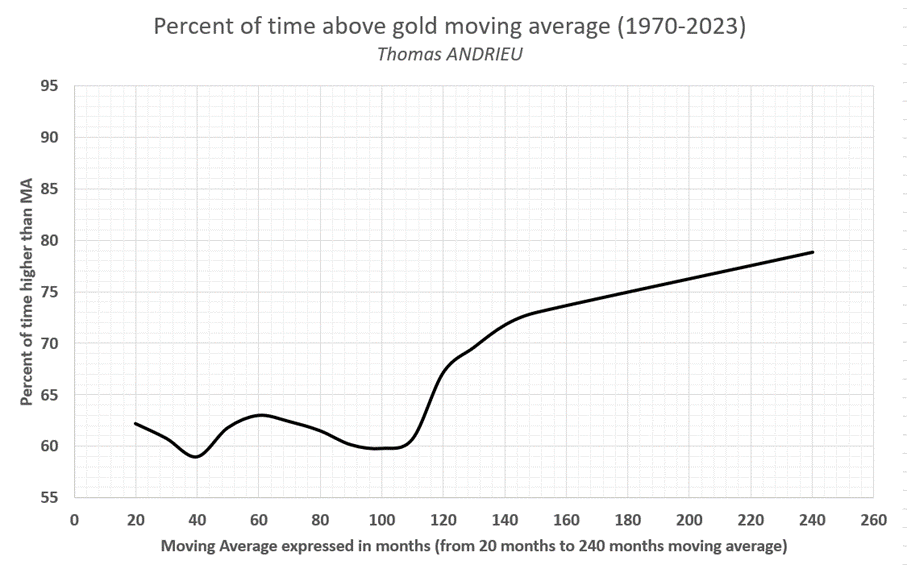
Moreover, we can see through this study that the most interesting moving averages for obtaining investment signals are the 20-month moving average, then 60 months (5 years), and beyond 120 months (10 years). Note also that for the 120-month moving average, the price of gold remains above this moving average more than 70% of the time.
Stochastics
Stochastics is a tool traditionally used in finance. Although this tool is more suitable for periods of stagnant prices, its application in the long term is just as relevant. Moreover, its calculation is relatively simple and can be done manually and promptly. The stochastic is calculated, over the last chosen period, as follows:
Stochastic = 100 x [(last price - minimum) / (maximum - minimum)]
Its calculation simply compares the current price to the last high or low of the period under consideration. The value of the stochastic evolves between 0 and 100. In general, 20 and 80 are major thresholds. We have therefore applied the stochastic over the last 24 months (2 year stochastic) and compared its evolution with the gold price.
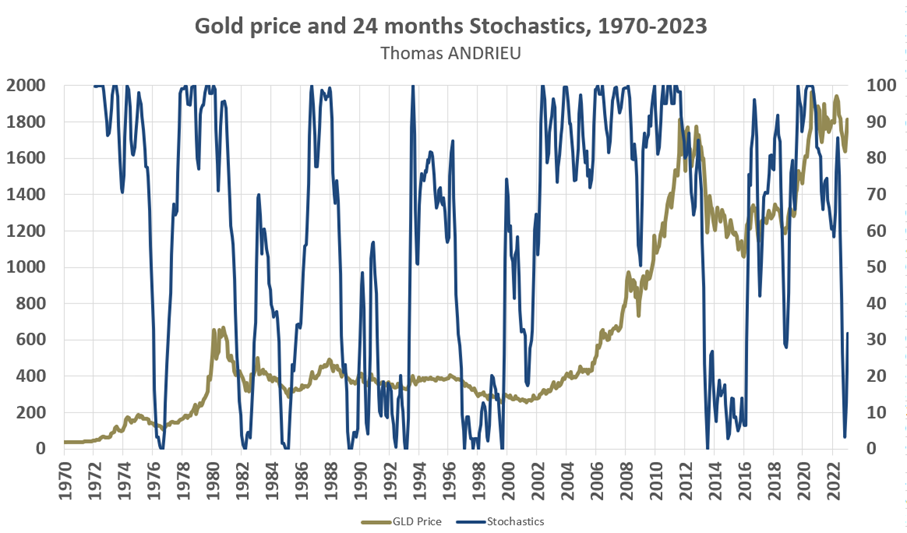
The chart shows the price of gold with the value of the 24-month stochastic (right axis). Since 1970, the stochastic has only fallen below the 20 line eight times. These levels have always been very interesting long-term buying areas. The dates when the stochastic showed an extreme decline were: 1976, 1982, 1985, 1989-1992, 1997-2000, 2013-2016, and most recently November 2022. (See our November 2022 article). The periods between the buying zones on gold since 1970 are six years, three years, six years, seven years, and 15 years respectively (seven years on average). Buying gold every 7 to 10 years is another, more simplistic approach.
In this configuration, gold remains on interesting levels although the extent of the movement to come is not informed by the stochastic. On the other hand, it is an indispensable tool to optimize its long-term buying zones.
It is important to note that the stochastic is an indicator that works during market stagnation. That is to say that a stochastic close to 100% will not mean that the market will go down. On the contrary, a high stochastic often results in successive new highs. Thus, stagnation zones in the gold price are often buying zones (buying zones being more extensive than selling zones).
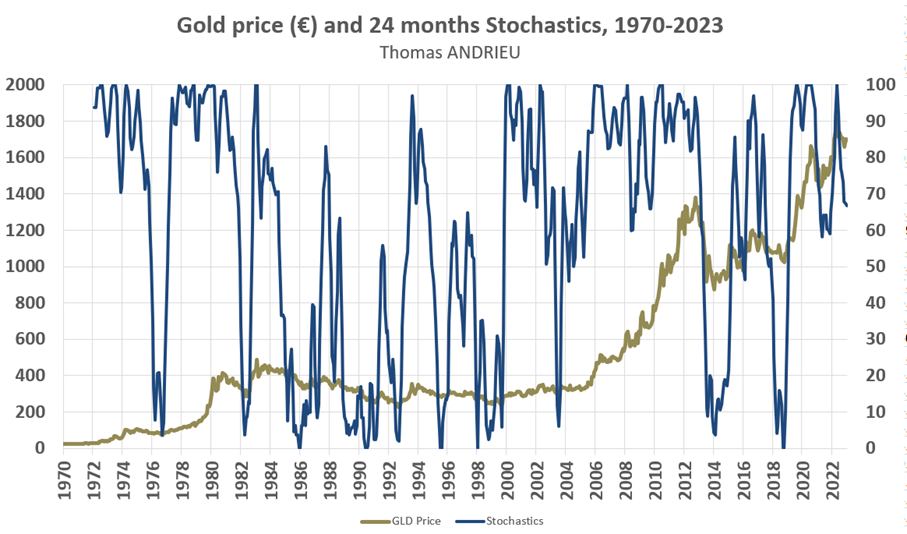
If we look at the price of gold in euros, the stochastic shows a relatively different pattern. Moreover, gold in euros has largely reached new historical highs due to the weakness of the currency. The current buying opportunities are therefore less interesting than for the dollar. Furthermore, it should be noted that the stochastic of gold in euros reaches the 0 line less often. This means that the price of gold in euros tends to be close to its historical highs more often. In other words, the euro is devaluing.
The criterion of inflation and recessions
We have looked at technical indicators for investment criteria. But it is also interesting to look at the economic factors.
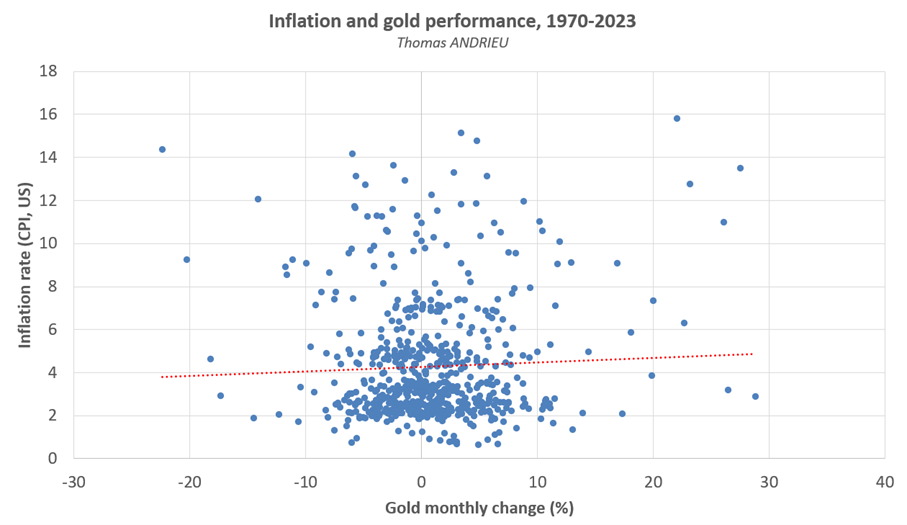
As we pointed out in our previous article, there is no real link between inflation and the price of gold. The chart below compares the performance of the gold price (horizontal axis) and the level of inflation (vertical axis). However, it is interesting to note that higher inflation generates rather extreme trends (bullish or bearish) in the price of the yellow metal.
Now let's compare gold's performance with an indicator that is well known to economists. This is the spread between the 10-year bond rate and the 2-year bond rate. This spread, normally positive, reflects the fact that investors are more confident in the present than in the future. But when a recession is coming, investors prefer to invest for the long term, which implies a negative spread (10-year - 2-year). In theory, the gold price would perform better when this spread is negative.
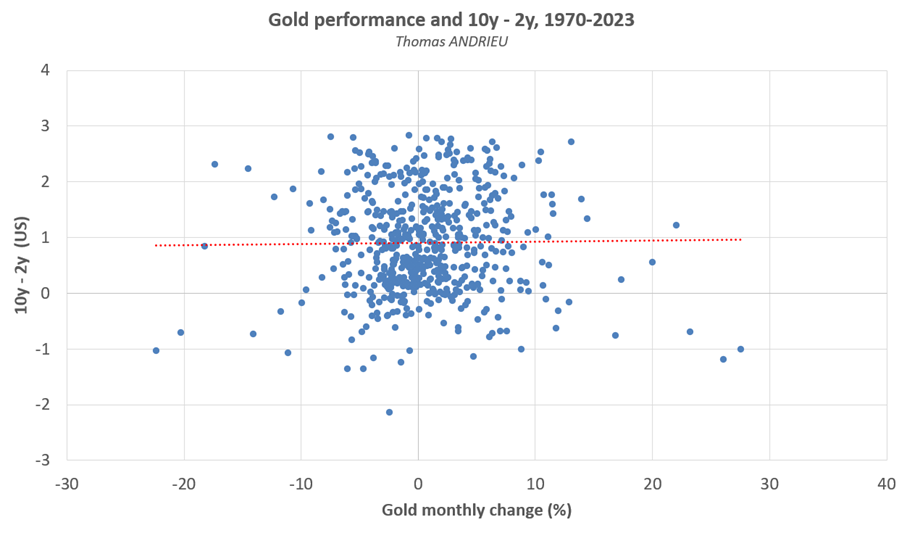
Now, we observe that a negative 10-year - 2-year spread is generally a harbinger of recessions. But this negative spread has no real impact on the performance of gold. It does, however, amplify extreme variations in the price of gold.
Growth with the behavior of gold
A common belief among investors is the strong performance of gold during recessions. In fact, of the eight "recessions" in nominal GDP since 1970, only two have been accompanied by a decline in the price of gold. The chart below shows the annual change in U.S. nominal GDP (unadjusted for inflation, vertical axis), and the performance of the gold price (horizontal axis). Decreases in nominal GDP are plotted below the 0% level on the vertical axis.
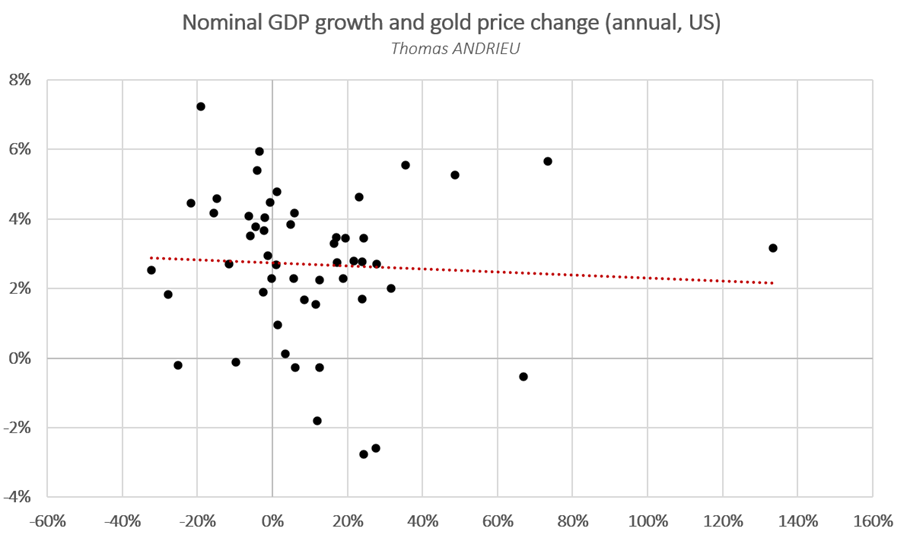
In addition, gold's performance is most often negative when nominal GDP growth is between 2% and 8%. In other words, growth can work against the gold price. Finally, it is important to note that over the period 1970-2021, nominal GDP in the United States has increased 21 times. Gold, on the other hand, has increased 52 times. In other words, gold is outperforming the U.S. nominal GDP by a factor of two...
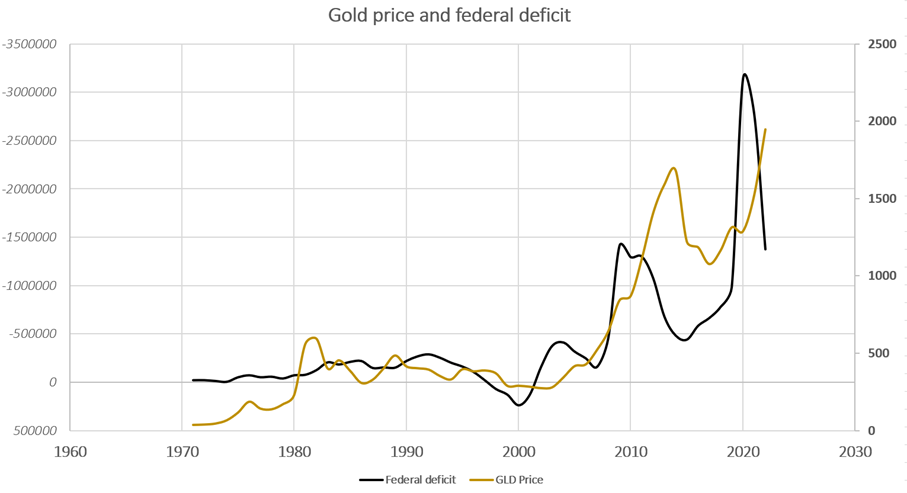
Moreover, we notice a more or less direct link between the evolution of the gold price and the public deficits. The graph above compares the price of gold (yellow curve) with the inverted US federal deficit (black curve). The more the deficit increases, the more gold rises. In fact, the rise in the U.S. federal deficit is the most common predictor of gold's rise. As the gold price data stops in 2021, we can see that the decline in the deficit in 2021 was indeed accompanied by a relative correction in gold in 2022.
A link to the stock market?
The final question that arises is whether there is a real link between the stock market and the price of gold. It appears that the price of gold is generally more dynamic during periods of stock market contraction. Although there is a correlation between gold and the stock market (in this case the Dow Jones), this link is not obvious.
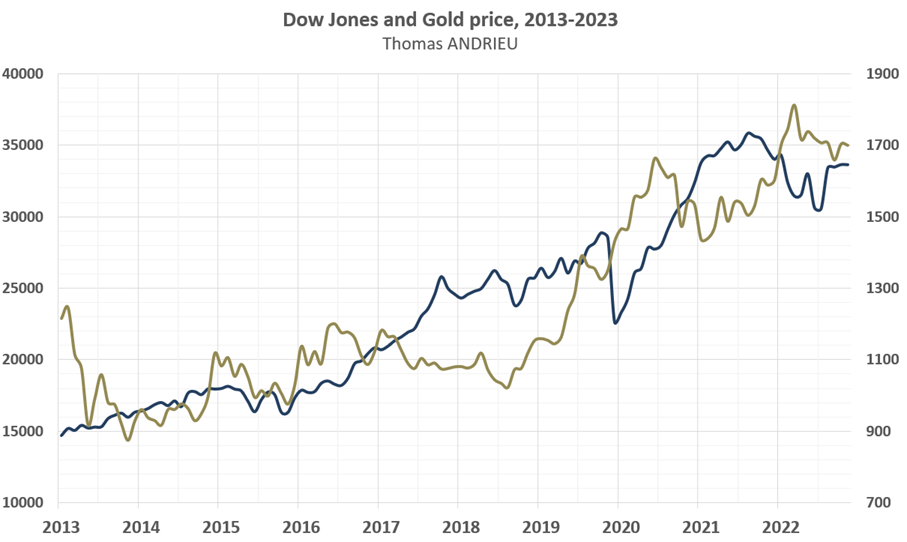
In the short term, of course, gold is more correlated to the movements of the Dow Jones than in the medium term. But large divergences between the gold price and the Dow Jones can emerge during periods of economic downturn. Over the last ten years since 2013, the price of gold has performed +40%. At the same time, the Dow Jones has risen +130%. It is easy to see why gold trends become more interesting beyond ten years.
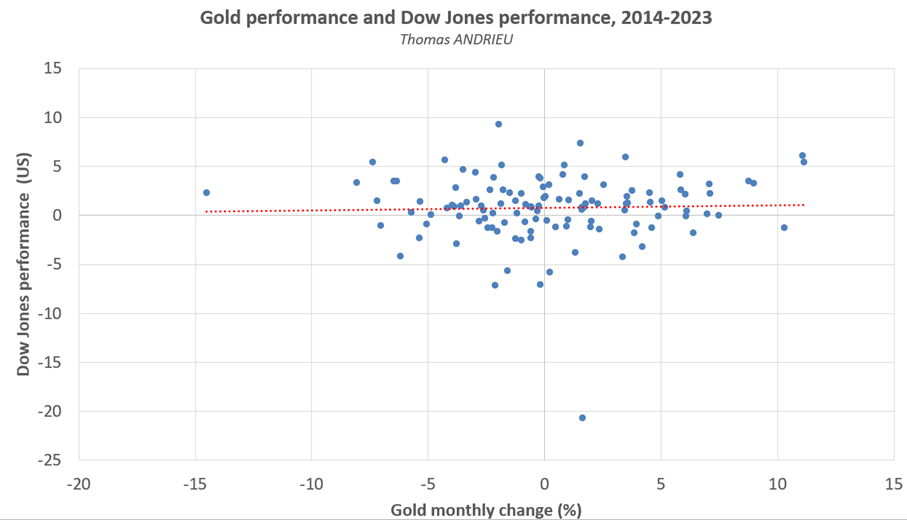
The above chart confirms that the performance of gold is not immediately linked to the performance of the stock market. It would obviously be pointless to point out that gold does not pay dividends. But we notice that where the performance of the stock market is strongly negative, gold is rather resilient.
In conclusion
In conclusion, our study focused on two types of criteria to define potential buying zones for gold. On the one hand, we studied the fundamental statistical indicators. Their relevance has been demonstrated, but we will nevertheless note the importance of long trends in the gold price.
In addition, we have used stochastics to highlight the buying zones in a clear way. The buying zones on the gold price (in dollars) are often repeated every six to nine years (two to three Kitchin cycles). Stochastics remains a reliable way, and with a one-time calculation, to highlight interesting periodicities.
On the other hand, we have studied the relevance of the economic criterion (inflation, rates, growth, stock market). The evolution of inflation or the stock market do not seem to us to be sufficient criteria to determine buying zones on gold. Moreover, growth can show a tendency for the gold price to remain resilient, and often to outperform the stock market during downturns. We have put the subject in a state that can be presented to practice.
Reproduction, in whole or in part, is authorized as long as it includes all the text hyperlinks and a link back to the original source.
The information contained in this article is for information purposes only and does not constitute investment advice or a recommendation to buy or sell.


