Let’s turn the spotlight this week onto the chart analysis of gold:
Gold stopped its bullish drive in August 2020 and then began a period of consolidation that it attempted to pierce in January 2021, without much success.
In March, gold tested its long-term bullish support on two occasions, without managing to pierce it.
In May, gold finally ended its long consolidation phase with a breakout that was significant and validated. This breakout was re-tested this summer twice, as is often the case. The second test of this breakout pressed down the long-term support and even sketched a false breakdown which tripped up short speculators.
Today, gold is at the level of its long-term line of increase.
Here is a detailed illustration of what has happened over the last few months:
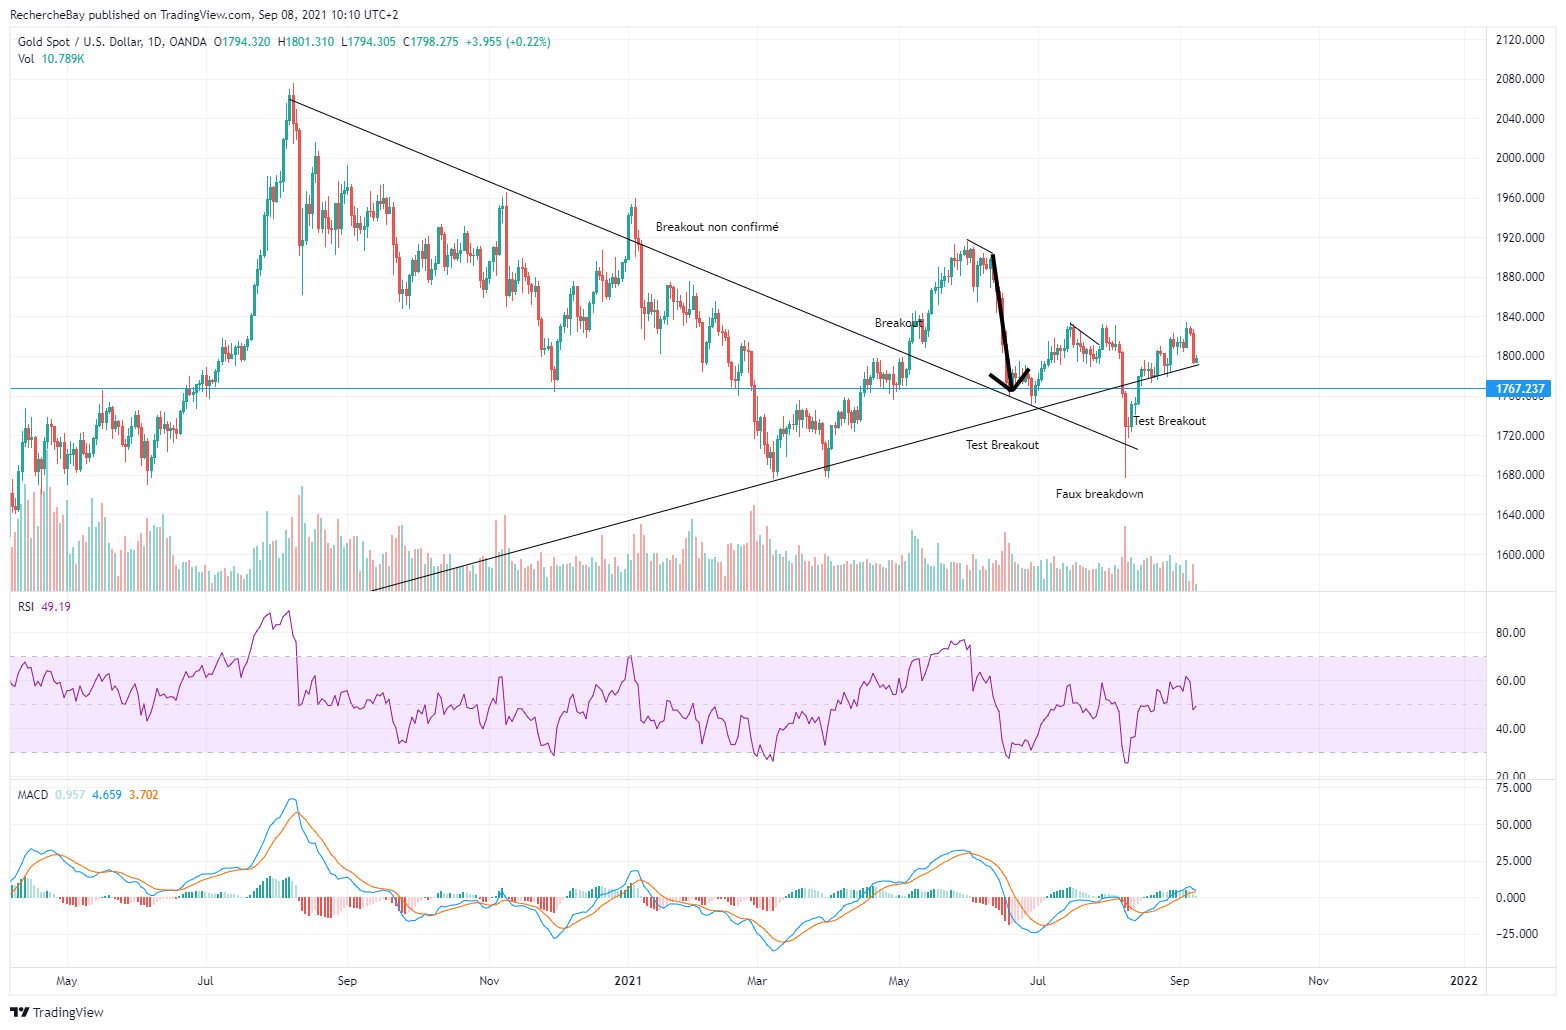
The latest false breakdown unfolded on a negative divergence which is currently putting the brakes on any more significant downturn in the gold prices.
If one looks at the positions on the futures market, one notes that quite a few firms have closed their short positions. By contrast, the speculators are fairly short, and this is a fairly bullish sign for what may happen next.
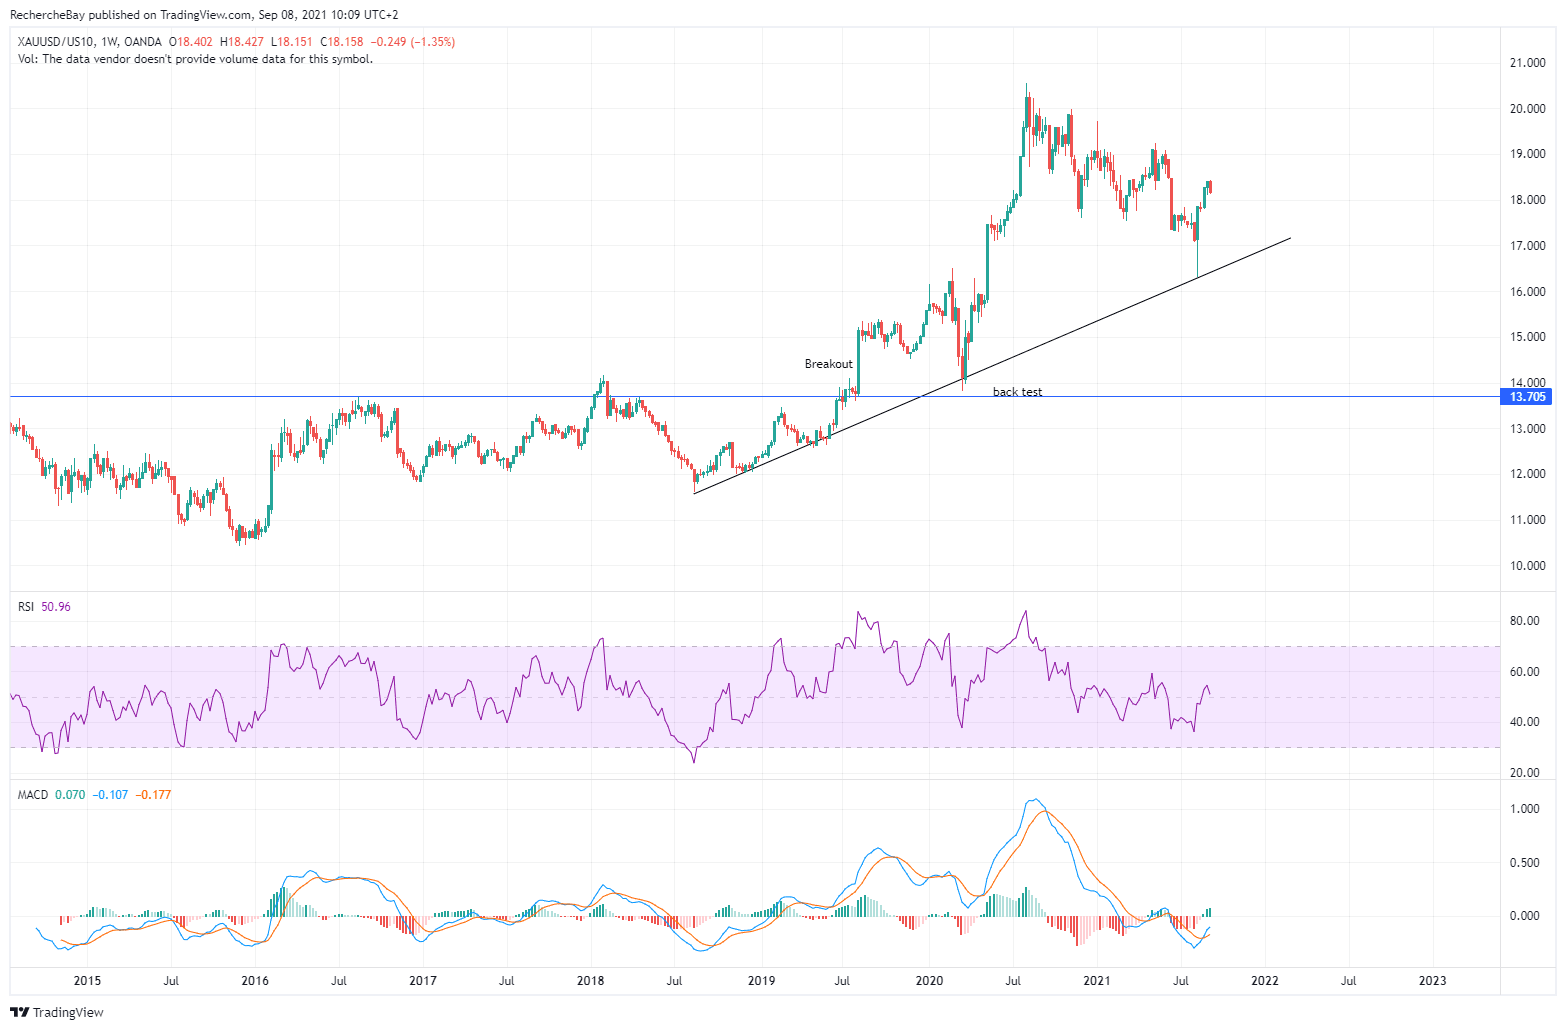
Let us take a look now at gold’s behavior compared to that of the US yields. The summer of 2019 saw a breakout by gold compared to the 10-year yields, and this propelled gold into its new phase of increase. This bullish trend was tested on two occasions; the latest test, this summer, was very brief and produced a significant bullish MACD crossover.
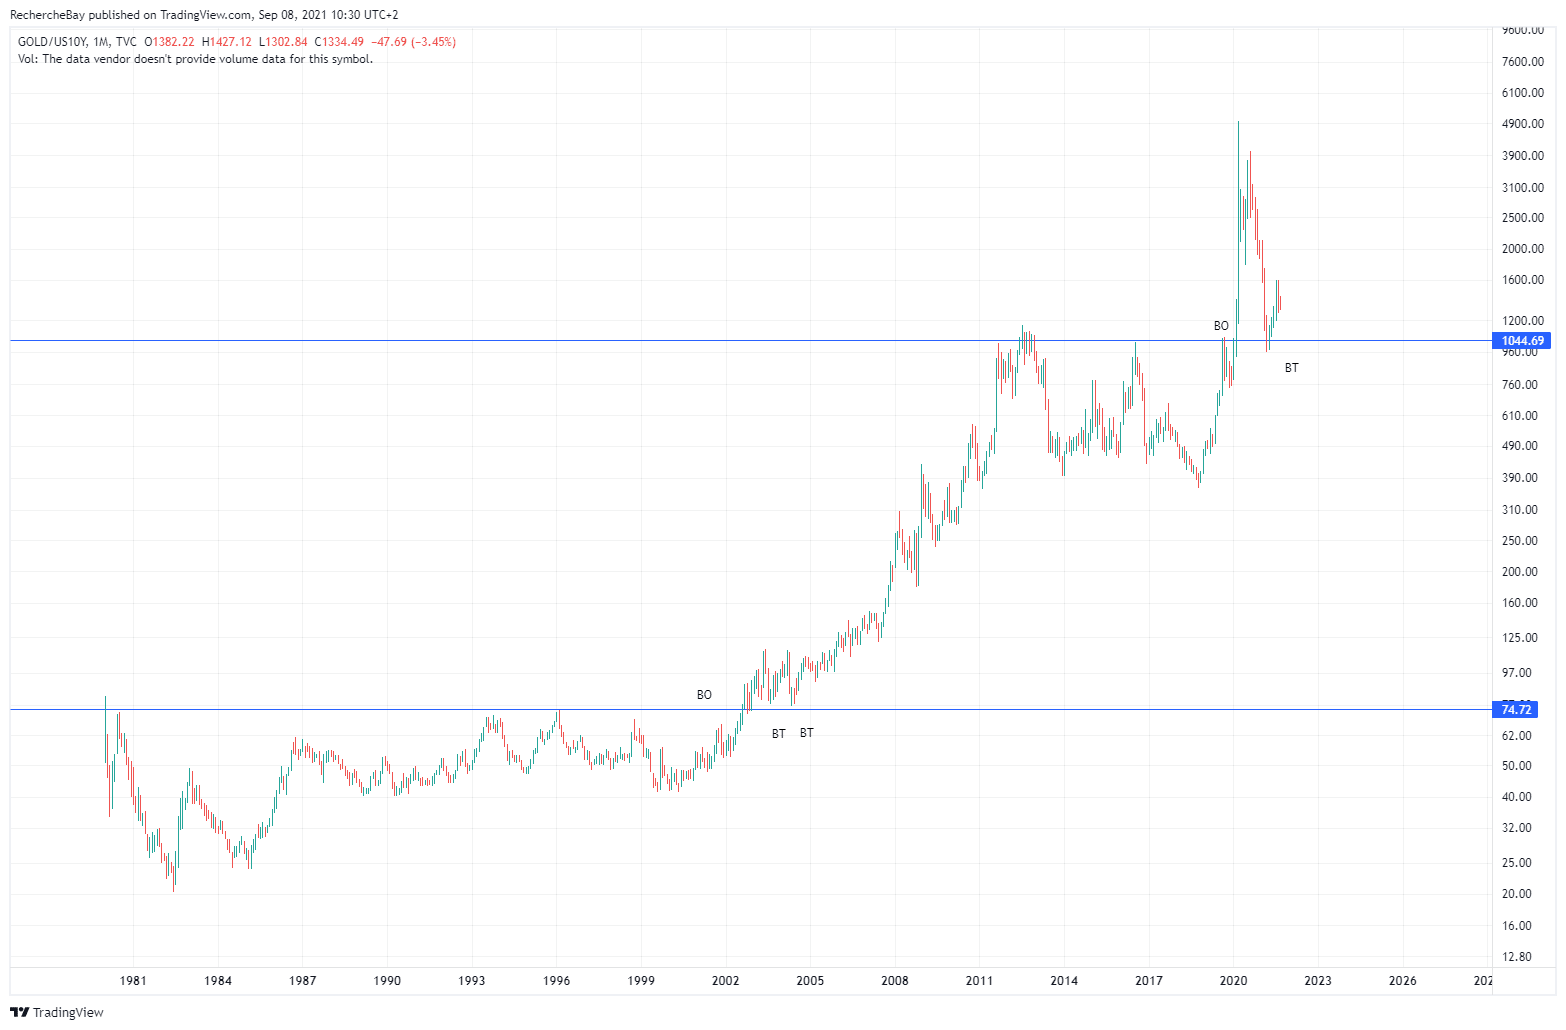
Looking at the picture over a longer time frame, we note that the last two breakout tests, in 2001 and 2002, triggered the latest bull market for gold. Are we going to see history repeating itself? If this is indeed the case, we will have to keep a close eye on the next test of this breakout over the coming weeks.
Since the start of this century, gold has offered a far better return than bonds. It was this outperforming of the bonds by gold that took it into its bullish phase from 2002 to 2010. The central banks intervened in 2010 to break this cycle, but we have initiated a second cycle of gold outperforming the bonds market. Gold is continuing to bring in better returns than government bonds. On the charts, there is even a risk that this trend will accelerate as soon as the next test of the breakout of 2020 arrives.
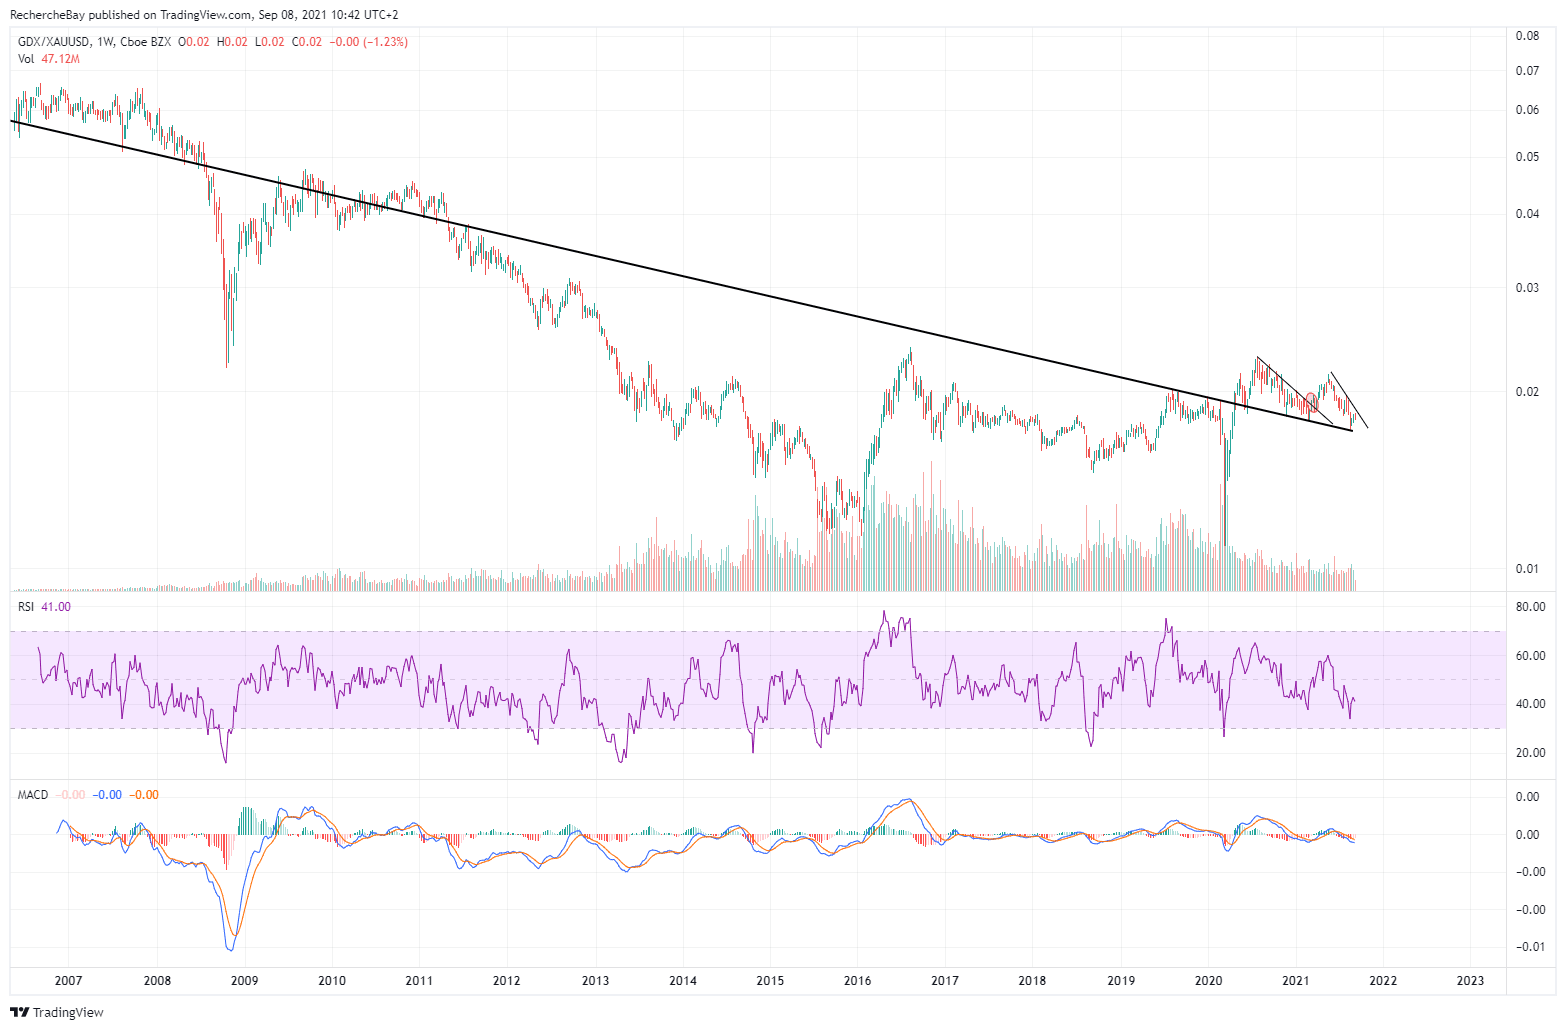
As for the mining stocks, they botched their take-off in 2020 and are continuing to test their bearish consolidation support in relation to gold, a trend that has now lasted over 13 years! Never before have the mining stocks been as cheap, by comparison with gold, as they are now:
Companies that are in their development phase are being punished by the market more severely than the rest. Even though these companies’ profits have never been as good as they are now (indeed, their net profits have tripled, on average, when one looks at the top 25 companies on the GDXJ index), the lack of performance by gold by comparison with commodities is starting to weigh heavily on their projections. Operating costs are starting to soar. Industrial metals are seeing two-figure annual increases, and the CapEx for mine development projects is enduring average increases of almost 20% compared to last year’s provisions.
This sector, one that has been particularly heavily punished by the market, now finds itself at such low levels that a simple continuation of the rise in the price of gold risks catapulting these stocks to new heights over the coming months. This is the result of the disaffection that has been present in this sector for 10 years. Capitalizations are at very low levels and volatility is liable to be even more extreme.
Development costs are rising.
Aluminum, for instance, has been on a continuous, uninterrupted rise for 15 months:
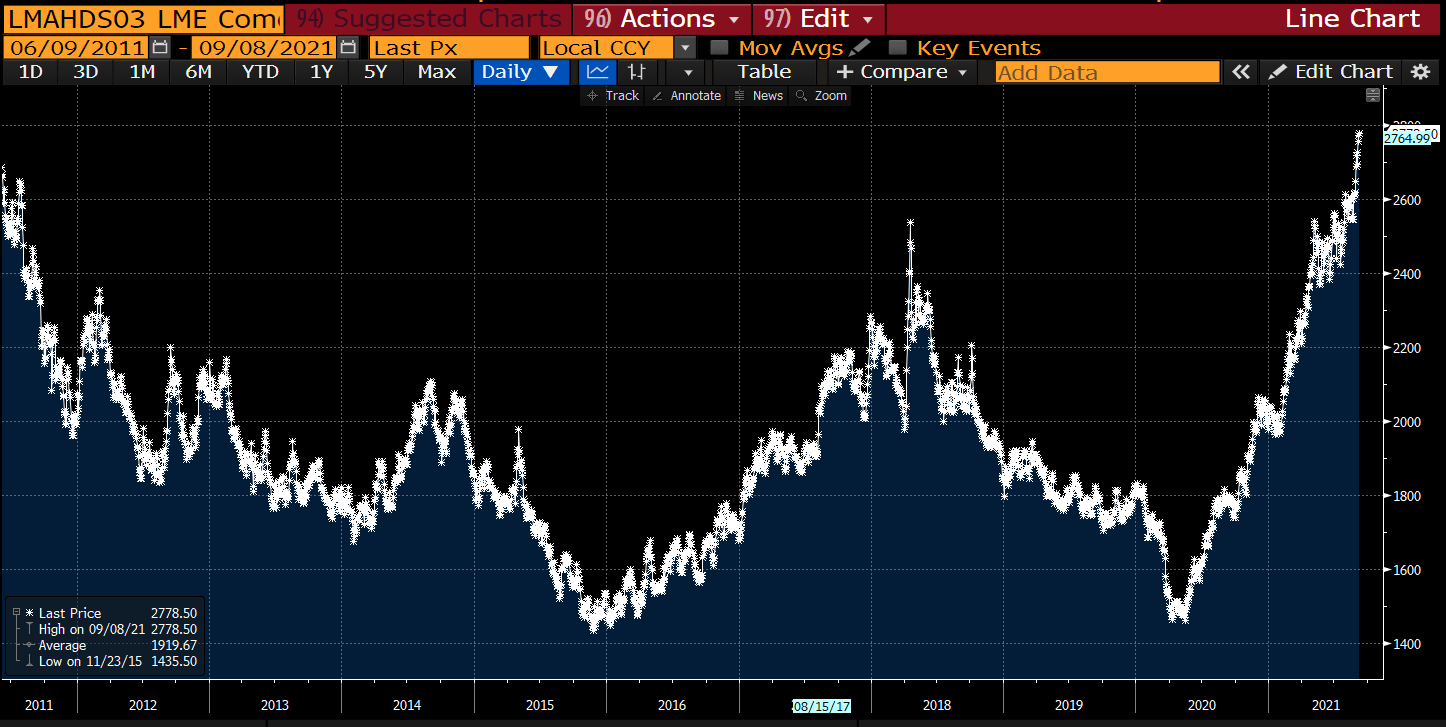
The price of steel has shot up by more than $200 a tonne in two months (topping $650 this week).
Commodities are going up, and transport costs are also continuing their uninterrupted ascent.
The price of transporting vehicles has risen three-fold in a year:
![]()
These figures are now going to spread to the forecasts for inflation on manufactured goods and the rise will also affect the price paid by consumers this fall.
These rises are starting to have a problematic effect in China, where manufacturing activity contracted again this summer:
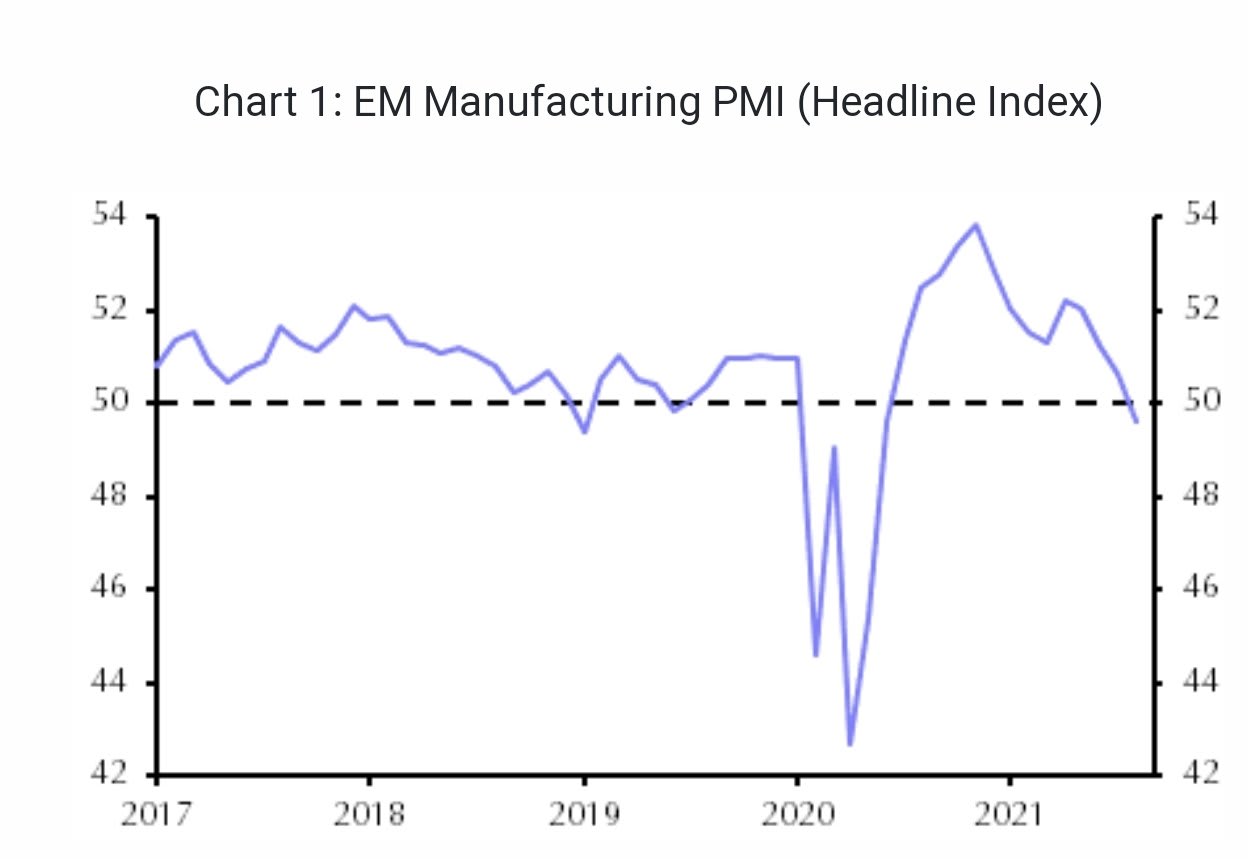
The markets do not seem concerned by these risks of economic contraction connected to the rise in prices.
Ultimately, the only thing that really matters is whether or not investors have faith in the Fed’s ability to sustain these markets at such stratospheric levels.
According to a disclosure form provided by his bank, Robert Kaplan (President of the Dallas Federal Reserve) made millions of dollars last year, thanks to his stock trades.
Robert Kaplan (former Goldman) made multiple million-dollar-plus stock trades in 2020, according to a financial disclosure form provided by his bank: WSJ
— zerohedge (@zerohedge) September 7, 2021
Robert Kaplan is not the only one to have been both beneficiary and decision-maker.
The people in charge of the country’s monetary policy have a personal interest in the market’s performance... Something that might have been seen as a schoolboy error and a conflict of interest just a few years ago is now being hailed as an encouraging act for the stock market. The prevailing sentiment is this: nothing can happen to the market as long as the people who are making the printing machines work have a lot to lose, personally, if the markets correct themselves too strongly. Whatever one thinks of this situation, there is too much money to lose in failing to take advantage of this historic rise. This is doubtless the sentiment that is feeding the current bubble in the markets.
Original source: RechercheBay
Reproduction, in whole or in part, is authorized as long as it includes all the text hyperlinks and a link back to the original source.
The information contained in this article is for information purposes only and does not constitute investment advice or a recommendation to buy or sell.


