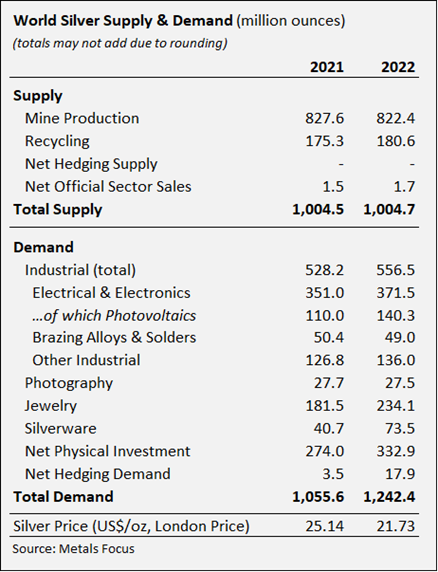
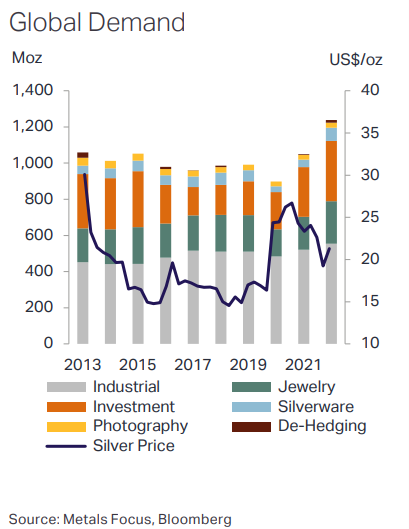
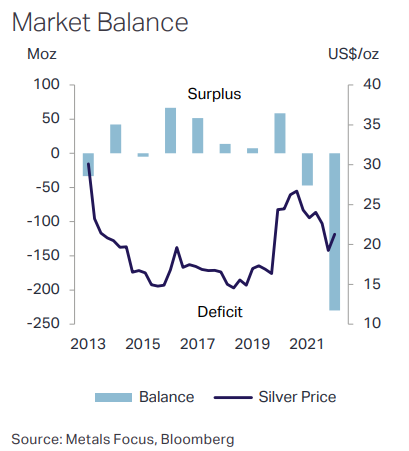
In 2022, the demand for physical silver was 1.24 billion ounces (or 35,150 tons). This is simply the highest demand recorded on the market. On the other hand, supply is stagnant, which is creating an unprecedented supply deficit. This supply deficit amounts to nearly 6,740 tons, or nearly 20% of total demand.
This demand for silver is the result of both a growth in demand for photovoltaic panels, 5G networks, construction, etc... And while India and Asian countries are capturing most of this demand, this rebound is most notable in the jewelry but also investment sectors.
Let's decipher the fundamentals of the grey metal market and the outlook for 2023.
Silver supply under pressure
First, supply is struggling to return to the levels of 4 years ago. For example, mine supply was 836 million ounces in 2019. In 2020, the supply of physical silver fell by more than 6% as a result of the lockdowns. With a mine supply of 822 million ounces in 2022, it is still below its pre-crisis levels. In this respect, it should be remembered that mine supply represents 82% of all silver supply. We will show the determining role of the production cost later on.
Moreover, it is interesting to note that the global silver supply has tended to be considerably stable for nearly ten years. The tensions on the supply side are therefore not inherent to the latter, but rather explained by the arrival of new demand. It is also notable that periods of increased supply have generally been a bearish factor for the price of silver.
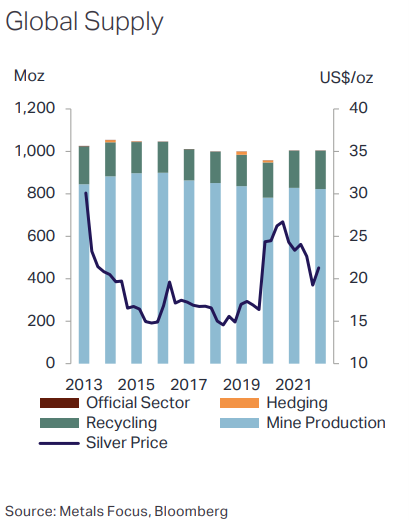
Another major factor weighing on supply is the disconnect with market price. The 2023 World Silver Survey report points out that “the average price fell by 14% to $21.73, due to pressure from institutional investor activity”. Finally, these supply pressures are expected over a long period of time, i.e. for the next five years or so.
Rising production costs and declining mining
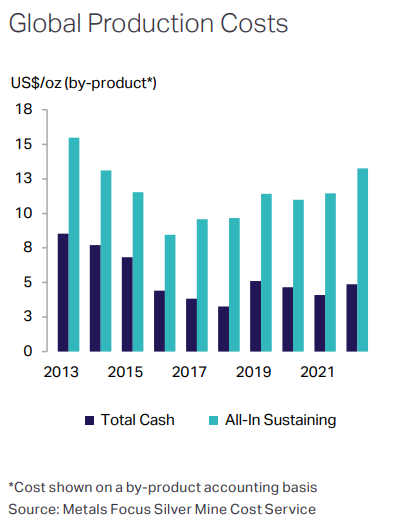
Silver is both a valuable and industrial asset. This type of asset provides neither interest nor dividends. It is therefore appropriate for these assets (just as for gold or bitcoin) to value them at their production cost. The latter has a very powerful support or resistance effect on the markets. The production cost of an ounce of silver has risen 16% in 2022 due to inflation, to $13.36. It is quite remarkable that there is a correlation between the production cost and the price of silver in the long run, and that divergences between the two variables are usually corrected on price.
It should also be noted that Mexico, China and Peru together account for more than 50% of the world's silver mining production (24%, 13.6% and 13%, respectively). It is also important to note that 70% of all silver mining production initially comes from copper, gold and zinc mining.
For the time being, major silver mining companies such as Fresnillo or KGHM and Newmont remain at low levels and are struggling to grow under the stress referred to. The rising cost of production is not matched by rising prices, which implies tensions and a fall in profitability for the mining companies. It is clear that rising costs due to inflation are irreversible, and therefore silver can be expected to remain at least above its current production cost.
Taking into account the cost price of an ounce of silver, and the fact that historically the international price of silver has been 60% to 70% above it, the price of silver was effectively 62% above its production cost in 2023. The report states that lower oil and other commodity prices will "likely lead to flat or marginally lower costs this year". As a result, silver can be expected to average between $21 and $22 in 2023. However, a further increase in production costs above $14 per ounce would push the silver price above $23 per ounce on average.
Demand to remain "strong" in 2023
The Silver Institute states that "this year is expected to be followed by continued growth". Industrial demand is expected to reach new records, while investment (bars and coins) and jewelry demand is expected to decline slightly. At the same time, supply tensions are expected to continue, with an expected supply deficit of around 142 million ounces of silver. Surprisingly, the World Survey 2023 anticipates an average price for the year of $21.30, down 2% from the average price in 2022.
The report states that in the absence of a crisis, liquidations could take place in gold and silver in the second half of 2023. The banking crisis that benefited the rebound in gold and silver has led traders to hedge.
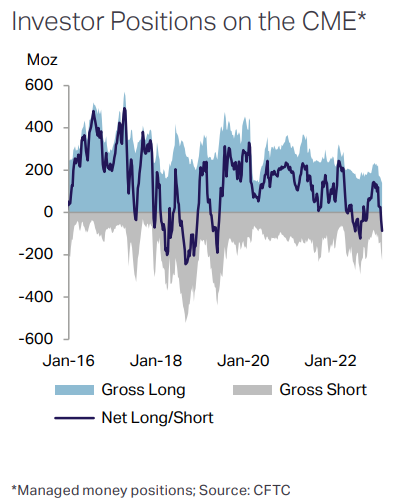
In addition, it is important to keep in mind that the volumes traded on the silver market by institutional investors are declining. For example, the Shanghai Future Exchange (SFE) has seen its activity reduced by 18%. Fears of a recession and lockdowns in China have also encouraged bearish positions by institutional investors. After rather bullish forces in the derivatives markets between 2016 and 2018, and again between 2019 and 2021, bearish pressures thus persist in the derivatives market.
What are the projections for the price of silver?
We have shown since November 2022 that the fundamental situation was conducive to new highs for the gold price. The correction observed in 2022 was essentially the conjunction of fundamental cycles that confronted the rising cost of production of the yellow metal. For silver, the considerable production shortfall can be historically interpreted as a bullish reversal signal (see below). Nevertheless, it is important to point out that the current silver production deficit has persisted since 2021, and therefore, it has not been sufficient to generate the price increase.
Contexte particulier à surveiller dans les prochains mois sur le #silver.
— Thomas ANDRIEU (@ThomasAndrieu_) November 1, 2022
Mon intervention ce matin sur @TV_Finance pour analyser la trajectoire du métal gris⤵️
Replay complet ➡️https://t.co/7D0F7JtWxO pic.twitter.com/DYC9auRXoB
As early as November 2022, silver was showing bullish reversal signals. Since November 1, 2022, silver has risen over 30% to return to its 2020/2021 levels. The chart below shows the price of silver and the ongoing attempt to break through its former resistance levels. Furthermore, it should be noted that silver prices have resumed their bullish momentum from their 2016 and 2019 lows. Therefore, in parallel to gold, several buying zones have emerged in this uptrend (i.e. the areas circled in red as a fractal reversal signal).
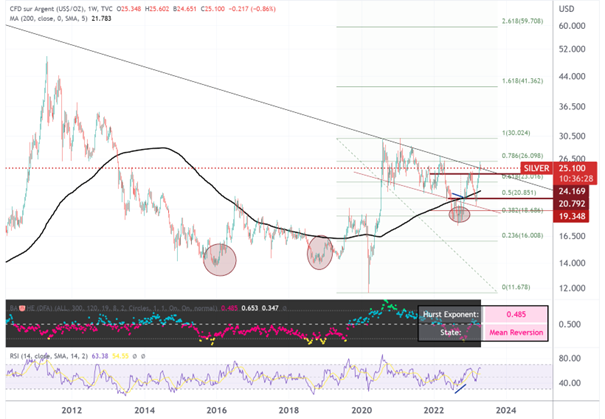
In the medium and short term, the resistance zones in the Fibonacci sense are: $26.10 (last peak), $30, $41.36. On the contrary, the support zones are: $23, $20.85 and $18.70. Moreover, the oblique resistance drawn on the above chart has been active since 2011. The attempt to break through this oblique resistance is one of the main issues for 2023. In the event of a bullish breakout, i.e. if the price of silver rises above the $26 level and beyond, then we would consider a first price target at $30, then beyond by extension. Conversely, we will consider a return to the moving average ($21.80).
Therefore, projections of an average silver price of $21.30 seem particularly weak in our minds. Such a price level would not only set in motion a downward dynamic, but also a sustained weakness in the price of silver. But in a context where supply is struggling to grow, the low price would justify the chronic supply deficit.
A balance of power (still) favorable to gold
If the price of silver has been painfully trying to regain an upward momentum since 2016, the trend on gold is more marked. We find the historical tendency of the latter to outperform silver in the very long term. However, silver may occasionally rise sharply as a result of a catch-up phenomenon. The chart opposite shows the ratio of gold to silver. It has gone from 65 in April 2021 to almost 80 in April 2023. That is, it takes 80 ounces of silver to buy an ounce of gold. So the relative strength is in favor of gold.
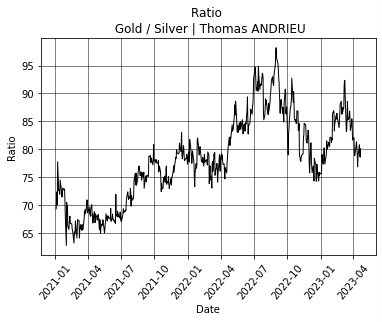
Otherwise, we could consider a sustainable outperformance of silver if the GOLD/SILVER ratio falls below 75, which corresponds to the last reaction zone. To complete our analysis, we represented in the chart below the extreme variations observed on the silver price since 2022. That is to say that the daily variations of the silver price which take effect with a frequency close to 1% are represented by vertical lines. It appears that extreme upward variations (green) are often a bullish signal, while extreme downward variations (red) are often a complementary downward signal.
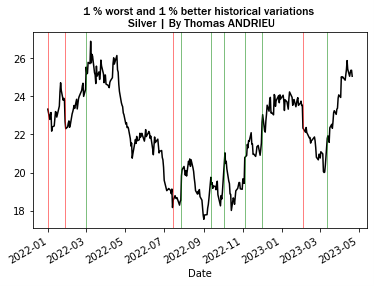
As the market currently stands, the last bullish signal was seen in March 2023, and there is no indication of a weakening or reversal in late April. Furthermore, we observe that the bullish recovery in silver prices since September 2022 has been very well constructed by a series of strong rallies that have discouraged the bearish pressures described above. Note that an "extreme" move on silver is a move of more than +4.6%. From a statistical standpoint, all indications are that the uptrend continues at this time.
In conclusion
The latest World Silver Survey 2023 shows that the silver supply gap is historic and quite significant. This supply deficit alone represents 20% of total market demand!
Throughout this paper, we have thus observed that:
-
The physical silver market is experiencing a supply deficit of nearly 7,000 tons. This shortage is projected to last for several more years.
-
At the same time, demand for silver has climbed nearly 18%. This demand is expected to remain strong in 2023, driven by industrial demand, photovoltaic panels, 5G, etc... Nevertheless, a recession could reduce this demand potential.
-
The cost of production increased by 16% in 2022, which ensures stronger supports for the silver price in 2023. Nevertheless, the decline in many commodity prices could stabilize this cost of production and also make resistance stronger.
-
The silver price is struggling to rise in an environment where institutions are contributing to downward pressure. While the shortage of supply would suggest a rise in prices, the market price remains broadly consistent with the cost of production. These are therefore capacity constraints that are not included in the market valuation at this time.
-
The average silver price is expected to decline slightly in 2023. However, this does not seem completely consistent to us and other scenarios could be considered.
- Technically, the trend is still bullish despite numerous resistances. Moreover, market strength still remains favorable to gold. A sustained move above $26 an ounce would trigger strong bullish potential. Otherwise, we can expect a lateralization. The bearish scenario is sui generis less likely.
Reproduction, in whole or in part, is authorized as long as it includes all the text hyperlinks and a link back to the original source.
The information contained in this article is for information purposes only and does not constitute investment advice or a recommendation to buy or sell.


