In this article, we analyze gold's monthly performance. First of all, it appears that "minimal" monthly variations account for the vast majority of gold price variations. In other words, most of the time, the price of gold follows a channelled, low-volatility pattern.
However, this stability of the gold price with minimal variations does not explain the performance observed over the long term. The answer surely lies in "extreme" variations in the gold price. Extreme variations do indeed provide an explanation for the rise in gold prices over the long term. Consequently, the data studied clearly show that gold must be a permanent hedge in an investor's strategy.
Gold's performance over the past 45 years
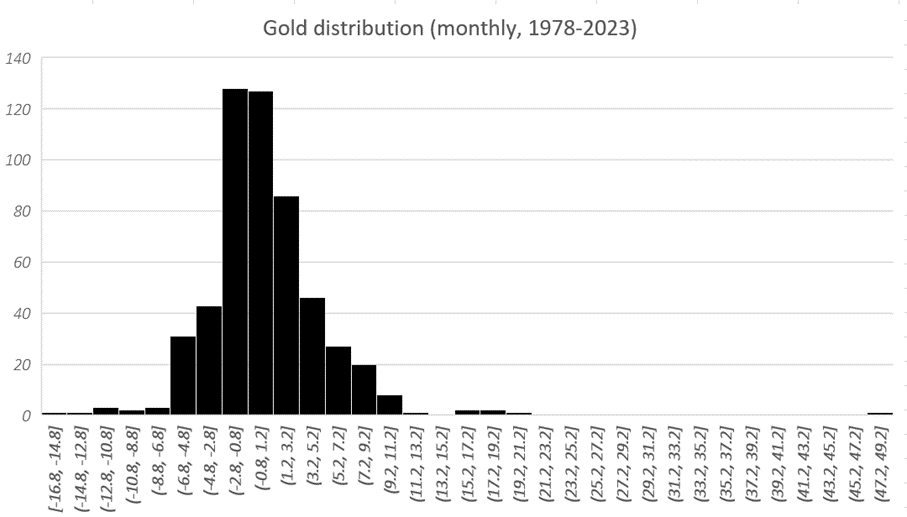
Over half a century, the price of gold has shown enough regularities and trends to provide a clear picture of its behavior. Here, we look at gold's monthly performance between 1978 and 2023. As we can see, the price of gold performed on average +0.526% per month. This corresponds, through compounding, to an average performance of 6.49% per year. We could extrapolate, but this remains to be verified, by deducing an average performance over each decade of +87%. In this respect, we note that gold's performance over the last ten years (2013-2023) was "only" +40.8%. Gold would therefore have underperformed its historical norm. Over the previous ten years (2003-2013), the gold price had actually performed by almost +300%.

The graph above shows the distribution of monthly variations in the gold price. This distribution is far from smooth, and gold variations between -2.8% and +1.2% are clearly over-represented. These monthly variations alone account for almost 47% of gold price variations. Similarly, variations between -2.8% and +3.2% account for almost 63% of all recorded variations. The conclusion is that most gold variations are rather small and have little impact on the gold price. Conversely, a minority of variations seem to explain most of gold's performance. We therefore turn our attention to extreme variations.
Ten percent of the time would explain all of gold's performance
We have shown that "small" variations in the price of gold are very abundant. But it's clear that limited variations in the gold price cannot explain high performance over the long term. Otherwise, the gold price would be a perfectly regular, rising straight line. Thus, extreme variations provide us with an explanatory element for the performance of the gold price.
In fact, monthly variations of less than -7% and greater than +7% account for more than the entire average overall performance of the price of gold. At the same time, these monthly variations represent only 9.4% of the time. Clearly, then, 10% of the time explains more than the entire average overall performance of the price of gold. This is the greatest disproportion observed in the price of gold.
We then performed this classification for variations above and below +/- 8%, then 9%, then 10%, etc. The graph below shows the proportion of time represented by variations above the threshold set on the abscissa (red curve) and their share in the overall performance of the gold price (black curve). The greater the gap between the two curves, the greater the part of the time that explains the price of gold's performance.
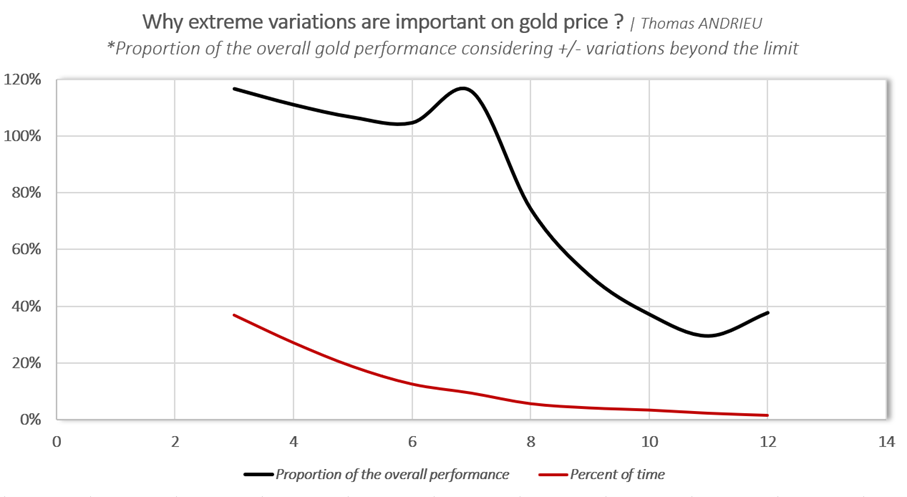
For the technical explanation, we have determined a threshold (on the abscissa above) from which we have excluded variations below or above this threshold. For example, for a threshold of 6%, we have excluded from historical variations in the price of gold variations below -6%, or above +6%. We then deduce the proportion of gold's overall performance represented by these "extreme" variations.
Finally, there are two reasons for selecting monthly variations (rather than daily, for example). Firstly, gold is a low-volatility asset. The annualized volatility of the gold price between 1978 and 2023 is 16.10%. Secondly, gold is an asset that should be considered from a longer-term perspective than equities. We showed this in a previous article.
How can we explain such a disproportion?
Two major conclusions emerge from our calculations.
- On the one hand, we have the relationship according to which 10% of the time explains more than all the overall average performance of the price of gold since 1978. Once again, remember that we're dealing here with monthly variations.
- Secondly, variations that are too "extreme" tend to reduce the overall average performance of the gold price! Indeed, if monthly variations are below -8%, or above +8%, then from this threshold onwards the overall performance of the gold price is reduced. Extreme monthly performances above +/- 8% tend to reduce the rise in the gold price...
These conclusions can be drawn from a simple observation of the first chart. The distribution of monthly variations in gold is not evenly distributed across the extremes. Up to a monthly variation of around 8%, bullish variations (+8%) are generally more numerous than bearish variations (-8%). Thereafter, this relationship is reversed, with more declines occurring for declines of -10%, for example.
It's also interesting to note that the best monthly performance was in January 1980, when the price rose by almost 50%! This was quite simply the climax of the major 1980 peak, which remained unmatched for almost 27 years... Conversely, the worst monthly performance recorded for the gold price was two months later, in March 1980, with a fall of -16.8%. But it's clear that we're dealing here with exceptional and truly erratic values.
Optimal portfolio management: permanent protection
Gold price statistics often show that the best way to profit from time/performance arbitrage is to hold it indefinitely. This is what we have shown. In fact, if you missed 10% of the time on the gold price, you'd have no performance at all!
Nevertheless, it's very difficult for investors to anticipate exactly these "extreme" variations, and all the more so to be positioned at the right time. What's more, in the case of the variations we're interested in, several years can go by without the gold price ever behaving in an "extreme" way. Clearly, then, these statistics highlight the fact that increasing, or decreasing, one's investment in gold over a given period of time is not necessarily an optimal strategy. However, a cycle seems to be emerging (A 16-Year Gold Cycle? | Goldbroker.com).
Gold is often perceived as protection. But the data studied ideally show that gold should be permanent protection!
By keeping gold in your portfolio, you can take advantage of the significant (but ideally not too significant) variations that occur from time to time, and which are truly decisive in the long term.
What about other markets?
The situation we have described for gold is not unusual. In fact, these disproportions can be found in most assets. It's a true "Pareto law", meaning that a minority of time (of the "time resource") explains the majority of observed performances.
For example, a study of daily variations in bitcoin, which is a much more volatile asset than gold, shows that 7% of the time explains up to 90% of the observed performance. This observation is comparable to the monthly behaviour of gold. In fact, variations below -7% and above +7% are also the most interesting performances for bitcoin and gold. However, we're talking about monthly variations for gold, and daily variations for bitcoin. Bitcoin's exacerbated volatility makes extreme variations more frequent.
We also looked at the Dow Jones index on the US stock market. As an indication, the average monthly performance of the Dow Jones is +0.73% between 2013 and 2023, which is higher than the performance observed for gold. The Dow Jones is probably one of the assets that shows the least disproportion. In fact, 80% of the time accounts for all the index's performance. So there's no Pareto law. However, in the case of extreme variations (over +/- 3%), one-third of the time explains up to 75% of the index's performance. What's more, excessive variations tend to reduce Dow Jones performance (crashes).
In conclusion
A study of the data presented is revealing in several respects. On the one hand, gold proves to be a highly profitable asset over the long term. Gold's average monthly performance of +0.52% since 1978 is strong enough to make it attractive. Nevertheless, most of the monthly variations are relatively small and, overall, do not explain gold's performance. In effect, 63% of monthly variations in the gold price take effect between -2.8% and +3.2%, which is not very significant.
The use of "extreme" variations reveals some very interesting conclusions. When we look at monthly variations above +7% and below -7%, we see that the latter represent only 10% of the time. Yet they account for more than the entire average monthly performance of the gold price!
This phenomenon is not limited to gold, but the discrepancy described here is particularly significant. Above all, it reflects the fact that an investor who misses out on 10% of the time invested would potentially make no return at all... This study underlines, more than any other, the need to conceive of gold as a permanent hedge. Finally, these relationships can be found in bitcoin and equities. A market builds on shocks more than it progresses in a regular, linear fashion, or at the very least, in a random, well-distributed manner.
Reproduction, in whole or in part, is authorized as long as it includes all the text hyperlinks and a link back to the original source.
The information contained in this article is for information purposes only and does not constitute investment advice or a recommendation to buy or sell.


