What links the Napoleonic Wars of 1814, the American Civil War, the First World War and the Cold War or the Vietnam War? What do inflation, wars, and the price of gold have in common?
At a time when history is crying out, it is possible to understand the links between gold, inflation, and geopolitical events. This link is so close that the study of inflation alone allows us to infer the future direction of gold. In our last publication of December 2021 [read here], we statistically showed the high probability of a strong bullish movement for the beginning of 2022, which is now confirmed. From now on, we will focus on a popularized statistical study of gold, inflations, and wars.
The link between gold and stagflation
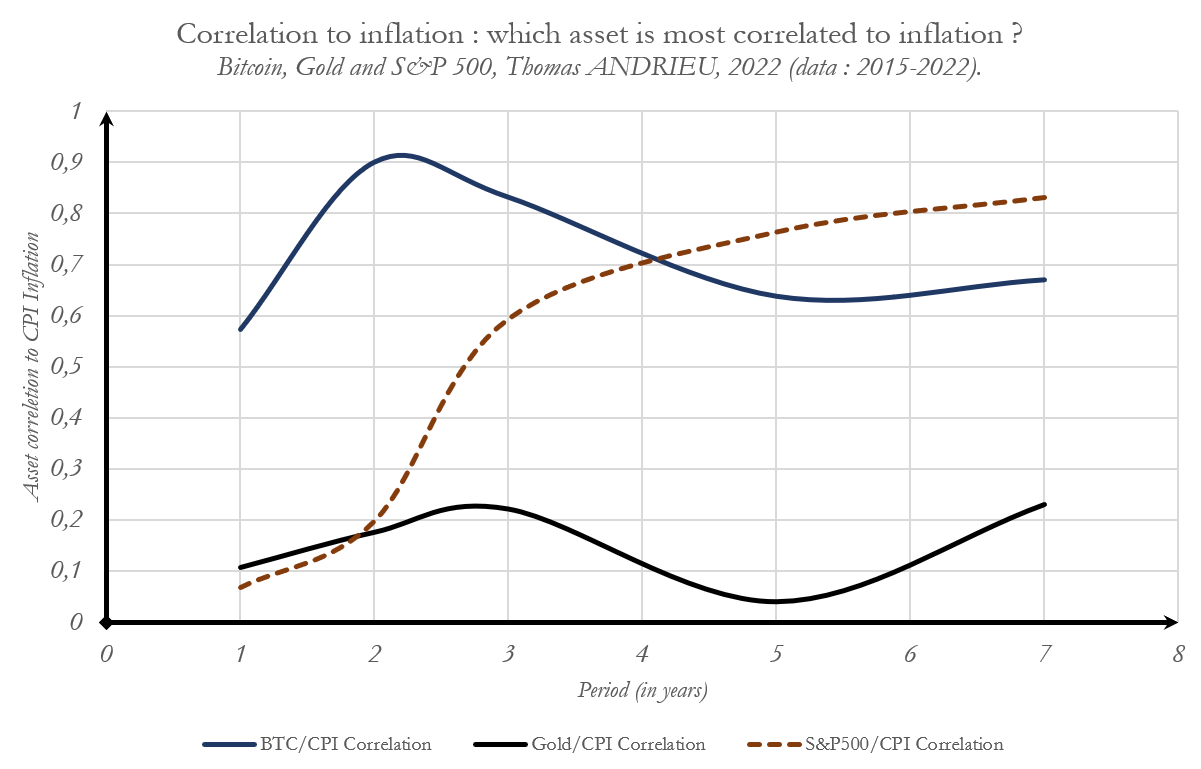
It is possible to statistically measure the sensitivity of gold to inflation. With some surprise, gold's correlation to inflation is relatively low compared to other assets and is around 20% over a three-year horizon. Nevertheless, gold remains one of the best protections in the long run. In fact, the price of gold is essentially determined by the supply of mining companies, which explains why inflation is not an immediate parameter. In terms of supply, Russia is the world's second largest producer of physical gold after China with 330 tons mined in 2020, or 36% of the mining supply and more than 25% of all annual gold supply, according to the WGC. It is generally accepted that gold is a particularly effective hedge against inflation of a particular kind: stagflation. As we see today, stocks have failed to protect against political risk as have cryptocurrencies.
Inflations and wars: why stagflation leads to war
We will not go into detail here about the regular dynamics of inflation, which have already been discussed by economists like Brian Berry. In general, the link between growth and inflation is similar: a fall in growth leads to a fall in inflation. But there is a regular divergence in history between these two parameters. When growth slows down while inflation persists, we speak of stagflation. Thus, the change in prices alternates between four phases approximately every 52 years: stagflation, disinflation, deflation, reflation, and so on...
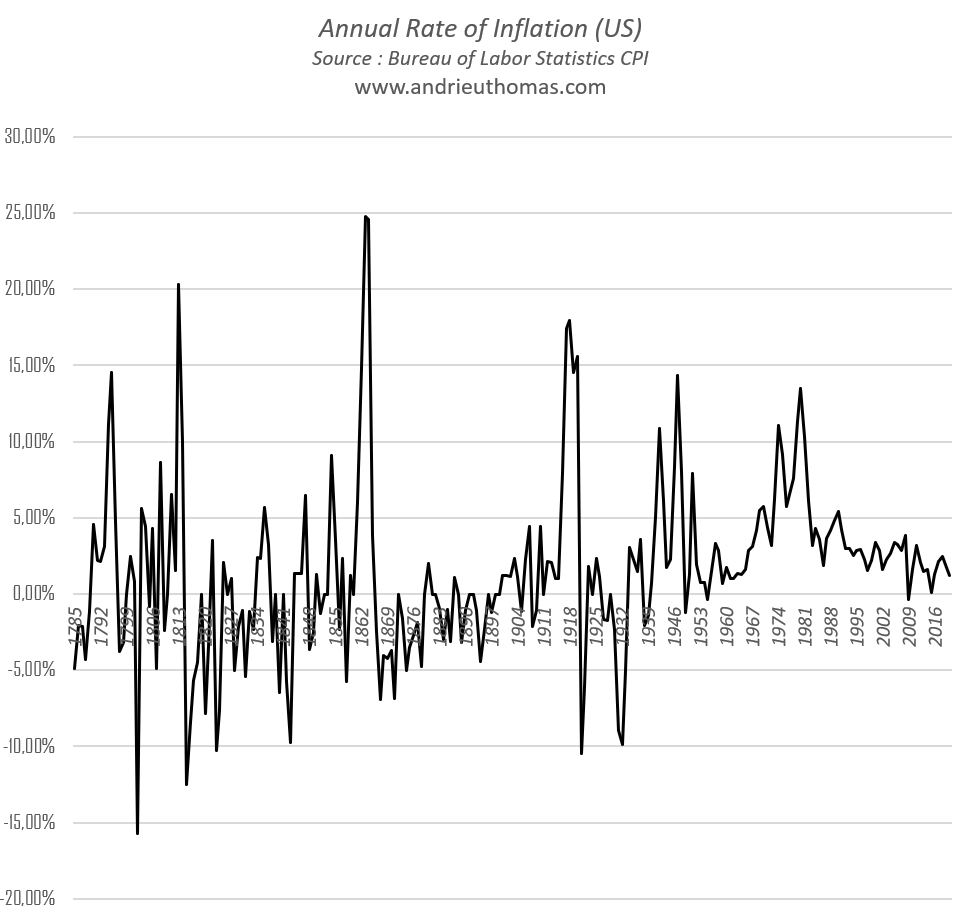
Thus, since 1800, we have experienced four peaks of stagflation, all marked by destructive or very threatening wars: the Napoleonic Wars until 1815, the Civil War in the United States in 1865 and the Franco-Prussian War in 1870 in Europe, the First World War in 1920, the Second World War with a stagflationary peak in 1945, the Vietnam War in the 1970s, etc. But then why is stagflation linked to wars? The first argument is that war causes shortages and stagnation of growth, and therefore stagflation. The second argument, less famous but nevertheless more decisive, is to consider the idea that the lack of resources (shortages and lack of growth leading to stagflation) incites governments to wage competitive wars. If the market in shortage cannot adapt to the needs of the governments, the governments will adapt to the market through war. In this sense, stagflation causes war.
Recurrent periods of stagflation or war generally result in more recurrent increases in gold from one year to the next. In effect, large movements in the price of gold are usually the result of extreme events for which investors seek, along with other commodities, alternatives with a minimum of stability.
The inflationary cycle
The decomposition of inflation since the 1960s shows that the main cycle that determines inflation is a ten-year cycle. This cycle is therefore quite close to the dominant cycle in the price of gold (2022 will mark the entry of gold into a new cycle phase | GoldBroker.com).
To represent the likely movements of inflation, we can build a synthetic index of all the ten-year cycles since the 1950s. The graph below shows mainly in black the average of all the ten-year cycles since the end of the Second World War (black curve). The thick orange curve on the left side of the graph corresponds to current inflation levels. Unsurprisingly, and in correlation with our analysis on gold, it is likely that current inflation will experience slight decreases by 2023. This would also mean a decrease in political/geopolitical risk despite the persistence of stagflationary risks over this decade. Indeed, the possibility of inflation resurfacing by the middle of the decade, followed by the beginning of the next decade, is not a scenario to be ignored.
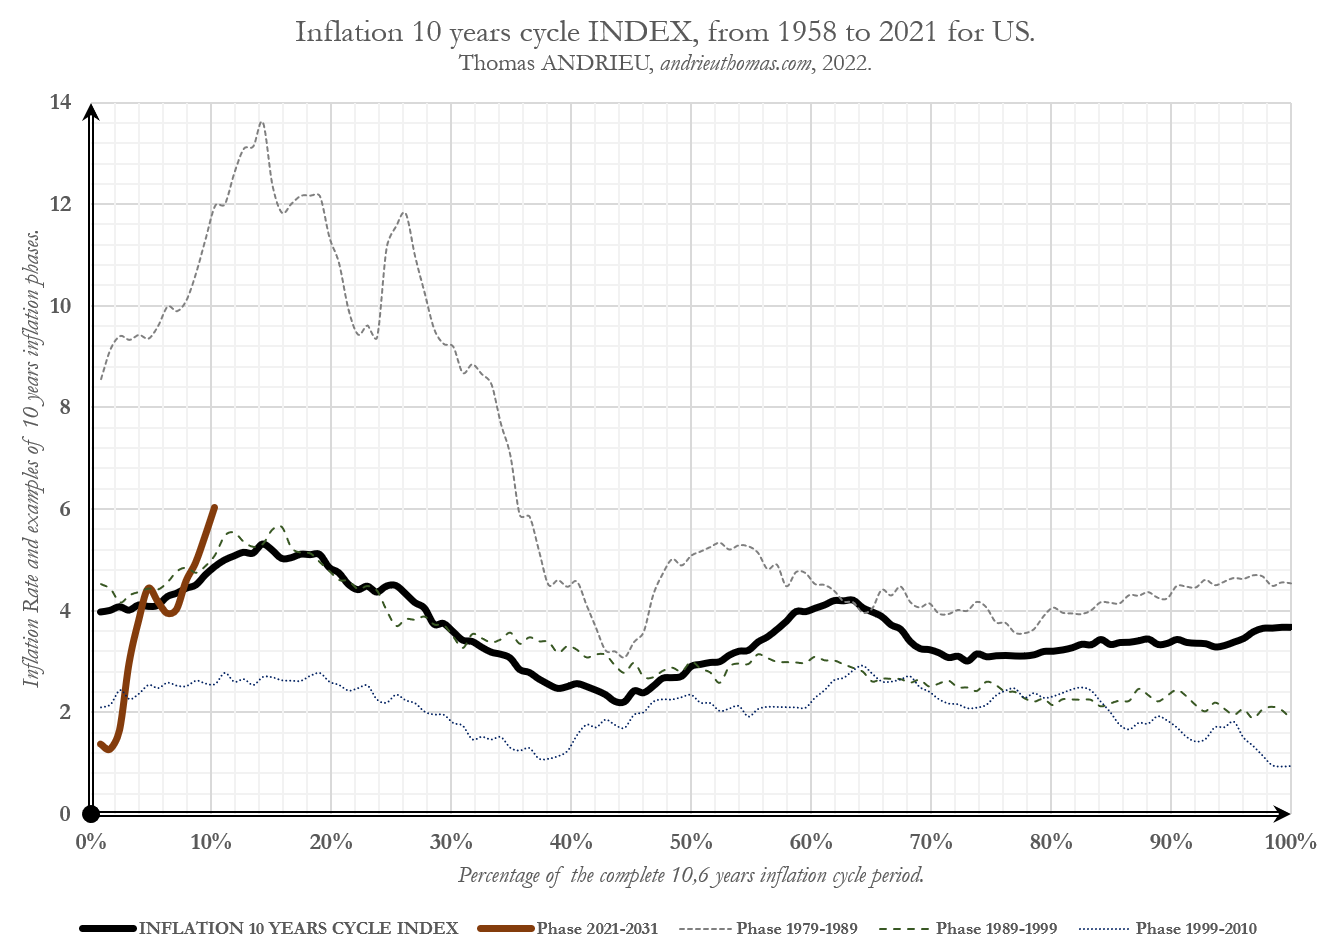
What then is the "typical" shape of a ten-year inflationary cycle? To answer this question, we have plotted the three extremes of inflationary phases since 1958 as dotted lines. The inflationary phase of the 1980s was the most intense, while one of the least inflationary phases in the United States was that of the 2000s (bottom curve). The ten-year inflationary cycle index allows us to characterize a pattern of repeated inflation. Thus, after an acceleration of inflation at the beginning of the cycle as we know it today (between 0% and 20% of the cycle), we note an easing of inflation up to the middle of the cycle (40%) before a new inflationary shock that peaks around 65% of the cycle. The relative normalization of inflation only takes place in the last phase of the ten-year inflation cycle.
Anticipating inflation as a stimulus for commodities
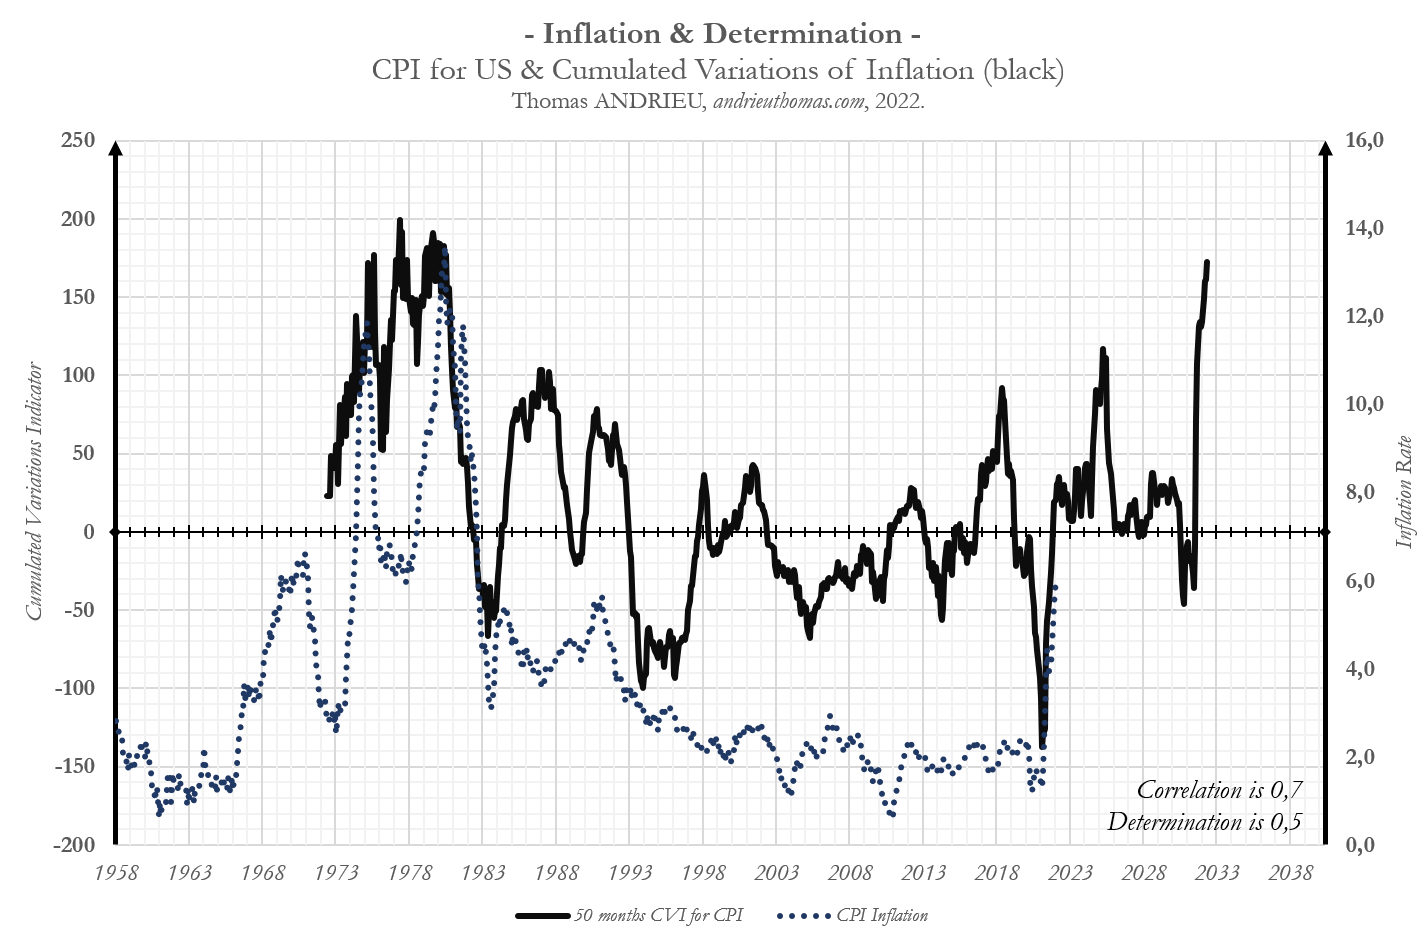
Without going into details, another effective way to anticipate inflation (with a correlation of more than 70% and a determination of more than 50%), is to measure the strength of the increase of the current inflation and to carry it forward in the same ten-year cycle. In this way, the black curve on the graph opposite allows us to relatively anticipate future inflation movements.
In this scenario, it seems clear that stagflation would be a situation that we could gradually move towards within fifteen years, with weak growth and increasing pressure on commodities. In the shorter term, the next major price reversal target will be in the middle of the decade, and should remain our target for now before a possible partial reallocation of safe havens. Again, we note that inflation is likely to slow by 2023 before a risk of acceleration in the middle of the decade.
In a nutshell
In the context of the health crisis, the deliberate choice of governments to accompany a structural situation conducive to stagflation naturally induces the risks of wars, which have already been pointed out by many economists and academics specializing in the relationship between human and monetary phenomena. Our central observation, although not new in cyclical analysis, is that geopolitical events regularly coincide with gold cycles. In this, there is no real statement other than to write that gold fully assures its safe-haven status during periods of stagflation. Periods of stagflation are, above all, failures in the market supply and in the use of resources, which favors conflicts and wars. Empirically, the conflict situation with Russia is a doubly favorable prospect for gold. But we must keep in mind that this crisis is primarily structural and is explained by very precise economic mechanisms that condemn us to relive history in its most outrageous aspects.
Reproduction, in whole or in part, is authorized as long as it includes all the text hyperlinks and a link back to the original source.
The information contained in this article is for information purposes only and does not constitute investment advice or a recommendation to buy or sell.


