In 2022, our study of the gold market allowed us to "expect that, on average, the gold price will perform around 10% in 2023". This prospect suggested that, by the end of 2023, the price of gold would most likely be close to its all-time highs. At the end of December 2023, gold had risen by around 12% year-on-year to stand at around $2000 an ounce (or €1850 an ounce)... Flirting with historic highs is always a thrill for the public.
Today, visibility on the fundamentals of the gold price is as good as ever. It is therefore timely for us to set out our outlook for 2024 in more detail. Of course, this task is always made difficult by a seemingly unstable and disorderly economic climate. Thus, the evolution of the gold price in 2024 will be influenced by four major factors:
- Dollar strength and inflation levels;
- Interest rates and the outlook for equity markets;
- Gold mining companies' production conditions;
- Gold price cycles versus current price.
An auspicious 2023?
The year 2023 began with a bullish movement that peaked at $2080 per ounce in May 2023. This was followed by a corrective movement towards $1800 per ounce until October 2023, before a rebound to previous highs at the end of the year. The past year potentially marks the end of a long stagnation in the price of gold since 2020. The major low of this market stagnation was reached in 2022, at almost $1600 an ounce (read more).
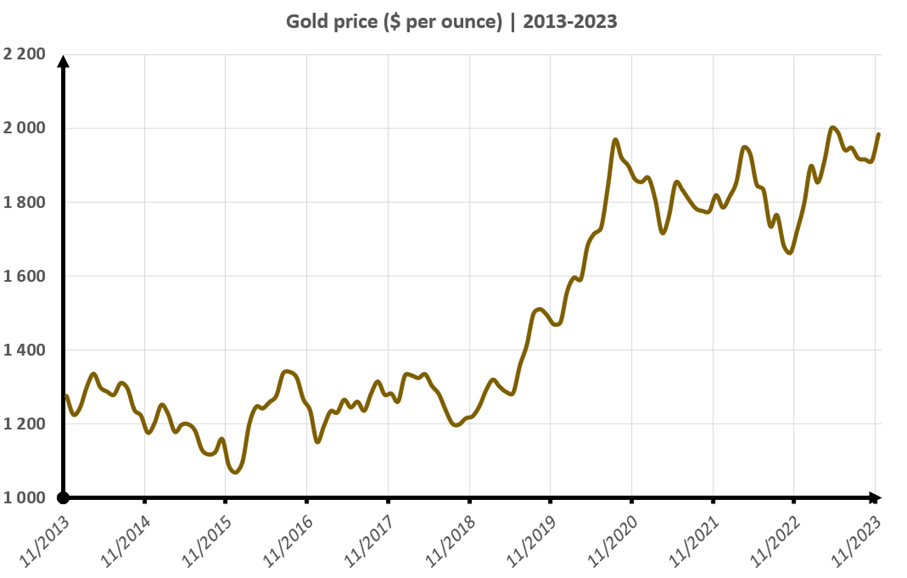
The stagnation of the gold price over the last four years follows a considerable rise between 2016 and 2020 (+65%). Since 2020, rising real interest rates and falling stock market indices have encouraged gold prices to stagnate. Nevertheless, gold has not fallen, as physical demand has remained sustained and mining companies have found it difficult to be profitable with a price permanently below $1700 per ounce.
Today, everyone should be alert to the fact that a gold price of $2500 per ounce is statistically conceivable. In fact, the average performance of the gold price since 1978 is +6.3% per annum, for a volatility of +16.15%. In other words, a very reasonable performance for a measured risk, lower than that of stock market indices. What's more, bullish impulses can be very intense after many years of stagnation.
A favorable monetary environment?
The rate hikes in 2022 and 2023 were historic for central banks. Symmetrically, the return of inflation prompted central banks to buy gold. The effect on the gold price has therefore been "neutral" in recent years: a bullish effect due to rising inflation (the need to find stable assets), and a bearish effect due to rising rates (and real rates), which make gold relatively less attractive.
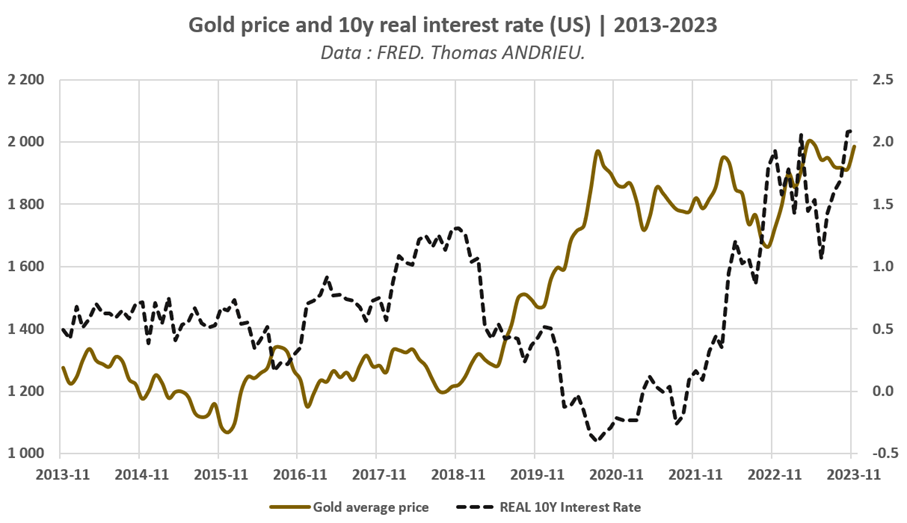
What's more, some agents were anticipating a sharp fall in the price of gold in 2022, but this did not happen. A major reason is that the correlation between gold and real rates (gold rises when the real return on capital falls) only really works with bull markets in the price of the yellow metal.
In 2024, the financial markets generally expect inflation to slow (real rates to rise), but also central bank interest rates to remain unchanged (or even fall). In financial theory, this should be favourable to the financial markets and mechanically favourable to gold. In addition, it is essential to keep a close eye on exchange rates. The US central bank has been more aggressive than the ECB in its fight against inflation.
This implies that the Fed could be led to stabilise or reduce rates more quickly than the ECB, which would lead to a rise in the euro (less of a rise in the gold price in euros). This would boost the performance of the dollar gold price.
Gold mining is getting harder and harder...
Gold production will remain more or less stable in 2023. But the costs borne by mining companies are rising. The cost of producing an ounce of gold at the beginning of 2023 was between $1300 and $1400, according to Metals Focus Gold. Remember that this production cost was just $300 per ounce in 2000 (multiplied by 4.5... almost as much as the gold price!). Gold price expectations are therefore largely based on mining companies' production cost projections (read more). A fall in the price of gold below $1700 or $1800 per ounce thus threatens the profitability of mining companies, reducing supply and ultimately triggering a rebound in the price of gold.
In 2024, production costs should continue to rise or remain stable, according to projections published by the major gold mining companies. The fundamental direction of the gold price therefore remains favourable over the long term. As the sharp rise in production costs in 2021 and 2022 has not been reflected by a rise in the price, the potential for an increase in the price of the yellow metal is therefore greater. At the end of 2023, a gold price of between $2000 and $2100 an ounce could be considered fundamentally well-valued. Bullish or bearish excesses may therefore lead to divergences from this level.
On the demand side for physical gold, central banks maintained a very high level of buying in 2023. In the first three quarters of 2023, central banks added almost 800 tons of gold to their inventories, compared with nearly 1100 tons for the whole of 2022. Nevertheless, a shortfall in gold demand was recorded in the second quarter of 2023 as investment and central bank purchases were scaled back. In 2024, gold demand from central banks could be reduced if inflation subsides. But at the same time, investment demand should hold up as interest rates stabilise. Demand is therefore likely to cause corrective movements (pullbacks?).
Two conditions are therefore necessary for a sustainable rise in the value of gold: firstly, the maintenance of sufficient physical demand, and secondly, the presence of a high production cost ensuring a base price for gold.
Market cycles at work
Over the last two years, our expectations for the gold price have been confirmed. These expectations are largely based on the study of gold price cycles and market fundamentals. In 2021, we anticipated that the most likely outcome would be that "the price of gold remains broadly stable towards the end of 2022" (read more). This trend was confirmed despite major bullish and bearish movements during the year (war in Ukraine).
So what is a market cycle (see my book)? A market cycle is the repetition of price patterns in a financial asset. The gold price thus shows a structural cycle of 16-year, particularly useful for contextualizing gold movements. As a result, we usually describe the course of gold in terms of two major cycles: a 16-year cycle and an 8-year cycle. Since 2020, the price of gold has been stagnating, suggesting a potential upturn in 2024, i.e. four years after the major peak of 2020, itself part of an ascending phase of the 16-year cycle.
2024: the year of all pivots!
We then represented the three 16-year cycles in the price of gold recorded since 1978. We then averaged the evolution of these three cycles:
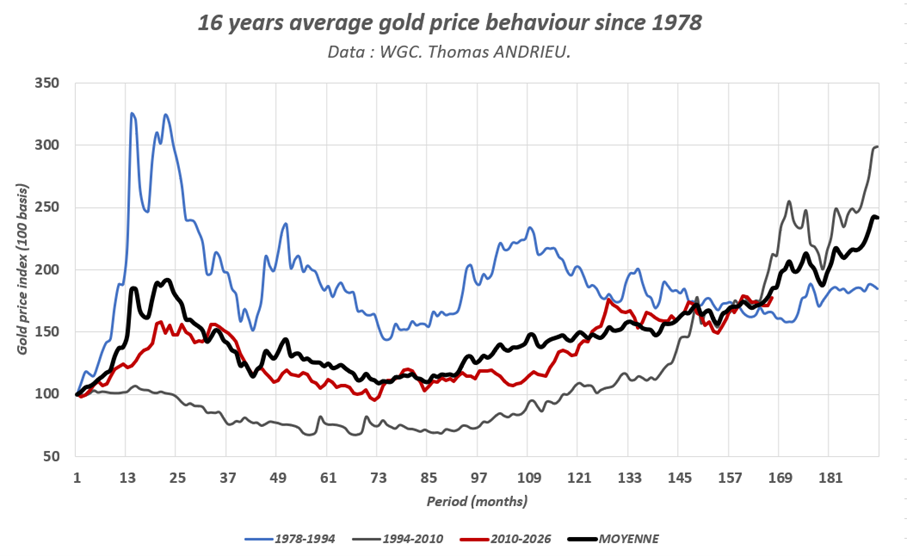
We can immediately see the significant symmetry between the average trend in the price of gold over sixteen years and the trend in the price of gold since 2010 (red and black curves on the chart). It is also remarkable that the rise in the price of gold by the end of 2023 is within this historical average. The 16-year gold cycle therefore leaves a fairly clear scenario open, with an average range of projected gold price rises of between +5% and +20% (the historical average for gold prices at this stage of the cycle being around +7.5%).
Consequently, a precise scenario for 2024 would be a bullish breakout followed by a pullback. But this is a specific scenario, for which its recurrence in the past provides no fundamental explanation to date. We can therefore look at a shorter periodicity using the same method (over eight to nine years):
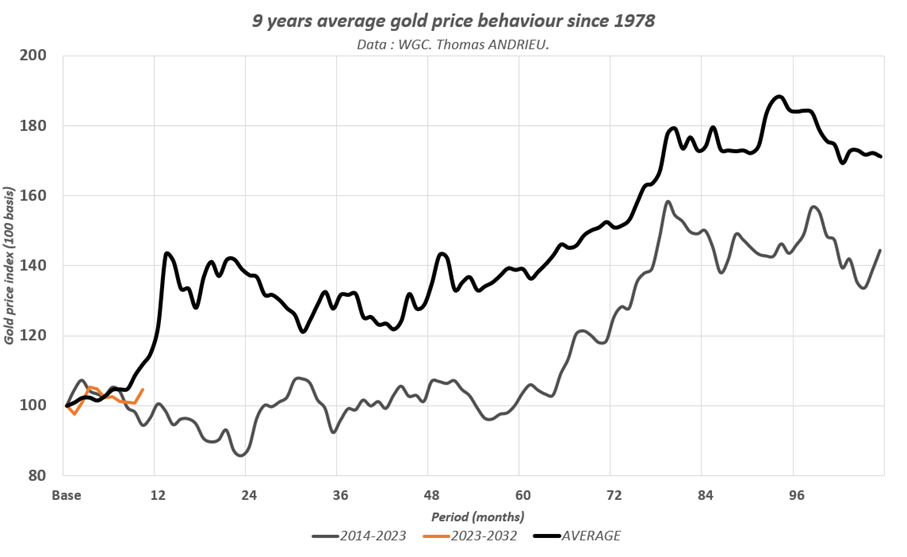
If we break down the gold price into 9-year series, the average movement in the gold price (black curve) shows significant symmetry with the previous cycle (2014-2023). We have already explained that the war in Ukraine has triggered a movement in the price of gold that is highly symmetrical with movements observed in the past. In this context, the average trend in the price of gold at this stage of the cycle suggests the possibility of a potentially high-performance impulsive upward movement (up to +30% within 12 months). Any divergence from this cyclical uptrend is likely to be partially or totally offset in the years ahead.
The year 2024 could therefore be more volatile than 2023, when volatility averaged less than 10% versus 16% (on a monthly basis)!
A look at technical analysis
Finally, technical analysis suggests major resistance around $2075 an ounce, which has been unsuccessfully tested four times since 2020! Conversely, the major supports were the $1820, $1680 and $1620/oz zones at their lows. A sustained break of resistance at $2075 per ounce would therefore lead to the theoretical targets of $2330, $2470 and up to $2520 per ounce. As the gap between the price and the major moving averages is small, this also confirms the potential of the move. The validity of such a movement will have to be confirmed between spring 2024 and mid-2025, because beyond this period, the targets would be less reliable. The study of interferences (cycle synchronicity) also shows favourable timeframes for 2024.
Conversely, a fall in the price of gold would first be reflected in a test of the supports mentioned above. A sustained fall in the price of gold below $1700 an ounce would send a very negative signal, and would reflect the inability of the price of gold to express the fundamental constraints it has undergone in recent years. At the end of 2023, the gold price is flirting with its highs, and although there are many arguments in favor of one direction rather than the other, this has yet to be confirmed from a technical analysis point of view.
In conclusion
Ultimately, the study of the historical behavior of the gold price at this stage suggests two conclusions for 2024:
- The first observation is that the probability of an impulsive move is much higher than in 2023. This makes forecasting potential increases (or decreases) more complex.
- The second observation is that the potential rise could rationally exceed ten percent or more. A scenario of a moderate rise in the price of gold could lead to an increase of between +5% and +7%. Conversely, a stagnant or falling gold price would invalidate the idea of a rising gold price. However, such a fall could be recovered later.
- Nevertheless, the likelihood of an impulsive movement also implies greater volatility, and therefore greater risk, than in recent years (when forecasting was relatively easier). The scenario of a falling or stagnant gold price also presents arguments to consider.
Basically, this favorable outlook would be supported by rising production costs over the past two years. Stabilizing interest rates would also encourage a resumption of upward momentum. Without this upturn, demand for physical gold would be very weak for the year ahead. What's more, the risk of a recession in 2024 appears to be fairly moderate, but it could occur at a later date and thus benefit the eventual continuation of a bullish trend.
On the other hand, continued high interest rates, lack of sufficient demand for gold, more profitable mining companies and less geopolitical tension are all arguments against a higher gold price in the year ahead. 2024 will be a strategic year: the end of four years of stagnation, or the continuation of this stagnation.
"Alea Jacta est" was Julius Caesar's way of crossing the Rubicon...
Reproduction, in whole or in part, is authorized as long as it includes all the text hyperlinks and a link back to the original source.
The information contained in this article is for information purposes only and does not constitute investment advice or a recommendation to buy or sell.


