In a January 2024 publication, JP Morgan unveiled its outlook for the gold price. The world's leading bank, with a market capitalization of over $500 billion, stated that “a cutting cycle is expected to be positive for bullion and supportive of a rally in prices in the second half of 2024”. As gold settles at all-time highs, the prospect of a gold comeback takes hold...
JP Morgan optimistic about gold prices
JP Morgan is optimistic about commodities, and in particular, “for the second consecutive year, the only structural bullish call we hold is for gold and silver”.
JP Morgan's bullish arguments in favour of precious metals are essentially based on monetary policy: “Commodities are unlikely to benefit from core inflation in 2024. Inflation should fall to under 3%, so that, along with properly timing the business cycle, are the two conditions needed to initiate long positions, making the outlook for the sector very tactical in 2024”, said Natasha Kaneva, Head of Global Commodities Strategy at J.P. Morgan.
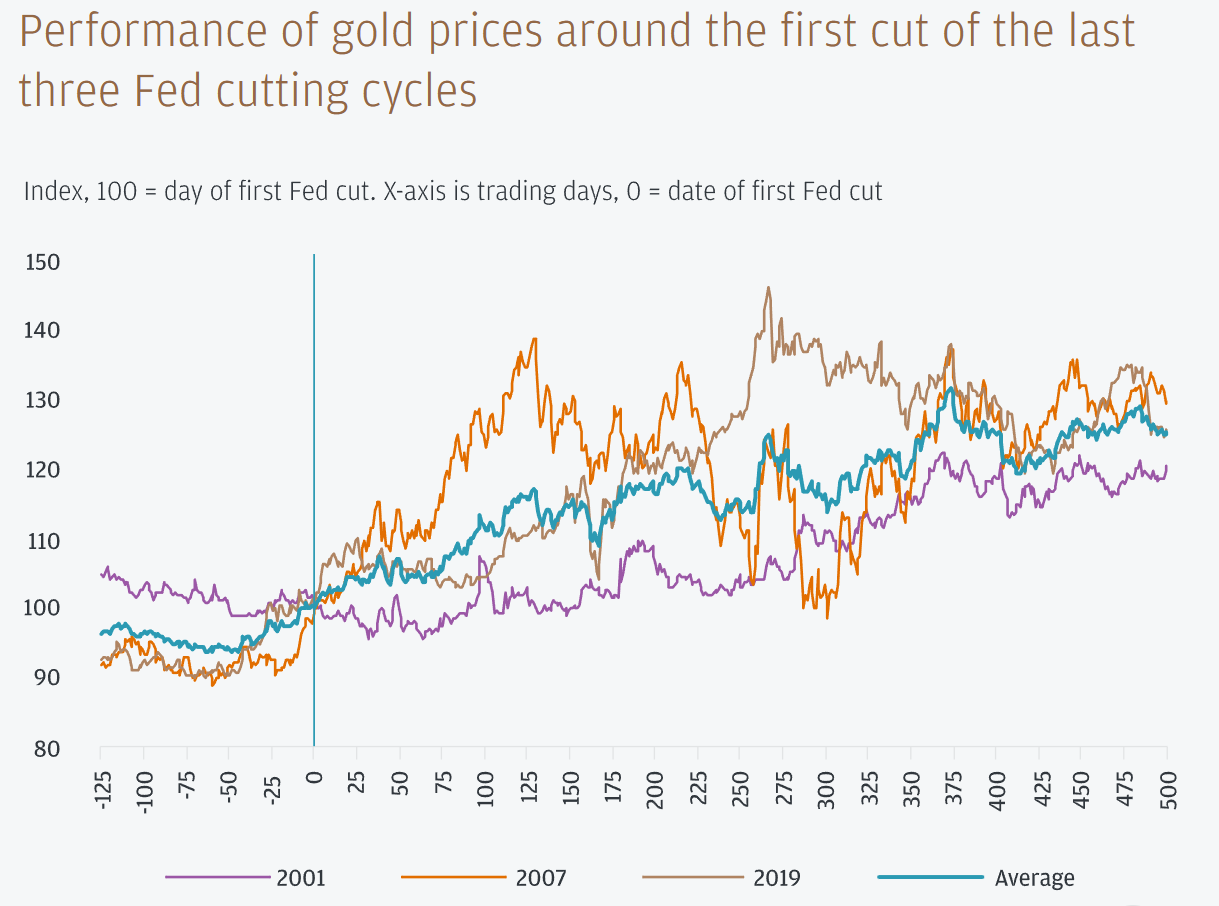
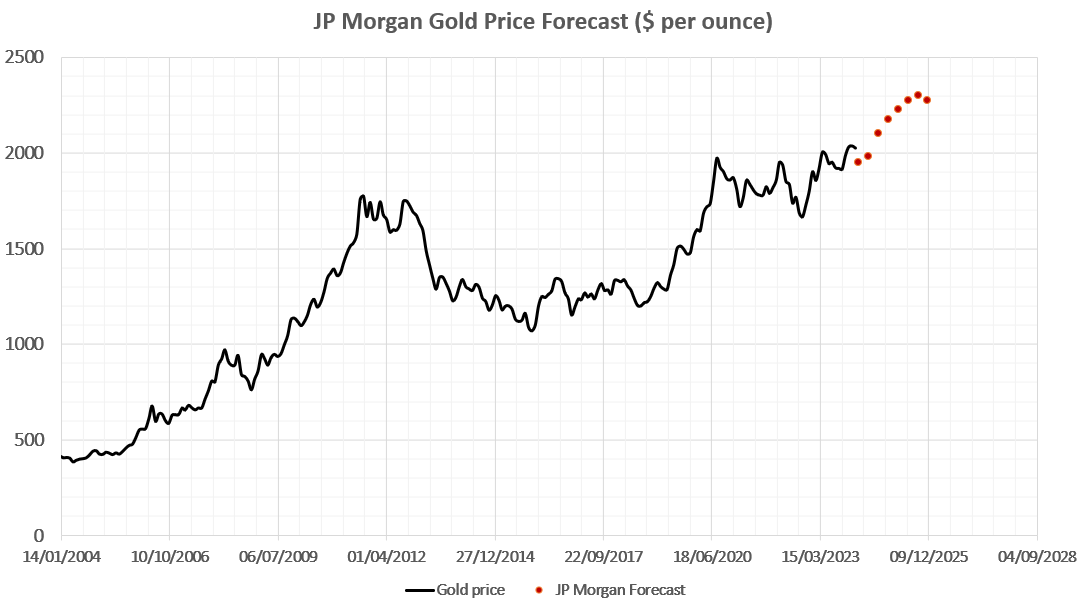
The bank also cites geopolitical risks and downside risks for the dollar and interest rates. JP Morgan points out that key interest rate cuts are historically a favorable scenario for gold, with returns of up to +20% to +30%. The chart below shows JP Morgan's price outlook for 2024 and 2025 :
How strong would this trend be?
JP Morgan notes that “any retracement in the coming months could provide investors with an opportunity to begin positioning for a breakout rally commencing around mid-2024”. JP Morgan's main bet is therefore on the easing of interest rates, which would ultimately benefit the price of gold.
What's more, gold performs even more strongly when we focus solely on its results during periods of falling real rates. In the table below, we have inserted periods of sustained decline in the US real interest rate. On average, this period lasts 3-4 years for a gold price performance of +40%. This corresponds to an average annualized performance of over 10%, i.e. almost double the average annual performance for all years combined.
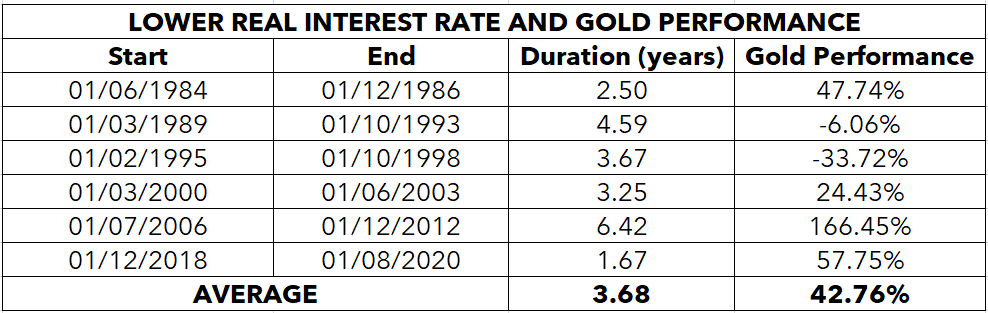
On the basis of the information presented, a 20% to 30% rise in the price of gold would propel the price of the yellow metal to $2,500 and $2,700 per ounce. Similarly, a performance of 40% over four years would set a target of nearly $3,000 an ounce for 2027/2028. But these prospects remain remote and hypothetical without a minimum of fundamentals and historical precedents.
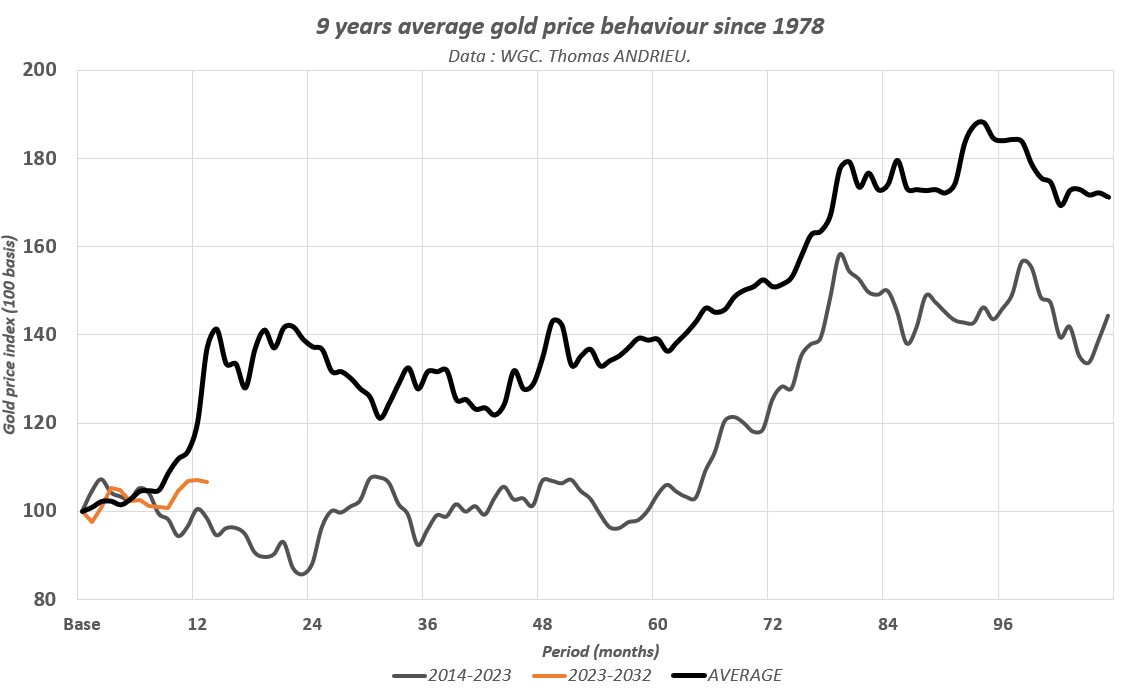
It's worth remembering that gold follows dominant cycles of 16 years and 8 years. The 8-year cycle is said to have bottomed out in recent months, after peaking in mid-2020, while the 16-year cycle is now halfway through. The peak of the 16-year cycle generally occurs in year twelve, i.e. potentially in 2027/2028. We therefore note a good match between these two methodological approaches.
In our last outlook article, we mentioned that the bullish performance of gold in a slightly optimistic scenario could be +5% to +7% in 2024, and up to +30% in the most optimistic scenario. In effect, the temporal symmetry of the price of gold with the past remains, and the different methodological approaches point in broadly the same direction.
Interest and volume on the rise?
The gold price has the consistent advantage of being a physical market. Transactions thus enable us to confirm, or deny, the impetus of trends.
The chart below shows the price of gold together with institutional positions on the gold market (options and futures). The red curve represents the number of contracts held by gold producers and traders, while the green curve represents the number of contracts held by large non-commercial speculators, i.e. mainly managers or funds. The blue curve, often less studied, represents small speculators.
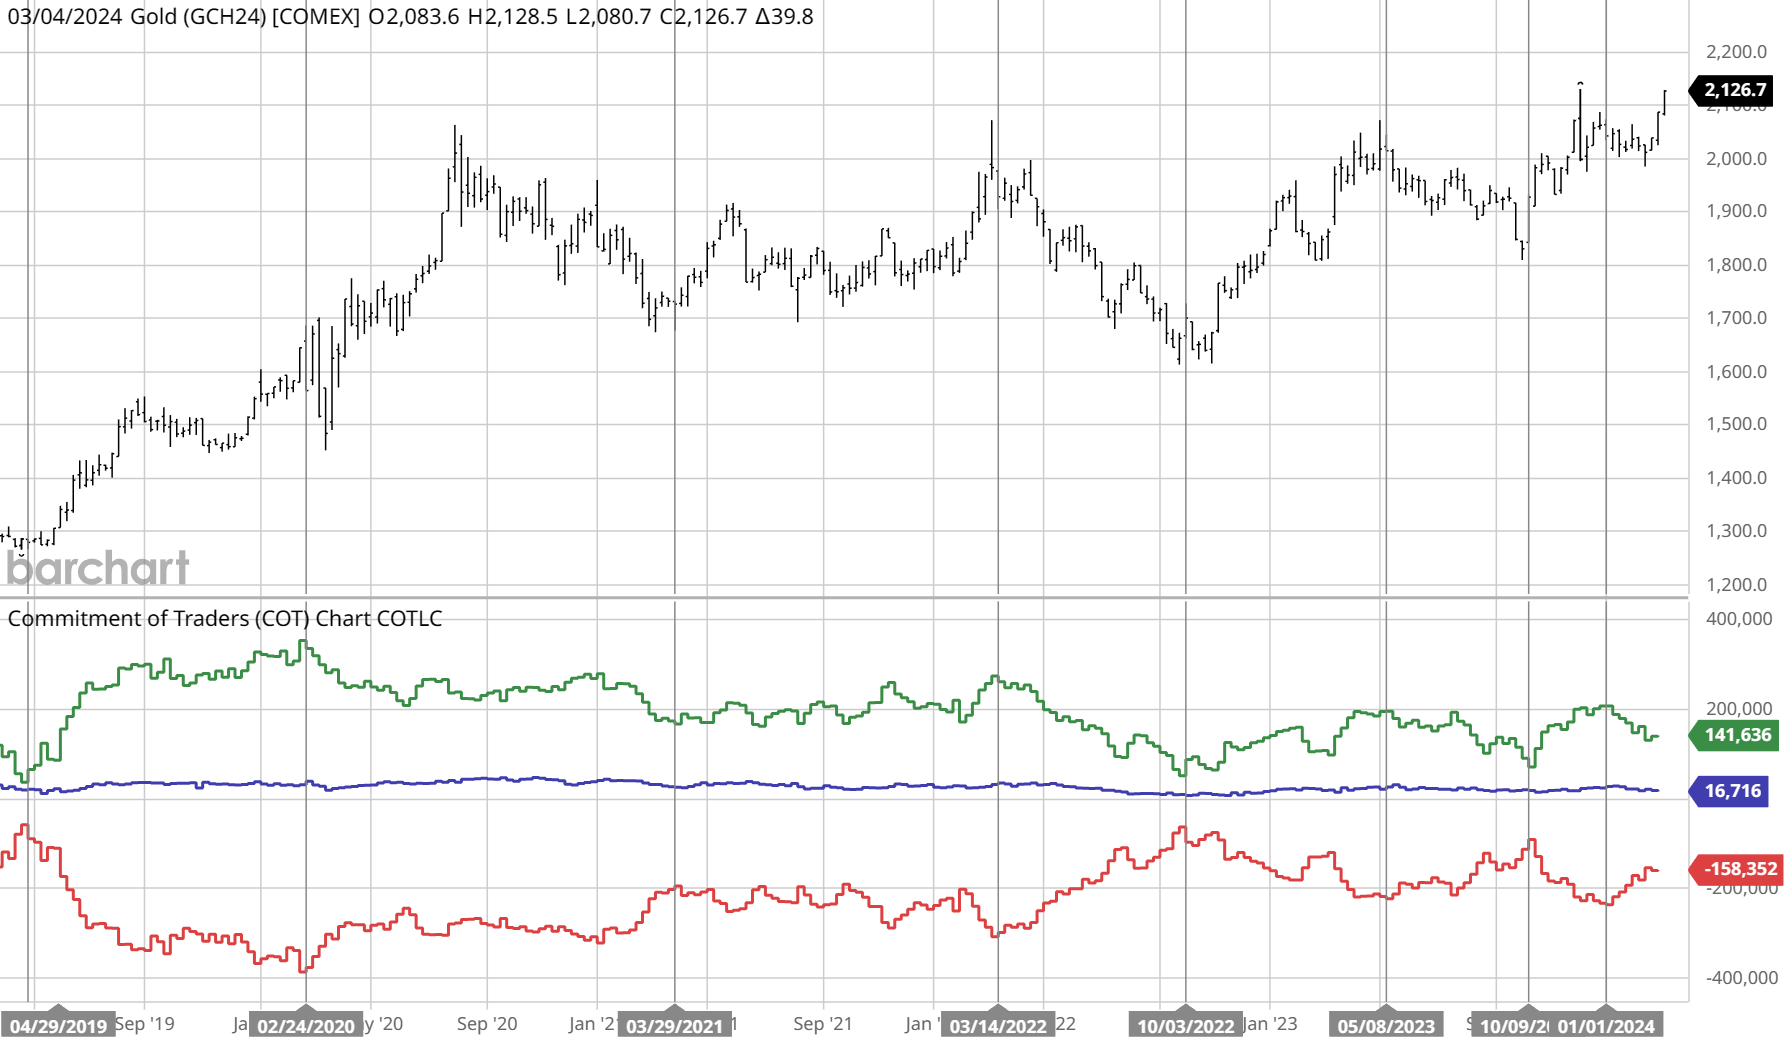
Source: Commitments of Traders (COT) Charts - Barchart.com
Consequently, a rise in the price of gold is ideally accompanied by :
- An increase in the number of contracts opened for purchase (net long) by non-commercial traders (large speculators, funds, etc.).
- An increase in the number of contracts opened for sale (net short) by commercial traders (mining companies, merchants, etc.).
- In this configuration, the buying force increases, while the mining companies and swap dealers provide the counterparty for the sale.
Based on these fundamentals of agent behavior, buy and sell signals are generally very clear. The closer the two curves are to each other, the stronger the buy signal, and vice versa. The major points at which interesting signals are generated are indicated by vertical lines on the chart.
In November 2022, interest in the gold market was at its lowest since 2019! Since this buy signal, open positions have been regaining ground, particularly since November 2023, which confirmed a new bullish rebound with more contracts on the market. Bullish potential remains high, as the open position in the gold market could double to catch up with its 2020 levels.
Fundamental trend set to continue into 2024
According to the World Gold Council for the year 2023, gold production remained stable at 3,644 tons, while the supply of recycled gold rose by almost 10%. Interestingly, massive demand from central banks remained virtually stable (-4%), while investment demand lost ground (-15%). In 2023, gold purchases by central banks remained more than twice normal levels. In the end, however, it was above all the over-the-counter market that saw a strong expansion in demand.
In light of the above, it is likely that a sharp rise in the price of gold will be accompanied by an increase in investment demand. JP Morgan specifies that “Along with central bank interest, increased investor appetite in the physical gold market should also be a major flow contributor to any 2024 gold rally. As of the end of 2023, managed money in net long positions — where more investors expect the price of gold to rise rather than fall — only screened at around 6/10 on a standardized scale, with 10 being the net longest positioning since 2018”. This argument is similar to our analysis of open positions.
For its part, Goldman Sachs asserts that "Gold prices are poised to rise as central banks purchase the precious metal and as strong retail demand in emerging markets bolsters prices". The bank first anticipated a gold price close to $2,200 by the end of 2024, before recently raising its target to $2,500. It is in fact remarkable that demand for gold in China, Russia, Turkey and several emerging countries climbed by more than 10% in 2023. The gold market would thus benefit from global risks, which would stimulate demand in many countries.
Mining companies still under pressure
Finally, the central long-term issue remains the cost of gold production. Mining companies supply the market at a price which, overall, ensures production. This is the "fundamental price" of the long-term gold market.
In the third quarter of 2023, the average production cost of an ounce of gold was estimated at $1,315 per ounce, a more moderate increase on previous periods. For Sarah Tomlinson, “risks that could keep input costs elevated, impacting both the adjusted operating cost and the gross all-in sustaining cost component”. From a statistical point of view, this means that it is unlikely that the price of gold will remain below $2,000 an ounce for long.
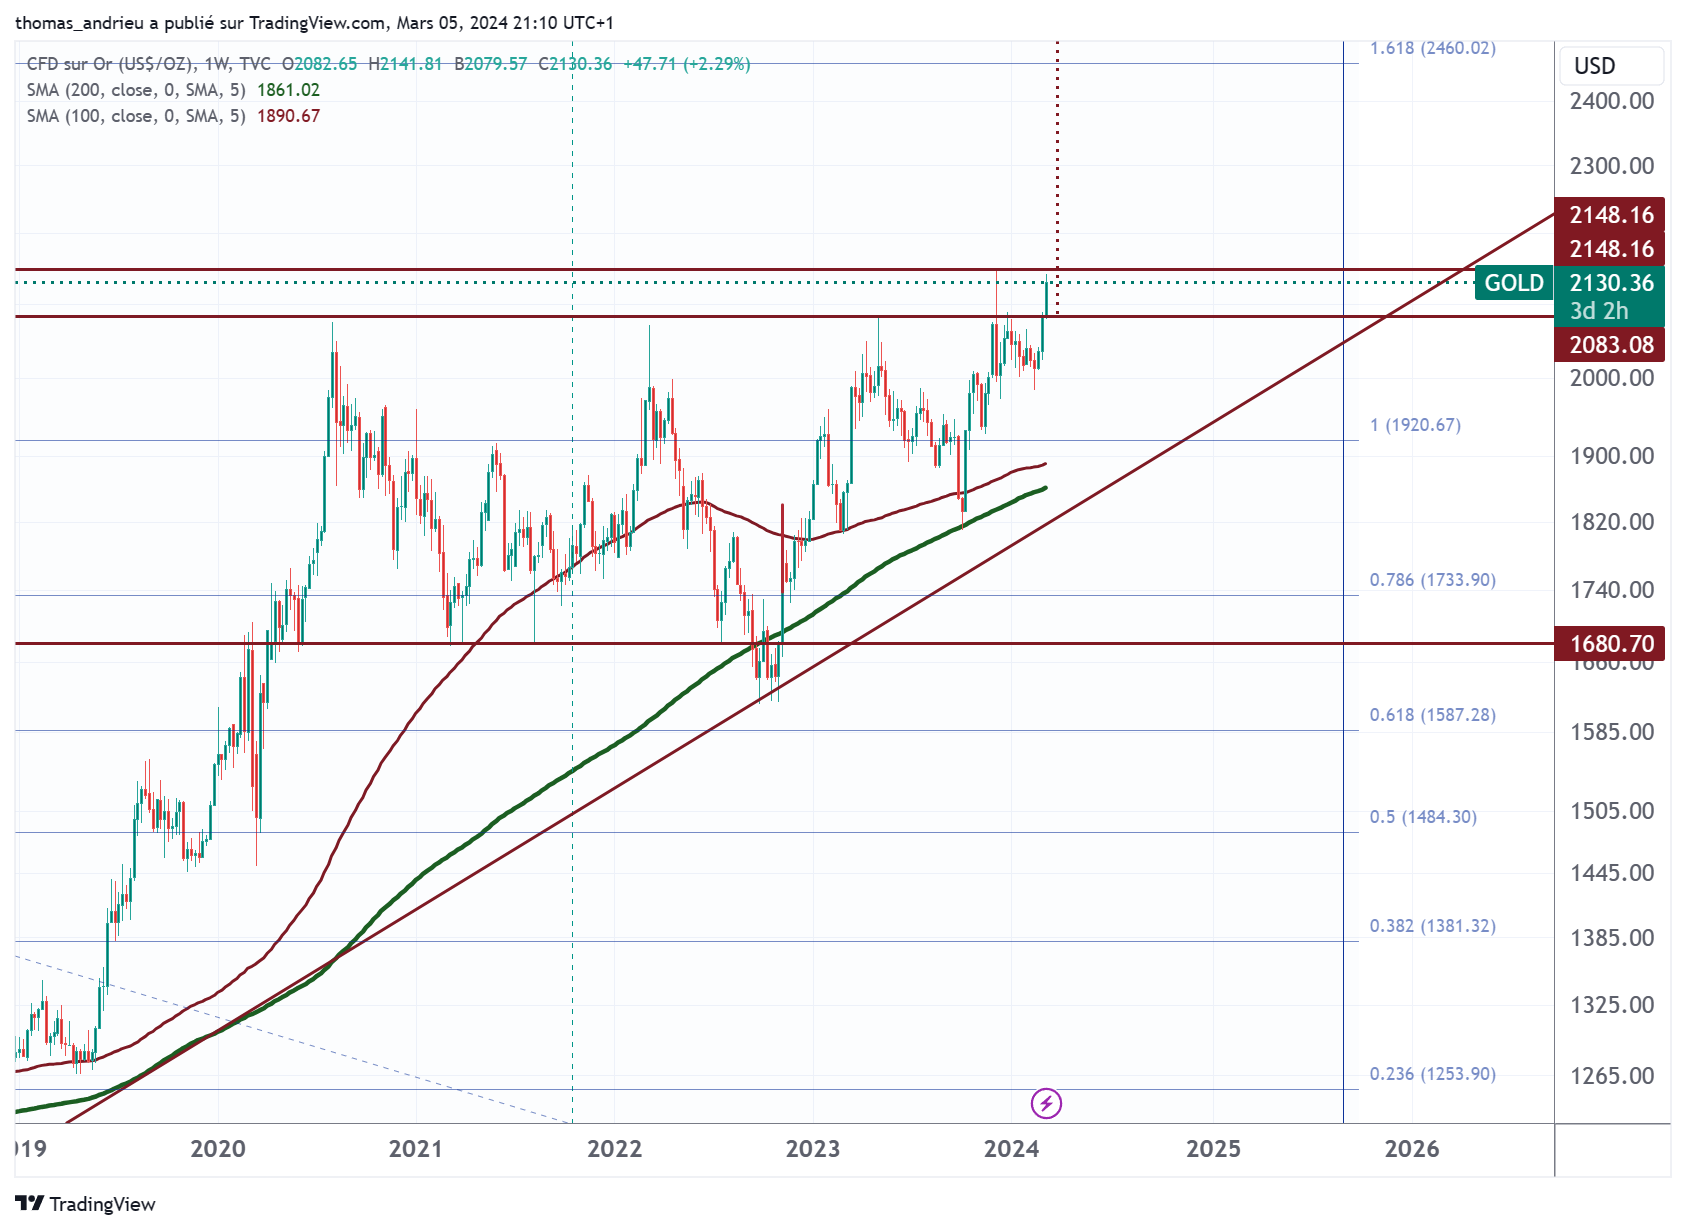
The technical configuration of gold
Finally, gold's technical configuration also looks encouraging. In recent years, two major supports have held the gold price. The first is an oblique support, effective in 2000 and 2018, and reconfirmed in autumn 2022. The second support is located around $1,700, which acts both as a fundamental threshold (unprofitability of many mining companies) and as a powerful technical threshold. Between 2020 and 2024, over the four years of stagnation, this support was tested five times. Conversely, the $2,070/$2,080 zone has acted as a glass ceiling (4 failed tests!). The consolidation rectangle thus formed is about to be broken for good. The resulting long-term objective could be projected as high as $2,600 an ounce (+23%).
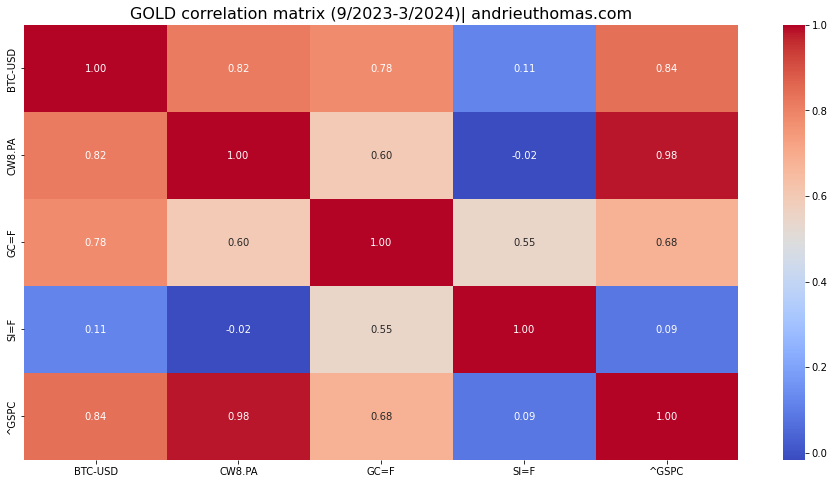
Another key indicator is the correlation of gold prices with other markets. In fact, over the last 6 months (September 2023-March 2024), the correlation between gold and Bitcoin has been as high as 80%! This correlation is much lower for silver (55%) or the MSCI World (60%). In any case, this shows that gold's recent rise is indeed driven by monetary considerations, as is JP Morgan's outlook.
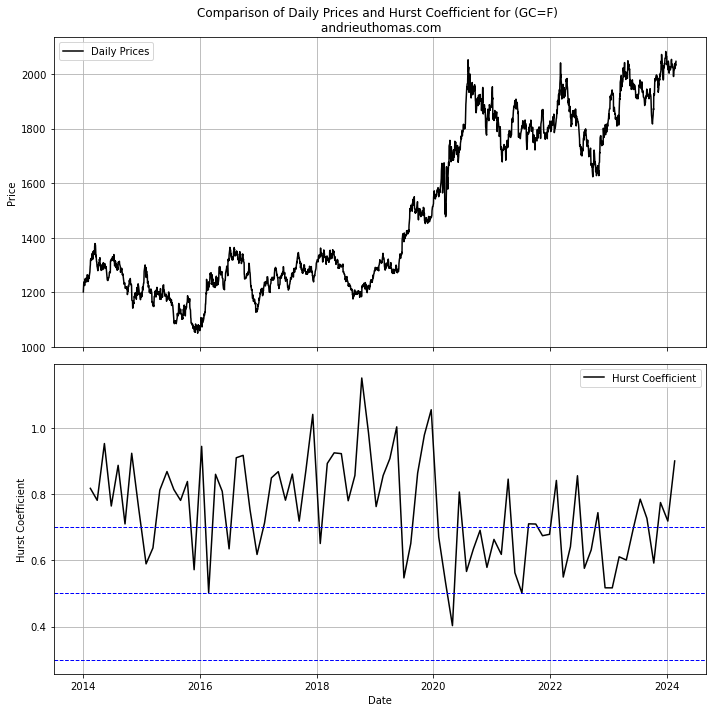
Finally, an encouraging indicator is provided by the study of fractals (Hurst coefficient). This last indicator tells us that the gold price has broken out of a stagnation pattern since the end of 2023. In fact, the Hurst coefficient measures the time-dependency of the price of gold (the coefficient by which asset variations are over-amplified or under-amplified in the long term). Thus, a high long-term Hurst coefficient for gold is a sign of future bullish potential. Conversely, a low Hurst coefficient (below 0.7 over the long term) may indicate a weak medium- to long-term trend.
In conclusion
JP Morgan anticipates a gold price of $2,500/oz in 2024, and even higher in 2025, a target that seems far from unreasonable. A number of fundamental and technical factors point in this direction. A major fundamental argument raised by the world's leading bank is the monetary one. Indeed, the prospect of a key interest rate cut, and thus in the real interest rate, significantly increases the likelihood of gold making lasting highs. On average, cuts in the US real interest rate last three to four years, and are accompanied by a rise in the gold price that can exceed 10% a year. The temporality of this movement would also be confirmed by the study of gold cycles, which we have already had occasion to explain.
JP Morgan also emphasizes the buying potential of the gold market. In fact, a study of open positions shows that the market still offers significant growth potential for investment demand. An increase in the number of open derivative contracts in the coming months would clearly confirm a potentially sustainable trend. For its part, Goldman Sachs, like JP Morgan, sees geopolitical tensions as a factor fuelling demand from emerging countries and many investors. If a sustained bullish breakout takes shape, this movement will ideally be accompanied by mining companies' production and the cost at which they can meet this demand.
Finally, on a technical level, gold could finally break out of four years of sideways stagnation. Fractals offer the potential to do just that. Gold's strong correlation with bitcoin in recent months confirms the hypothesis that an easing of monetary policy would trigger a new phase in the gold cycle, without neglecting the risk of recession or international crisis.
Reproduction, in whole or in part, is authorized as long as it includes all the text hyperlinks and a link back to the original source.
The information contained in this article is for information purposes only and does not constitute investment advice or a recommendation to buy or sell.


